Week 7: 2026’s Biggest Bullies
December 23, 2025College basketball efficiency rankings can be misleading. Some teams inflate their numbers by demolishing weaker opponents far beyond what statistical models predict, while simultaneously failing to meet expectations against quality competition.
This weekly feature identifies the biggest “bullies” in Division I basketball: teams whose efficiency metrics are artificially elevated by their performance against inferior opponents.
The rankings below count from #1 (biggest bully) to #25, highlighting teams that excel at padding stats against overmatched opponents while struggling to meet expectations against quality competition.

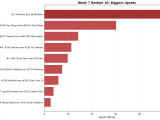
Figure 1: Top 10 teams with the highest bully scores in Week 7. Bully scores reflect the combination of overperformance against weak opponents and underperformance against quality competition.
#1: South Dakota St (7-7)
#176 South Dakota St was projected to beat #331 Georgia State by 10. They cruised to a 105-58 victory, 38 points better than projected. Against #99 Wyoming, South Dakota St lost 87-72. They were projected to win by 8.
Bully Metrics: Exceeded projections by 37.5 total points against weak opponents (1 games); underperformed by 66.9 points against quality competition (5 games).
#2: Penn State (8-4)
Against #303 New Haven, #133 Penn State rolled to a 44-point win, 87-43. The model had them winning by 6; the actual margin was 44, outpacing the projection by 38. Facing #29 Indiana, Penn State came up short, losing 113-72 after being projected to lose by 1.
Bully Metrics: Exceeded projections by 58.9 total points against weak opponents (2 games); underperformed by 94.7 points against quality competition (6 games).
#3: Drake (7-6)
#138 Drake faced #360 Western Illinois as 22-point favorites and won handily 108-57, 29 points above the spread. Drake fell to #77 Murray State 81-72, missing the 12-point projection by 21.
Bully Metrics: Exceeded projections by 28.6 total points against weak opponents (1 games); underperformed by 81.9 points against quality competition (5 games).
#4: Marquette (5-8)
Expected to win by 16 over #335 Little Rock, #123 Marquette coasted to a 89-49 win—beating the line by 24. The model had Marquette winning by 6 against #29 Indiana. Instead, they lost 100-77.
Bully Metrics: Exceeded projections by 24.0 total points against weak opponents (1 games); underperformed by 131.8 points against quality competition (8 games).
#5: Gonzaga (12-1)
#2 Gonzaga cruised to a 122-50 victory against #350 Southern Utah. Favored by 27, the 72-point margin was +45 versus projection. Against #1 Michigan, Gonzaga lost 101-61. They were projected to lose by 1.
Bully Metrics: Exceeded projections by 102.3 total points against weak opponents (3 games); underperformed by 46.8 points against quality competition (9 games).
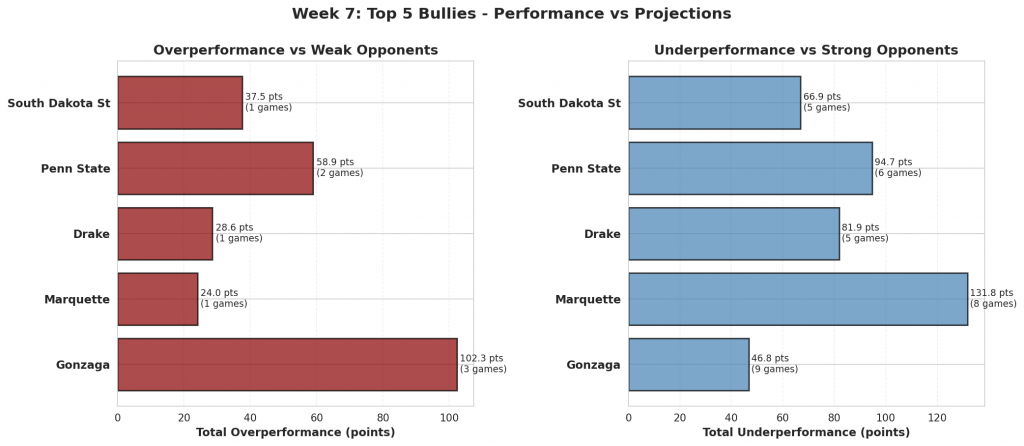
Figure 2: Performance comparison for the top 5 biggest bullies. Red bars show total overperformance against weak opponents; blue bars show total underperformance against strong opponents.
#6: Drexel (6-7)
The model gave #215 Drexel a 11-point edge over #340 NJIT. They rolled to a 32-point win, 75-43, finishing 21 beyond the expected margin. Facing #83 Syracuse, Drexel came up short, losing 80-50 after being projected to lose by 2.
Bully Metrics: Exceeded projections by 21.4 total points against weak opponents (1 games); underperformed by 66.7 points against quality competition (4 games).
#7: Wake Forest (9-4)
#56 Wake Forest handled #264 Campbell, winning 99-51. That 48-point margin was a 38-point swing from the projection. Wake Forest fell to #14 Vanderbilt 98-67, missing the 2-point projection by 33.
Bully Metrics: Exceeded projections by 91.5 total points against weak opponents (3 games); underperformed by 52.3 points against quality competition (7 games).
#8: NC State (9-4)
Facing #324 UNC Greensboro, #22 NC State coasted to a 110-64 win. With a projected spread of 1, the result was 45 points past expectations. The model had NC State winning by 6 against #28 Seton Hall. Instead, they lost 85-74.
Bully Metrics: Exceeded projections by 107.7 total points against weak opponents (3 games); underperformed by 17.5 points against quality competition (9 games).
#9: Hampton (6-7)
#267 Hampton was projected to beat #327 Loyola Maryland by 4. They won comfortably 93-71, 18 points better than projected. Against #19 Virginia, Hampton lost 91-53. They were projected to lose by 8.
Bully Metrics: Exceeded projections by 18.2 total points against weak opponents (1 games); underperformed by 38.9 points against quality competition (2 games).
#10: Lindenwood (8-4)
Against #328 Northern Illinois, #232 Lindenwood rolled to a 35-point win, 99-64. The model had them winning by 3; the actual margin was 35, outpacing the projection by 32. Facing #35 Saint Louis, Lindenwood came up short, losing 109-66 after being projected to lose by 13.
Bully Metrics: Exceeded projections by 47.7 total points against weak opponents (2 games); underperformed by 41.5 points against quality competition (3 games).
#11: ETSU (8-5)
#120 ETSU faced #349 UL Monroe as 14-point favorites and won handily 97-55, 28 points above the spread. ETSU fell to #52 Dayton 88-71, missing the 6-point projection by 11.
Bully Metrics: Exceeded projections by 27.7 total points against weak opponents (1 games); underperformed by 28.2 points against quality competition (3 games).
#12: Wyoming (9-3)
Expected to win by 4 over #288 Denver, #99 Wyoming coasted to a 101-59 win—beating the line by 38. The model had Wyoming losing by 2 against #124 Sam Houston. Instead, they lost 78-70.
Bully Metrics: Exceeded projections by 71.9 total points against weak opponents (2 games); underperformed by 5.6 points against quality competition (5 games).
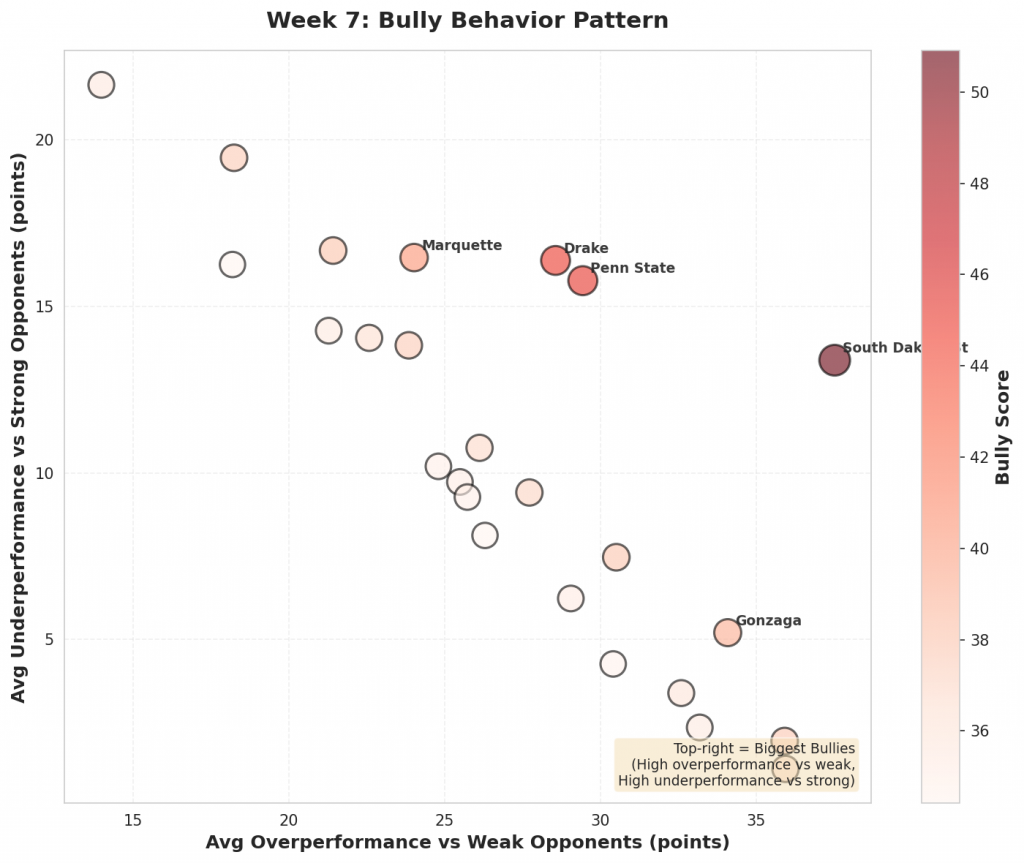
Figure 3: Scatter plot showing the relationship between overperformance against weak opponents (x-axis) and underperformance against strong opponents (y-axis). Bubble size and color indicate bully score magnitude. Top-right quadrant represents the biggest bullies.
#13: Tenn Tech (6-7)
#313 Tenn Tech won comfortably 87-59 against #280 West Georgia. Favored by 2, the 28-point margin was +26 versus projection. Against #17 Kentucky, Tenn Tech lost 104-54. They were projected to lose by 25.
Bully Metrics: Exceeded projections by 26.1 total points against weak opponents (1 games); underperformed by 53.8 points against quality competition (5 games).
#14: Queens University (5-7)
The model gave #187 Queens University a 5-point edge over #362 Gardner-Webb. They rolled to a 33-point win, 107-74, finishing 28 beyond the expected margin. Facing #56 Wake Forest, Queens University came up short, losing 111-73 after being projected to lose by 9.
Bully Metrics: Exceeded projections by 67.7 total points against weak opponents (3 games); underperformed by 84.3 points against quality competition (6 games).
#15: Illinois (8-3)
#27 Illinois handled #361 Jackson State, winning 113-55. That 58-point margin was a 37-point swing from the projection. Illinois fell to #12 UConn 74-61, missing the 3-point projection by 10.
Bully Metrics: Exceeded projections by 65.2 total points against weak opponents (2 games); underperformed by 30.5 points against quality competition (9 games).
#16: CSU Northridge (7-5)
Facing #219 Delaware, #273 CSU Northridge took care of business, winning 88-66. With a projected spread of 6, the result was 16 points past expectations. The model had CSU Northridge winning by 5 against #183 Idaho State. Instead, they lost 82-50.
Bully Metrics: Exceeded projections by 28.0 total points against weak opponents (2 games); underperformed by 108.3 points against quality competition (5 games).
#17: Dartmouth (5-6)
#228 Dartmouth was projected to beat #244 Saint Peter’s by 2. They won comfortably 87-61, 24 points better than projected. Against #92 Marist, Dartmouth lost 75-56. They were projected to win by 0.
Bully Metrics: Exceeded projections by 42.6 total points against weak opponents (2 games); underperformed by 42.8 points against quality competition (3 games).
#18: Saint Louis (11-1)
Against #275 Bethune-Cookman, #35 Saint Louis rolled to a 59-point win, 112-53. The model had them winning by 10; the actual margin was 59, outpacing the projection by 49. Facing #86 Stanford, Saint Louis came up short, losing 78-77 after being projected to win by 11.
Bully Metrics: Exceeded projections by 165.9 total points against weak opponents (5 games); underperformed by 11.8 points against quality competition (5 games).
#19: Old Dominion (4-9)
#210 Old Dominion faced #356 Morgan State as 3-point favorites and won handily 88-56, 29 points above the spread. Old Dominion fell to #97 George Washington 96-73, missing the 10-point projection by 13.
Bully Metrics: Exceeded projections by 29.0 total points against weak opponents (1 games); underperformed by 43.6 points against quality competition (7 games).
#20: St Peter’s (4-5)
Expected to win by 2 over #344 Niagara, #244 St Peter’s took care of business, winning 71-43—beating the line by 26. The model had St Peter’s losing by 0 against #28 Seton Hall. Instead, they lost 77-50.
Bully Metrics: Exceeded projections by 25.5 total points against weak opponents (1 games); underperformed by 29.2 points against quality competition (3 games).
#21: Pitt (7-6)
#85 Pitt cruised to a 103-63 victory against #352 Binghamton. Favored by 14, the 40-point margin was +26 versus projection. Against #38 West Virginia, Pitt lost 71-49. They were projected to win by 2.
Bully Metrics: Exceeded projections by 51.5 total points against weak opponents (2 games); underperformed by 92.8 points against quality competition (10 games).
#22: American (7-5)
The model gave #233 American a 1-point edge over #284 Longwood. They pulled away for a 92-66 win, finishing 25 beyond the expected margin. Facing #97 George Washington, American came up short, losing 107-67 after being projected to lose by 3.
Bully Metrics: Exceeded projections by 24.8 total points against weak opponents (1 games); underperformed by 61.2 points against quality competition (6 games).
#23: St John’s (7-4)
#21 St John’s handled #315 Bucknell, winning 97-49. That 48-point margin was a 30-point swing from the projection. St John’s fell to #17 Kentucky 78-66, missing the 3-point projection by 15.
Bully Metrics: Exceeded projections by 30.4 total points against weak opponents (1 games); underperformed by 42.6 points against quality competition (10 games).
#24: Wofford (7-5)
Facing #362 Gardner-Webb, #223 Wofford took care of business, winning 83-57. With a projected spread of 8, the result was 18 points past expectations. The model had Wofford winning by 3 against #122 Elon. Instead, they lost 73-52.
Bully Metrics: Exceeded projections by 18.2 total points against weak opponents (1 games); underperformed by 65.0 points against quality competition (4 games).
#25: Minnesota (7-5)
#102 Minnesota was projected to beat #346 Alcorn State by 10. They cruised to a 95-50 victory, 35 points better than projected. Against #5 Purdue, Minnesota lost 85-57. They were projected to lose by 11.
Bully Metrics: Exceeded projections by 105.2 total points against weak opponents (4 games); underperformed by 48.7 points against quality competition (6 games).
What This Means
These rankings highlight teams whose efficiency numbers may not tell the full story. While crushing inferior opponents is expected, doing so far beyond statistical projections while simultaneously underperforming against quality teams suggests inflated metrics.
Actionable Advice
- Safe Bets vs Weak Teams: These teams are “flat-track bullies”—they don’t let up. They are often safe bets to cover large spreads against inferior competition because they play hard for 40 minutes regardless of the score.
- Fade vs Strong Teams: Be extremely careful backing these teams against quality opponents. Their efficiency metrics are artificially inflated by their bully behavior, often leading to them being overvalued favorites against teams that can actually punch back.
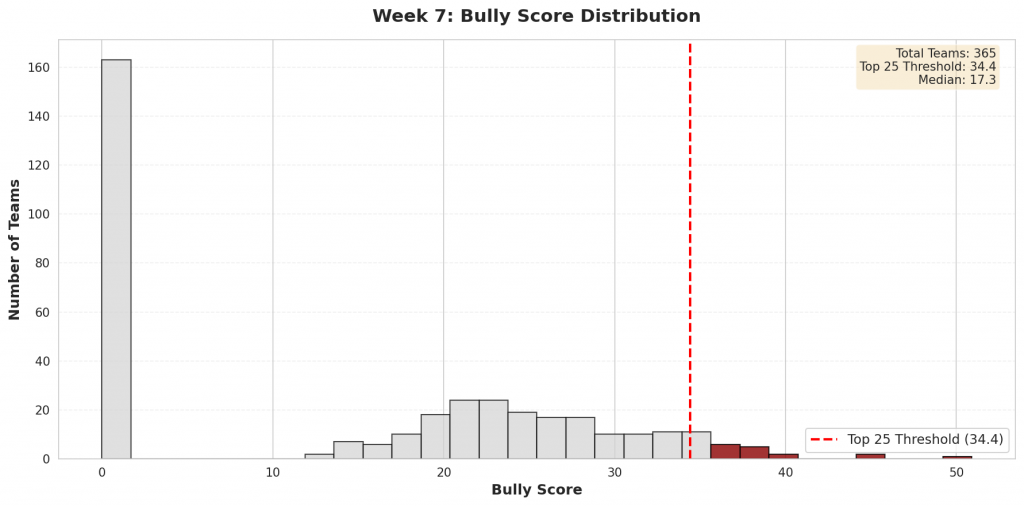
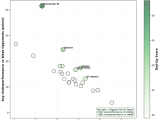
Figure 4: Distribution of bully scores across all Division I teams. The top 25 bullies (highlighted in red) represent teams whose efficiency metrics are most inflated by their performance patterns.
Check back next week for updated bully rankings.