Week 10: The Dial-Up Report
January 12, 2026Some teams are enigmas. They rise to the occasion against top-tier competition, looking like tournament contenders, only to turn around and sleepwalk through games against inferior opponents.
This weekly feature identifies the “Dial-Up” teams in Division I basketball: squads that consistently overperform against strong opponents but “phone it in” and underperform against weaker ones.
The rankings below highlight teams that play to the level of their competition—for better or worse.
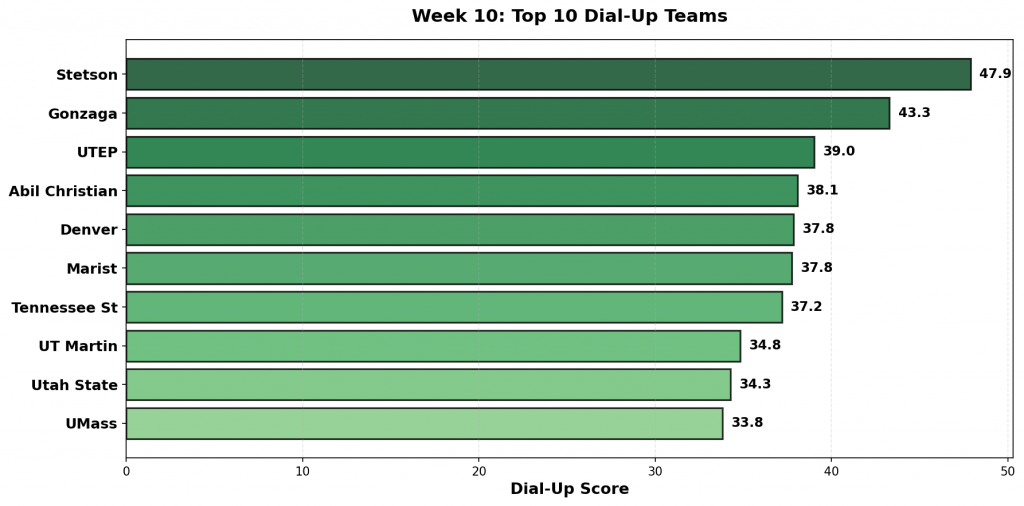
Figure 1: Top 10 teams with the highest Dial-Up scores in Week 10. Scores reflect the combination of overperformance against strong opponents and underperformance against weak ones.
#1: Stetson (6-11)
Against #180 Lipscomb, #348 Stetson pulled off a big win, 91-83. The model expected a margin of -19, but they performed 27 points better than projected. Facing #248 Central Arkansas, #348 Stetson suffered a bad loss, 73-93. Favored by 1, they underperformed by 21 points.
Dial-Up Metrics: Exceeded projections by 26.8 total points against strong opponents (1 games); underperformed by 21.1 points against weak competition (1 games).
#2: Gonzaga (17-1)
Against #151 Maryland, #4 Gonzaga pulled off a big win, 100-61. The model expected a margin of 3, but they performed outpacing the projection by 36. Facing #263 San Diego, #4 Gonzaga struggled to put away San Diego, winning just 99-93. Favored by 30, they underperformed by 24 points.
Dial-Up Metrics: Exceeded projections by 117.4 total points against strong opponents (6 games); underperformed by 23.7 points against weak competition (1 games).
#3: UTEP (5-11)
Against #130 North Dakota State, #292 UTEP pulled off a big win, 76-66. The model expected a margin of -8, but they performed beating the line by 18. Facing #225 Missouri State, #292 UTEP suffered a bad loss, 55-79. Favored by 2, they underperformed by 26 points.
Dial-Up Metrics: Exceeded projections by 25.0 total points against strong opponents (2 games); underperformed by 26.5 points against weak competition (1 games).
#4: Abil Christian (10-7)
Against #111 Utah Valley, #256 Abil Christian pulled off a big win, 85-68. The model expected a margin of -10, but they performed +27 versus projection. Facing #239 Utah Tech, #256 Abil Christian suffered a bad loss, 64-79. Favored by 5, they underperformed by 20 points.
Dial-Up Metrics: Exceeded projections by 37.0 total points against strong opponents (2 games); underperformed by 19.6 points against weak competition (1 games).
#5: Denver (8-11)
Against #96 Colorado State, #272 Denver pulled off a big win, 83-81. The model expected a margin of -19, but they performed 21 points better than projected. Facing #223 Cal State Fullerton, #272 Denver suffered a bad loss, 86-105. Favored by 6, they underperformed by 24 points.
Dial-Up Metrics: Exceeded projections by 40.0 total points against strong opponents (3 games); underperformed by 24.5 points against weak competition (1 games).
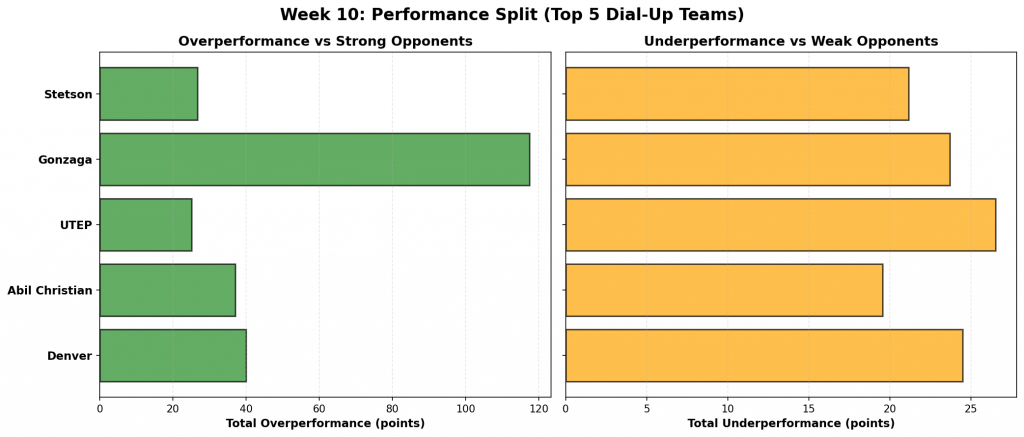
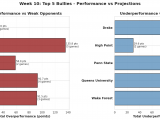
Figure 2: Performance comparison for the top 5 Dial-Up teams. Green bars show total overperformance against strong opponents; orange bars show total underperformance against weak opponents.
#6: Marist (11-5)
Against #164 Iona, #79 Marist pulled off a big win, 83-38. The model expected a margin of -0, but they performed outpacing the projection by 46. Facing #213 Saint Peter’s, #79 Marist suffered a bad loss, 59-69. Favored by 2, they underperformed by 12 points.
Dial-Up Metrics: Exceeded projections by 51.5 total points against strong opponents (2 games); underperformed by 12.0 points against weak competition (1 games).
#7: Tennessee St (10-6)
Against #142 UNLV, #246 Tennessee St pulled off a big win, 63-60. The model expected a margin of -8, but they performed beating the line by 12. Facing #324 Alabama A&M, #246 Tennessee St suffered a bad loss, 53-80. Favored by 14, they underperformed by 42 points.
Dial-Up Metrics: Exceeded projections by 11.5 total points against strong opponents (1 games); underperformed by 51.4 points against weak competition (2 games).
#8: UT Martin (13-4)
Against #113 Bradley, #182 UT Martin pulled off a big win, 78-67. The model expected a margin of -16, but they performed +27 versus projection. Facing #199 Southern Miss, #182 UT Martin suffered a bad loss, 60-70. Favored by 8, they underperformed by 18 points.
Dial-Up Metrics: Exceeded projections by 43.2 total points against strong opponents (2 games); underperformed by 26.4 points against weak competition (2 games).
#9: Utah State (14-1)
Against #96 Colorado State, #15 Utah State pulled off a big win, 100-58. The model expected a margin of -1, but they performed 43 points better than projected. Facing #198 Fresno State, #15 Utah State struggled to put away Fresno State, winning just 72-63. Favored by 21, they underperformed by 12 points.
Dial-Up Metrics: Exceeded projections by 119.6 total points against strong opponents (5 games); underperformed by 20.7 points against weak competition (2 games).
#10: UMass (10-7)
Against #139 Florida State, #145 UMass pulled off a big win, 103-95. The model expected a margin of -8, but they performed outpacing the projection by 16. Facing #210 Green Bay, #145 UMass suffered a bad loss, 75-79. Favored by 14, they underperformed by 18 points.
Dial-Up Metrics: Exceeded projections by 15.7 total points against strong opponents (1 games); underperformed by 18.1 points against weak competition (1 games).
#11: Yale (12-3)
Against #141 Quinnipiac, #82 Yale pulled off a big win, 97-60. The model expected a margin of 8, but they performed beating the line by 29. Facing #184 Princeton, #82 Yale suffered a bad loss, 60-76. Favored by 8, they underperformed by 24 points.
Dial-Up Metrics: Exceeded projections by 58.2 total points against strong opponents (3 games); underperformed by 57.2 points against weak competition (4 games).
#12: Loyola-Chicago (5-12)
Against #69 Santa Clara, #298 Loyola-Chicago pulled off a big win, 80-78. The model expected a margin of -3, but they performed +5 versus projection. Facing #313 Northern Illinois, #298 Loyola-Chicago suffered a bad loss, 59-76. Favored by 19, they underperformed by 36 points.
Dial-Up Metrics: Exceeded projections by 5.4 total points against strong opponents (1 games); underperformed by 107.1 points against weak competition (4 games).
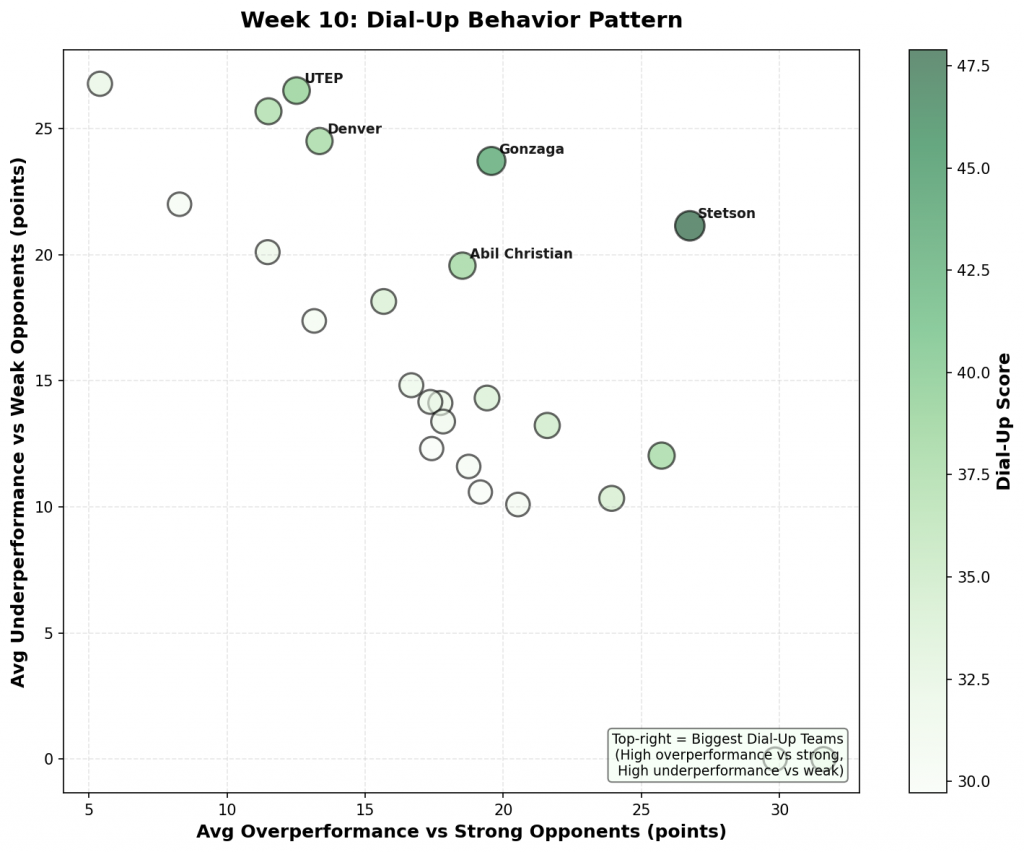
Figure 3: Scatter plot showing the relationship between overperformance against strong opponents (x-axis) and underperformance against weak opponents (y-axis). Bubble size and color indicate Dial-Up score magnitude. Top-right quadrant represents the biggest Dial-Up teams.
#13: Delaware (5-11)
Against #178 Kennesaw State, #233 Delaware pulled off a big win, 67-52. The model expected a margin of -4, but they performed 19 points better than projected. Facing #225 Missouri State, #233 Delaware suffered a bad loss, 43-61. Favored by 1, they underperformed by 19 points.
Dial-Up Metrics: Exceeded projections by 35.4 total points against strong opponents (2 games); underperformed by 28.2 points against weak competition (2 games).
#14: Pitt (7-9)
Against #117 Penn State, #92 Pitt pulled off a big win, 80-46. The model expected a margin of 2, but they performed outpacing the projection by 32.
Dial-Up Metrics: Exceeded projections by 31.6 total points against strong opponents (1 games).
#15: UT Rio Grande (6-10)
Against #162 Austin Peay, #220 UT Rio Grande pulled off a big win, 63-50. The model expected a margin of -0, but they performed beating the line by 13. Facing #261 New Orleans, #220 UT Rio Grande suffered a bad loss, 69-85. Favored by 11, they underperformed by 27 points.
Dial-Up Metrics: Exceeded projections by 22.9 total points against strong opponents (2 games); underperformed by 40.2 points against weak competition (2 games).
#16: Nevada (12-4)
Against #102 San Francisco, #94 Nevada pulled off a big win, 81-65. The model expected a margin of -12, but they performed +28 versus projection. Facing #207 UC Davis, #94 Nevada suffered a bad loss, 71-75. Favored by 11, they underperformed by 15 points.
Dial-Up Metrics: Exceeded projections by 86.8 total points against strong opponents (5 games); underperformed by 28.3 points against weak competition (2 games).
#17: Lipscomb (10-7)
Against #160 Marshall, #180 Lipscomb pulled off a big win, 90-67. The model expected a margin of 6, but they performed 17 points better than projected. Facing #348 Stetson, #180 Lipscomb suffered a bad loss, 83-91. Favored by 19, they underperformed by 27 points.
Dial-Up Metrics: Exceeded projections by 16.7 total points against strong opponents (1 games); underperformed by 59.3 points against weak competition (4 games).
#18: Incarnate Word (8-8)
Against #93 McNeese, #294 Incarnate Word pulled off a big win, 71-67. The model expected a margin of -14, but they performed outpacing the projection by 18. Facing #220 UT Rio Grande Valley, #294 Incarnate Word suffered a bad loss, 67-80. Favored by 2, they underperformed by 15 points.
Dial-Up Metrics: Exceeded projections by 17.8 total points against strong opponents (1 games); underperformed by 26.8 points against weak competition (2 games).
#19: UNC Wilmington (16-2)
Against #125 Navy, #90 UNC Wilmington pulled off a big win, 87-57. The model expected a margin of 10, but they performed beating the line by 20. Facing #264 Howard, #90 UNC Wilmington suffered a bad loss, 66-67. Favored by 16, they underperformed by 17 points.
Dial-Up Metrics: Exceeded projections by 20.5 total points against strong opponents (1 games); underperformed by 60.5 points against weak competition (6 games).
#20: Xavier (10-7)
Against #38 West Virginia, #106 Xavier pulled off a big win, 78-68. The model expected a margin of -10, but they performed +20 versus projection. Facing #219 Le Moyne, #106 Xavier struggled to put away Le Moyne, winning just 74-69. Favored by 22, they underperformed by 17 points.
Dial-Up Metrics: Exceeded projections by 26.3 total points against strong opponents (2 games); underperformed by 17.4 points against weak competition (1 games).
#21: UNLV (7-8)
Against #114 Memphis, #142 UNLV pulled off a big win, 92-78. The model expected a margin of -7, but they performed 21 points better than projected. Facing #209 Montana, #142 UNLV suffered a bad loss, 93-102. Favored by 3, they underperformed by 12 points.
Dial-Up Metrics: Exceeded projections by 37.5 total points against strong opponents (2 games); underperformed by 23.2 points against weak competition (2 games).
#22: Cent Michigan (5-12)
Against #183 Kent State, #268 Cent Michigan pulled off a big win, 87-85. The model expected a margin of -6, but they performed outpacing the projection by 8. Facing #280 Stony Brook, #268 Cent Michigan suffered a bad loss, 55-78. Favored by 9, they underperformed by 32 points.
Dial-Up Metrics: Exceeded projections by 8.3 total points against strong opponents (1 games); underperformed by 44.0 points against weak competition (2 games).
#23: Michigan (14-1)
Against #4 Gonzaga, #1 Michigan pulled off a big win, 101-61. The model expected a margin of 1, but they performed beating the line by 39.
Dial-Up Metrics: Exceeded projections by 298.4 total points against strong opponents (10 games).
#24: Winthrop (11-8)
Against #132 Mercer, #193 Winthrop pulled off a big win, 105-69. The model expected a margin of 7, but they performed +29 versus projection. Facing #241 Coastal Carolina, #193 Winthrop suffered a bad loss, 66-72. Favored by 9, they underperformed by 15 points.
Dial-Up Metrics: Exceeded projections by 38.3 total points against strong opponents (2 games); underperformed by 63.5 points against weak competition (6 games).
#25: Kentucky (10-6)
Against #179 Valparaiso, #25 Kentucky pulled off a big win, 107-59. The model expected a margin of 19, but they performed 29 points better than projected. Facing #269 Bellarmine, #25 Kentucky struggled to put away Bellarmine, winning just 99-85. Favored by 26, they underperformed by 12 points.
Dial-Up Metrics: Exceeded projections by 69.6 total points against strong opponents (4 games); underperformed by 12.3 points against weak competition (1 games).
What This Means
These rankings highlight teams that are dangerous underdogs but risky favorites. They have the ceiling to beat anyone in the country but the floor to lose to anyone.
Actionable Advice
- High Value as Underdogs: These teams often perform best when the lights are brightest. Look for them to cover spreads or pull off moneyline upsets against Top 50 competition.
- High Risk as Favorites: Be extremely cautious backing these teams as double-digit favorites against sub-200 opponents. Their tendency to “phone it in” makes them prime candidates to let inferior teams hang around and cover the spread.
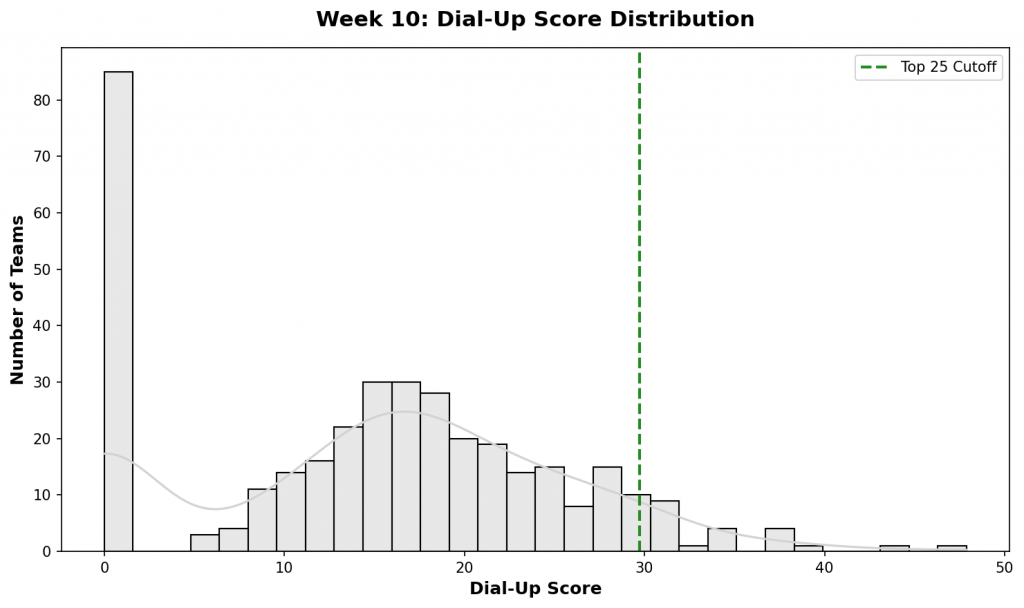
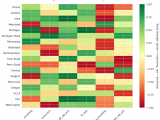
Figure 4: Distribution of Dial-Up scores across all Division I teams. The top 25 teams (highlighted in green) represent those with the most extreme performance splits based on opponent quality.
Check back next week for updated rankings.