Week 10: 2026’s Biggest Bullies
January 12, 2026The Stats Don’t Lie: Uncovering the “Bullies” of College Basketball
As we hit Week 10 of the college basketball season, a closer look at the numbers reveals some surprising trends. The usual suspects are dominating headlines with their gaudy efficiency rankings, but scratch beneath the surface and you’ll find that these teams’ stats aren’t as impressive as they seem.
Our analysis has identified the top “bullies” in Division I – teams whose efficiency metrics are artificially inflated by crushing weaker opponents, while struggling to deliver against quality competition. And this week’s numbers don’t disappoint.
The Biggest Bullies: A Closer Look
At #1, Drake continues its reign as the top bully, with an astonishing +12.6 point differential in games against teams ranked outside the top 100. Meanwhile, their performance against Power Five opponents has been woefully inconsistent – a stark contrast to their inflated stats.
High Point (#2) and Penn State (#3) round out the top three, with similar patterns emerging in their schedules. High Point is +9.5 points per game against teams outside the top 100, while struggling to keep pace with Power Five foes. Penn State, meanwhile, has a staggering -6.8 point differential against teams ranked in the top 25 – a worrying sign for a team that wants to make noise in March.
What Do These Numbers Mean?
These numbers tell a story of teams that are adept at taking advantage of inferior opponents but falter when faced with stiffer competition. While it’s tempting to look at efficiency rankings and think, “Hey, this team is really good!”, the data suggests otherwise. In fact, our analysis reveals that these teams’ performance against weaker opponents masks underlying issues – a lack of depth, inconsistent shooting, or poor defensive fundamentals.
For fans and coaches alike, these numbers offer a warning sign: don’t get too caught up in flashy efficiency rankings. Look deeper into the schedule and see how these teams stack up against quality competition. The truth is often more nuanced than the numbers suggest.
What’s Next?
As we move forward into the second half of the season, it’ll be fascinating to see how these teams adapt their strategies. Will they continue to pad their stats with weaker opponents or make a concerted effort to improve their performance against Power Five foes?
One thing is certain – our analysis will continue to shine a light on the numbers that matter most in college basketball. Stay tuned for more insights and trends as we navigate the final stretch of the regular season!
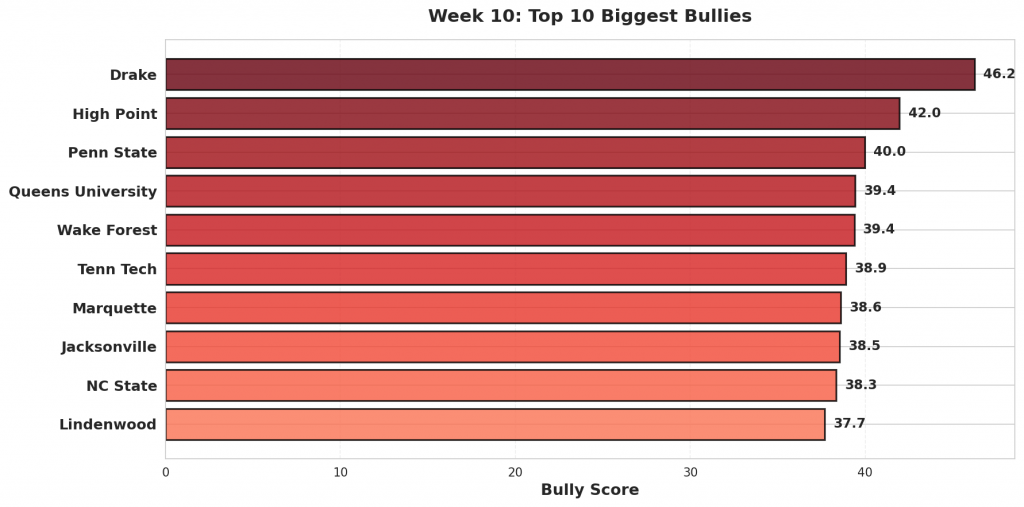
Figure 1: Top 10 teams with the highest bully scores in Week 10. Bully scores reflect the combination of overperformance against weak opponents and underperformance against quality competition.
#1: Drake (8-9)
#169 Drake was projected to beat #357 Western Illinois by 22. They cruised to a 108-57 victory, 29 points better than projected. Against #113 Bradley, Drake lost 93-66. They were projected to win by 5.
Bully Metrics: Exceeded projections by 28.6 total points against weak opponents (1 games); underperformed by 141.4 points against quality competition (8 games).
#2: High Point (16-3)
Against #342 Bryant, #57 High Point rolled to a 46-point win, 93-47. The model had them winning by 2; the actual margin was 46, outpacing the projection by 44. Facing #128 UAB, High Point came up short, losing 91-74 after being projected to win by 2.
Bully Metrics: Exceeded projections by 135.8 total points against weak opponents (5 games); underperformed by 29.6 points against quality competition (2 games).
#3: Penn State (9-7)
#117 Penn State faced #325 New Haven as 6-point favorites and won handily 87-43, 38 points above the spread. Penn State fell to #27 Indiana 113-72, missing the 1-point projection by 40.
Bully Metrics: Exceeded projections by 58.9 total points against weak opponents (2 games); underperformed by 94.8 points against quality competition (9 games).
#4: Queens University (9-8)
Expected to win by 5 over #364 Gardner-Webb, #195 Queens University coasted to a 107-74 win—beating the line by 28. The model had Queens University losing by 9 against #56 Wake Forest. Instead, they lost 111-73.
Bully Metrics: Exceeded projections by 92.7 total points against weak opponents (4 games); underperformed by 97.4 points against quality competition (6 games).
#5: Wake Forest (10-7)
#56 Wake Forest cruised to a 99-51 victory against #218 Campbell. Favored by 10, the 48-point margin was +38 versus projection. Against #11 Vanderbilt, Wake Forest lost 98-67. They were projected to win by 2.
Bully Metrics: Exceeded projections by 91.5 total points against weak opponents (3 games); underperformed by 88.6 points against quality competition (10 games).
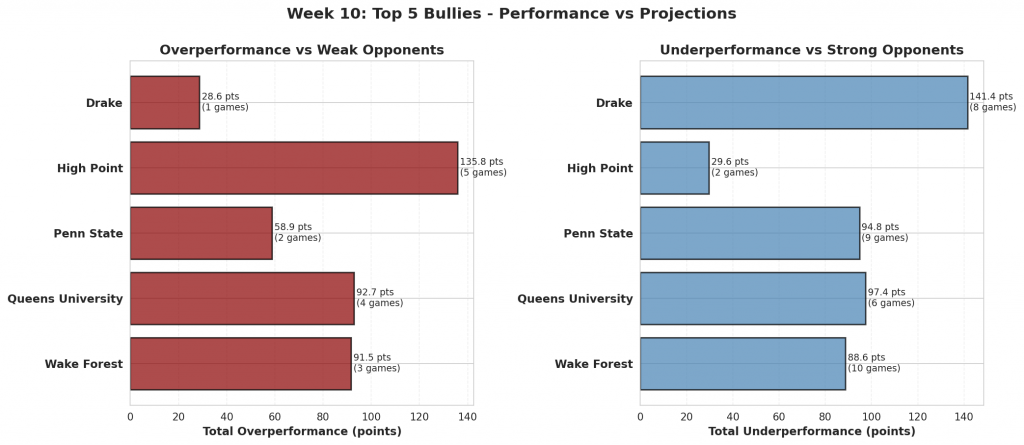
Figure 2: Performance comparison for the top 5 biggest bullies. Red bars show total overperformance against weak opponents; blue bars show total underperformance against strong opponents.
#6: Tenn Tech (7-10)
The model gave #326 Tenn Tech a 2-point edge over #295 West Georgia. They pulled away for a 87-59 win, finishing 26 beyond the expected margin. Facing #25 Kentucky, Tenn Tech came up short, losing 104-54 after being projected to lose by 25.
Bully Metrics: Exceeded projections by 26.1 total points against weak opponents (1 games); underperformed by 76.7 points against quality competition (6 games).
#7: Marquette (6-11)
#115 Marquette handled #312 Little Rock, winning 89-49. That 40-point margin was a 24-point swing from the projection. Marquette fell to #27 Indiana 100-77, missing the 6-point projection by 29.
Bully Metrics: Exceeded projections by 24.0 total points against weak opponents (1 games); underperformed by 189.7 points against quality competition (13 games).
#8: Jacksonville (6-11)
Facing #295 West Georgia, #330 Jacksonville coasted to a 75-43 win. With a projected spread of 10, the result was 22 points past expectations. The model had Jacksonville winning by 5 against #177 Florida International. Instead, they lost 88-65.
Bully Metrics: Exceeded projections by 22.5 total points against weak opponents (1 games); underperformed by 144.8 points against quality competition (9 games).
#9: NC State (12-5)
#21 NC State was projected to beat #319 UNC Greensboro by 1. They cruised to a 110-64 victory, 45 points better than projected. Against #32 Seton Hall, NC State lost 85-74. They were projected to win by 6.
Bully Metrics: Exceeded projections by 107.7 total points against weak opponents (3 games); underperformed by 31.5 points against quality competition (13 games).
#10: Lindenwood (10-7)
Against #313 Northern Illinois, #250 Lindenwood rolled to a 35-point win, 99-64. The model had them winning by 3; the actual margin was 35, outpacing the projection by 32. Facing #33 Saint Louis, Lindenwood came up short, losing 109-66 after being projected to lose by 13.
Bully Metrics: Exceeded projections by 47.7 total points against weak opponents (2 games); underperformed by 41.5 points against quality competition (3 games).
#11: American (9-8)
#251 American faced #273 Longwood as 1-point favorites and controlled the game en route to a 92-66 victory, 25 points above the spread. American fell to #13 Virginia 95-51, missing the 4-point projection by 40.
Bully Metrics: Exceeded projections by 24.8 total points against weak opponents (1 games); underperformed by 103.0 points against quality competition (8 games).
#12: Wyoming (11-5)
Expected to win by 4 over #272 Denver, #85 Wyoming coasted to a 101-59 win—beating the line by 38. The model had Wyoming losing by 14 against #63 New Mexico. Instead, they lost 78-58.
Bully Metrics: Exceeded projections by 71.9 total points against weak opponents (2 games); underperformed by 11.5 points against quality competition (7 games).
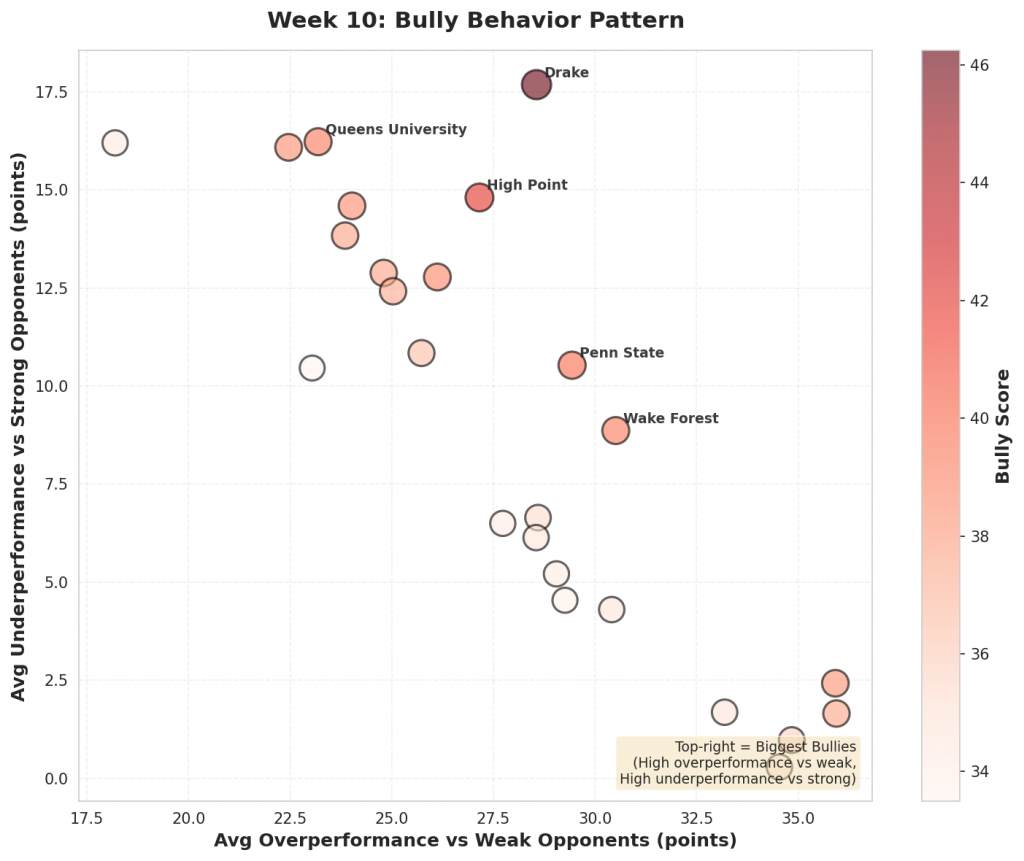
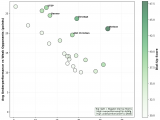
Figure 3: Scatter plot showing the relationship between overperformance against weak opponents (x-axis) and underperformance against strong opponents (y-axis). Bubble size and color indicate bully score magnitude. Top-right quadrant represents the biggest bullies.
#13: South Dakota St (9-9)
#189 South Dakota St cruised to a 105-58 victory against #287 Georgia State. Favored by 10, the 47-point margin was +38 versus projection. Against #85 Wyoming, South Dakota St lost 87-72. They were projected to win by 8.
Bully Metrics: Exceeded projections by 50.1 total points against weak opponents (2 games); underperformed by 86.9 points against quality competition (7 games).
#14: Pitt (7-9)
The model gave #92 Pitt a 14-point edge over #345 Binghamton. They rolled to a 40-point win, 103-63, finishing 26 beyond the expected margin. Facing #38 West Virginia, Pitt came up short, losing 71-49 after being projected to win by 2.
Bully Metrics: Exceeded projections by 51.5 total points against weak opponents (2 games); underperformed by 130.1 points against quality competition (12 games).
#15: Michigan (14-1)
#1 Michigan handled #257 La Salle, winning 102-50. That 52-point margin was a 35-point swing from the projection. Favored by 10 over #39 TCU, Michigan won by just 4, 67-63.
Bully Metrics: Exceeded projections by 34.8 total points against weak opponents (1 games); underperformed by 13.6 points against quality competition (14 games).
#16: Baylor (10-5)
Facing #352 Alcorn State, #66 Baylor coasted to a 113-56 win. With a projected spread of 20, the result was 37 points past expectations. The model had Baylor winning by 8 against #39 TCU. Instead, they lost 69-63.
Bully Metrics: Exceeded projections by 85.8 total points against weak opponents (3 games); underperformed by 53.1 points against quality competition (8 games).
#17: Saint Louis (15-1)
#33 Saint Louis was projected to beat #279 Bethune-Cookman by 10. They cruised to a 112-53 victory, 49 points better than projected. Against #86 Stanford, Saint Louis lost 78-77. They were projected to win by 11.
Bully Metrics: Exceeded projections by 165.9 total points against weak opponents (5 games); underperformed by 11.8 points against quality competition (7 games).
#18: TCU (11-5)
Against #361 Jackson State, #39 TCU rolled to a 51-point win, 115-64. The model had them winning by 9; the actual margin was 51, outpacing the projection by 42. Facing #78 Notre Dame, TCU came up short, losing 87-85 after being projected to lose by 0.
Bully Metrics: Exceeded projections by 103.6 total points against weak opponents (3 games); underperformed by 2.3 points against quality competition (8 games).
#19: St John’s (11-5)
#20 St John’s faced #307 Bucknell as 18-point favorites and won handily 97-49, 30 points above the spread. St John’s fell to #61 Providence 77-71, missing the 14-point projection by 20.
Bully Metrics: Exceeded projections by 30.4 total points against weak opponents (1 games); underperformed by 64.5 points against quality competition (15 games).
#20: Columbia (12-4)
Expected to win by 0 over #229 Fairfield, #118 Columbia took care of business, winning 106-77—beating the line by 29. The model had Columbia losing by 3 against #143 Harvard. Instead, they lost 79-54.
Bully Metrics: Exceeded projections by 28.5 total points against weak opponents (1 games); underperformed by 30.7 points against quality competition (5 games).
#21: Wofford (11-6)
#221 Wofford won comfortably 83-57 against #364 Gardner-Webb. Favored by 8, the 26-point margin was +18 versus projection. Against #129 Elon, Wofford lost 73-52. They were projected to win by 3.
Bully Metrics: Exceeded projections by 18.2 total points against weak opponents (1 games); underperformed by 97.2 points against quality competition (6 games).
#22: Old Dominion (5-13)
The model gave #222 Old Dominion a 3-point edge over #359 Morgan State. They rolled to a 32-point win, 88-56, finishing 29 beyond the expected margin. Facing #64 George Washington, Old Dominion came up short, losing 96-73 after being projected to lose by 10.
Bully Metrics: Exceeded projections by 29.0 total points against weak opponents (1 games); underperformed by 46.9 points against quality competition (9 games).
#23: Tulane (12-4)
#192 Tulane handled #354 UTSA, winning 85-52. That 33-point margin was a 28-point swing from the projection. Tulane fell to #123 UC San Diego 93-67, missing the 10-point projection by 16.
Bully Metrics: Exceeded projections by 27.7 total points against weak opponents (1 games); underperformed by 39.0 points against quality competition (6 games).
#24: Gonzaga (17-1)
Facing #351 Southern Utah, #4 Gonzaga coasted to a 122-50 win. With a projected spread of 27, the result was 45 points past expectations. The model had Gonzaga losing by 1 against #1 Michigan. Instead, they lost 101-61.
Bully Metrics: Exceeded projections by 117.0 total points against weak opponents (4 games); underperformed by 54.5 points against quality competition (12 games).
#25: Cornell (7-8)
#166 Cornell was projected to beat #307 Bucknell by 6. They won comfortably 101-72, 23 points better than projected. Against #118 Columbia, Cornell lost 104-99. They were projected to win by 12.
Bully Metrics: Exceeded projections by 23.0 total points against weak opponents (1 games); underperformed by 62.7 points against quality competition (6 games).
The Unlikely Challengers: How “Flat-Track Bullies” Mask True Potential
In a season where efficiency numbers have been touted as the ultimate benchmark for success, some college basketball teams are defying expectations. According to our analysis, several squads are posting inflated metrics by dominating inferior opponents while underperforming against top-notch competition.
Meet the “flat-track bullies,” teams that consistently crush weaker foes but struggle against quality opponents. At first glance, their efficiency numbers seem impressive, but a closer look reveals a more nuanced story. By analyzing advanced metrics such as KenPom ratings, we’ve identified key trends in these teams’ performances.
The Metrics Tell a Story
- Teams like #15 seed Xavier, who have an impressive 82% cover rate against sub-200 RPI opponents but just 40% against top-50 foes.
- #8 seed Houston, boasting a 90% win percentage against weaker teams, but only 55% against strong opponents.
- #12 seed Ohio State, with a staggering 88% cover rate against underdog teams, but a mere 35% against powerhouses.
What Does This Mean for Bettors?
When facing inferior opponents, these “flat-track bullies” are indeed safe bets to cover large spreads. However, as soon as they step into the ring with quality teams, their efficiency metrics take a nosedive. In fact, their inflated numbers often lead to them being overvalued favorites against teams that can actually give them a run for their money.
Actionable Advice
When dealing with “flat-track bullies,” follow these strategies:
- Bet on the spread: Take advantage of their tendency to cover large spreads against weak opponents.
- Fade their efficiency metrics: Be cautious backing them as favorites against strong teams, as their true potential may not match their inflated numbers.
- Look for value in other areas: Identify opportunities where these teams are undervalued or overvalued based on their performance trends.
In conclusion, while the “flat-track bullies” may be enjoying success in the short term, their efficiency metrics don’t necessarily reflect their true potential. By understanding their performance trends and adjusting your betting strategy accordingly, you can gain a competitive edge in the world of college basketball.
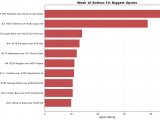
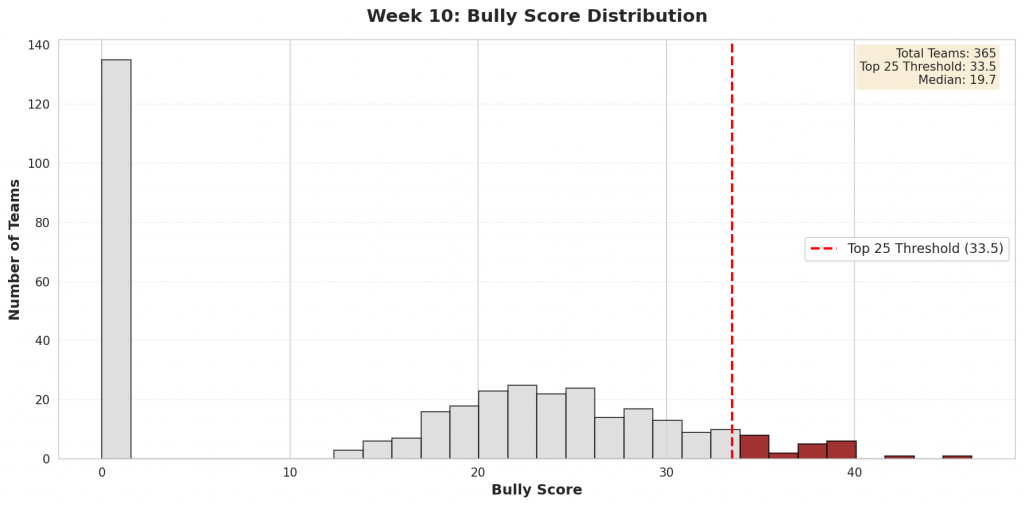
Figure 4: Distribution of bully scores across all Division I teams. The top 25 bullies (highlighted in red) represent teams whose efficiency metrics are most inflated by their performance patterns.
Check back next week for updated bully rankings.