Big South Update: Week 10
January 12, 2026The Big South enters Week 10 with teams showing diverse trending patterns. This analysis examines each team’s performance trends using MACD (Moving Average Convergence Divergence) indicators to identify not just where teams stand, but where they’re headed.
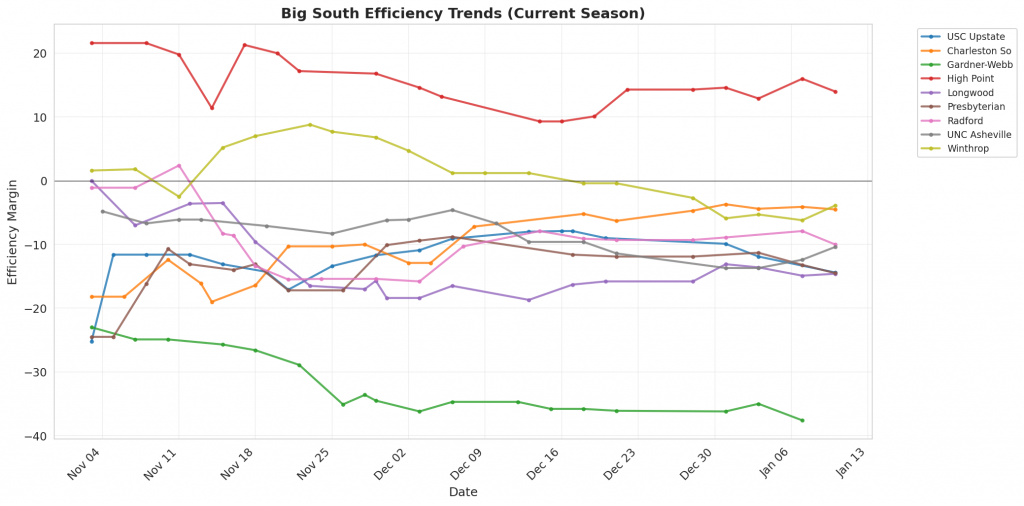
Figure 1: Efficiency margin trends for Big South teams throughout the season. Teams trending upward show improving performance, while downward trends indicate struggles.
Conference Snapshot
- Week Dates: January 05 – January 11, 2026
- Trending Up (Efficiency): Charleston So, High Point, Longwood, Presbyterian, Radford
- Trending Down (Efficiency): USC Upstate, Gardner-Webb, UNC Asheville, Winthrop
Team-by-Team Analysis
Charleston So
Record: 11-8 | Elo: 1427.3 (ranked 277 of 365) | Efficiency Margin: -4.45 (ranked 203 of 365)
Offensive Trends:
- Turnovers (Turnovers): Currently ranked 179 of 365 in D1. Trending down strongly 🟢.
- Adj Off Eff (Adjusted Offensive Efficiency): Currently ranked 229 of 365 in D1. Trending up strongly 🟢.
Defensive Trends:
- Opp Shooting (Opp Shooting): Currently ranked 22 of 365 in D1. Trending down strongly 🟢.
- Def Reb Pct (Defensive Rebounding): Currently ranked 99 of 365 in D1. Trending down strongly 🔴.
Gardner-Webb
Record: 2-16 | Elo: 1356.6 (ranked 345 of 365) | Efficiency Margin: -37.62 (ranked 364 of 365)
Offensive Trends:
- Off Reb Pct (Offensive Rebounding): Currently ranked 354 of 365 in D1. Trending down strongly 🔴.
- FT Rate (FTA/FGA (%)): Currently ranked 259 of 365 in D1. Trending down strongly 🔴.
Defensive Trends:
- Def Reb Pct (Defensive Rebounding): Currently ranked 347 of 365 in D1. Trending down strongly 🔴.
- Opp FGM Per Poss (Opp FG Makes Per Possession (%)): Currently ranked 364 of 365 in D1. Trending up strongly 🔴.
High Point
Record: 16-3 | Elo: 1640.8 (ranked 41 of 365) | Efficiency Margin: +14.02 (ranked 61 of 365)
Offensive Trends:
- FT Rate (FTA/FGA (%)): Currently ranked 35 of 365 in D1. Trending up strongly 🟢.
- FTA Per Poss (Free Throw Attempts Per Possession (%)): Currently ranked 13 of 365 in D1. Trending up strongly 🟢.
Defensive Trends:
- Def Reb Pct (Defensive Rebounding): Currently ranked 161 of 365 in D1. Trending up strongly 🟢.
- Opp FT Rate (Opp FTA/FGA (%)): Currently ranked 162 of 365 in D1. Trending down strongly 🟢.
Longwood
Record: 10-9 | Elo: 1474.2 (ranked 229 of 365) | Efficiency Margin: -14.56 (ranked 280 of 365)
Offensive Trends:
- Off Reb Pct (Offensive Rebounding): Currently ranked 76 of 365 in D1. Trending up strongly 🟢.
- FT Rate (FTA/FGA (%)): Currently ranked 29 of 365 in D1. Trending down strongly 🔴.
Defensive Trends:
- Opp Turnovers (Opp Turnovers): Currently ranked 93 of 365 in D1. Trending down strongly 🟢.
- Opp 2PA Per Poss (Opp 2 Point Attempts Per Possession (%)): Currently ranked 47 of 365 in D1. Trending up strongly 🔴.
Presbyterian
Record: 8-10 | Elo: 1402.0 (ranked 303 of 365) | Efficiency Margin: -14.46 (ranked 278 of 365)
Offensive Trends:
- Fouls Per Poss (Fouls Per Possession): Currently ranked 212 of 365 in D1. Trending down strongly 🟢.
- Shooting (Shooting): Currently ranked 281 of 365 in D1. Trending up moderately 🟢.
Defensive Trends:
- Opp Shooting (Opp Shooting): Currently ranked 234 of 365 in D1. Trending up strongly 🔴.
- Opp FT Rate (Opp FTA/FGA (%)): Currently ranked 227 of 365 in D1. Trending down strongly 🟢.
Radford
Record: 9-9 | Elo: 1471.2 (ranked 231 of 365) | Efficiency Margin: -9.96 (ranked 247 of 365)
Offensive Trends:
- Turnovers (Turnovers): Currently ranked 130 of 365 in D1. Trending down strongly 🟢.
- 2Pt Rate (2 Point Attempts/FGA (%)): Currently ranked 333 of 365 in D1. Trending down strongly 🔴.
Defensive Trends:
- Opp Off Tempo (Opp Offensive Possessions Per Game): Currently ranked 27 of 365 in D1. Trending up strongly 🔴.
- Def Reb Pct (Defensive Rebounding): Currently ranked 212 of 365 in D1. Trending up moderately 🟢.
UNC Asheville
Record: 7-10 | Elo: 1501.9 (ranked 184 of 365) | Efficiency Margin: -10.39 (ranked 250 of 365)
Offensive Trends:
- FTA Per Poss (Free Throw Attempts Per Possession (%)): Currently ranked 99 of 365 in D1. Trending up strongly 🟢.
- FT Pct (FTM/FTA (%)): Currently ranked 273 of 365 in D1. Trending down strongly 🔴.
Defensive Trends:
- Opp Turnovers (Opp Turnovers): Currently ranked 327 of 365 in D1. Trending down strongly 🟢.
- Def Reb Pct (Defensive Rebounding): Currently ranked 237 of 365 in D1. Trending up strongly 🟢.
USC Upstate
Record: 8-10 | Elo: 1351.8 (ranked 347 of 365) | Efficiency Margin: -14.39 (ranked 277 of 365)
Offensive Trends:
- Shooting (Shooting): Currently ranked 270 of 365 in D1. Trending down strongly 🔴.
- 2Pt Rate (2 Point Attempts/FGA (%)): Currently ranked 124 of 365 in D1. Trending up strongly 🟢.
Defensive Trends:
- Opp FT Rate (Opp FTA/FGA (%)): Currently ranked 294 of 365 in D1. Trending up strongly 🔴.
- Opp 2Pt Pct (Opp 2 Point FGM/FGA (%)): Currently ranked 77 of 365 in D1. Trending down strongly 🟢.
Winthrop
Record: 11-8 | Elo: 1530.5 (ranked 139 of 365) | Efficiency Margin: -3.88 (ranked 196 of 365)
Offensive Trends:
- Shooting (Shooting): Currently ranked 233 of 365 in D1. Trending down strongly 🔴.
- Off Reb Pct (Offensive Rebounding): Currently ranked 54 of 365 in D1. Trending up strongly 🟢.
Defensive Trends:
- Opp Off Tempo (Opp Offensive Possessions Per Game): Currently ranked 99 of 365 in D1. Trending down strongly 🟢.
- Opp Shooting (Opp Shooting): Currently ranked 254 of 365 in D1. Trending down moderately 🟢.

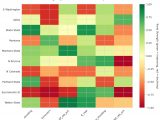
Figure 2: Offensive Four Factors comparison across Big South teams. The radar chart shows each team’s shooting efficiency (eFG%), ball security (TOV%), offensive rebounding (OREB%), and free throw generation (FT Rate).
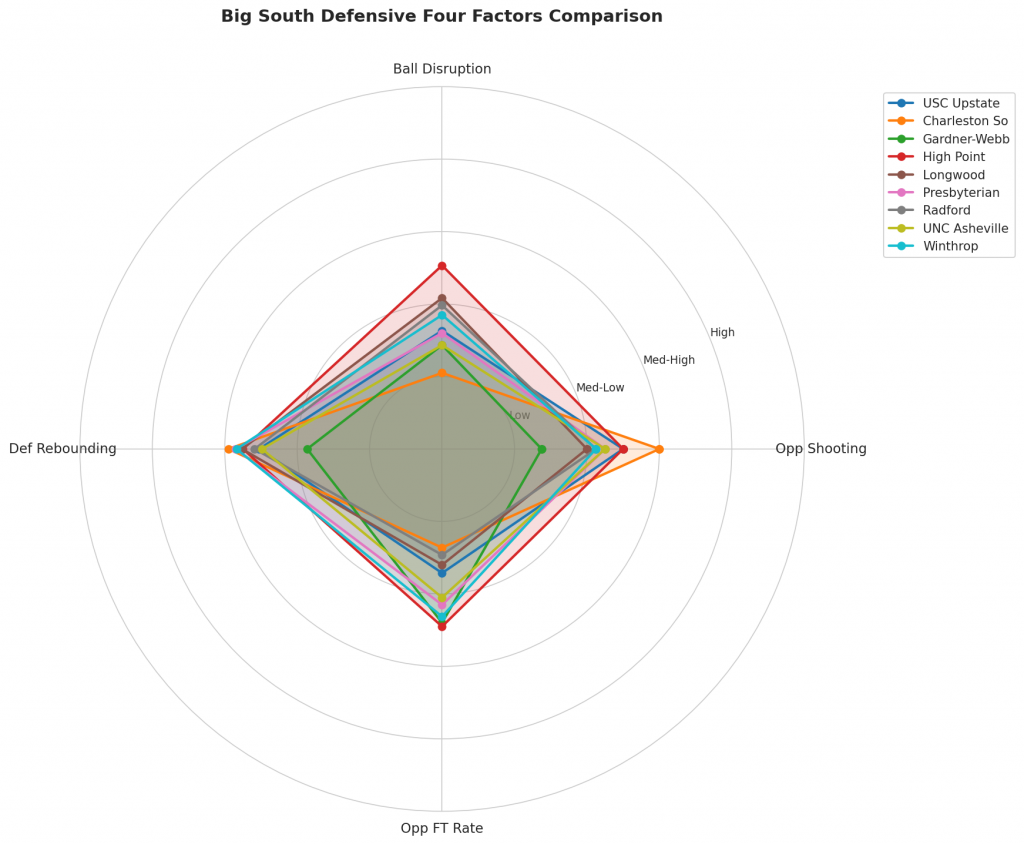
Figure 3: Defensive Four Factors comparison across Big South teams. The radar chart shows each team’s opponent shooting defense (Opp eFG%), ball disruption (forcing TOV%), defensive rebounding (DREB%), and opponent free throw prevention (Opp FT Rate).
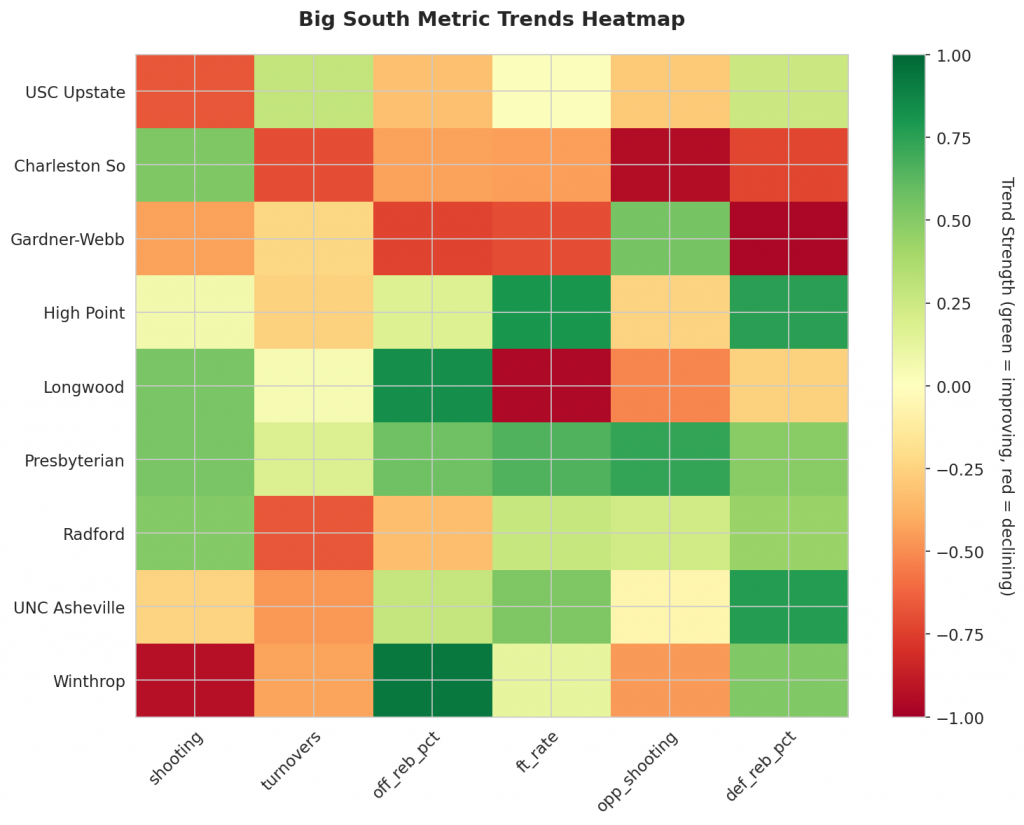
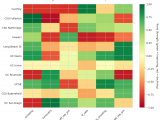
Figure 4: MACD trends heatmap showing which metrics are improving (green) or declining (red) for each team. Stronger colors indicate more pronounced trends.
Looking Ahead
As Big South teams continue their season, the MACD trending indicators will help identify which teams are genuinely improving versus those riding unsustainable momentum. Check back next week for updated analysis.
Metrics Glossary
Four Factors (Dean Oliver’s framework for basketball success):
- eFG% (Effective Field Goal %): Field goal percentage adjusted for 3-pointers being worth more (FGM + 0.5×3PM) / FGA. Higher is better offensively, lower is better defensively.
- TOV% (Turnover Rate): Turnovers per 100 possessions. Lower is better offensively (taking care of the ball), higher is better defensively (forcing turnovers).
- OREB% / DREB% (Offensive/Defensive Rebound Rate): Percentage of available rebounds grabbed. Offensive rebounds create second-chance points; defensive rebounds end opponent possessions.
- FTR (Free Throw Rate): Free throws made per field goal attempt (FTM/FGA). Measures ability to get to the line AND convert. Higher is better offensively, lower is better defensively.
Other Metrics:
- Elo Rating: Chess-style rating system that updates based on game results and opponent strength. Higher Elo indicates stronger team.
- Efficiency Margin: Point differential per 100 possessions (Offensive Efficiency – Defensive Efficiency). Accounts for pace of play.
- MACD (Moving Average Convergence Divergence): Trend indicator comparing 12-game and 26-game exponential moving averages. Positive MACD = improving trend, Negative MACD = declining trend.
Analysis powered by HoopSci’s advanced metrics and MACD trending indicators.