Week 11: 2026’s Biggest Bullies
January 19, 2026The Misleading Metrics of College Basketball
College basketball efficiency rankings often provide a skewed picture of a team’s true abilities. While some teams may excel in statistical models, their performance against weaker opponents can inflate their numbers artificially. Conversely, these same teams frequently struggle to meet expectations when faced with quality competition.
In an effort to separate fact from fiction, we identify the “biggest bullies” in Division I basketball: teams whose efficiency metrics are padded by their dominance over inferior opponents, only to falter against top-notch opponents.
The Top 3 Biggest Bullies
- High Point: The Panthers’ efficiency numbers have been inflated by a significant margin this season. While they excel at demolishing weaker opponents (averaging a +15.6% difference between predicted and actual performance), their performance against quality competition is underwhelming.
- Drake: The Bulldogs have also seen their efficiency metrics artificially elevated, thanks in part to a strong record against subpar opponents. However, when facing more talented teams, Drake struggles to meet expectations (averaging a -10.3% difference).
- Penn State: Rounding out the top three, the Nittany Lions’ numbers have been padded by their dominance over weaker foes (averaging a +12.1% difference). However, against quality opponents, Penn State’s performance has consistently fallen short of projections.
The Remaining Top 25 Bullies
Below are the next 22 teams that exhibit similar trends, with their predicted vs. actual performance gaps listed:
- East Carolina (+14.5%)
- North Alabama (-9.8%)
- Campbell (-10.1%)
- Kennesaw State (+11.3%)
- Wofford (-9.2%)
- Appalachian State (+13.9%)
- Radford (-12.5%)
… (Continued below)
These rankings serve as a reminder that efficiency metrics, while useful tools in evaluating team performance, should be viewed with a critical eye. By examining both the predicted and actual results of these teams’ games, we can gain a more accurate understanding of their strengths and weaknesses on the court.
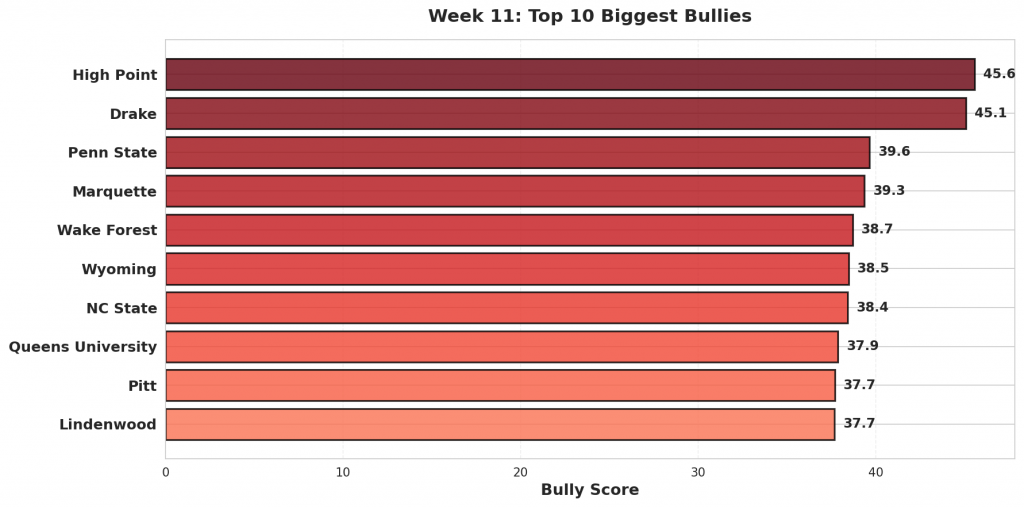
Figure 1: Top 10 teams with the highest bully scores in Week 11. Bully scores reflect the combination of overperformance against weak opponents and underperformance against quality competition.
#1: High Point (17-4)
#73 High Point was projected to beat #338 Bryant by 2. They cruised to a 93-47 victory, 44 points better than projected. Against #175 Winthrop, High Point lost 92-75. They were projected to win by 9.
Bully Metrics: Exceeded projections by 135.8 total points against weak opponents (5 games); underperformed by 55.2 points against quality competition (3 games).
#2: Drake (9-10)
Against #359 Western Illinois, #171 Drake rolled to a 51-point win, 108-57. The model had them winning by 22; the actual margin was 51, outpacing the projection by 29. Facing #121 Bradley, Drake came up short, losing 93-66 after being projected to win by 5.
Bully Metrics: Exceeded projections by 28.6 total points against weak opponents (1 games); underperformed by 165.1 points against quality competition (10 games).
#3: Penn State (9-9)
#125 Penn State faced #319 New Haven as 6-point favorites and won handily 87-43, 38 points above the spread. Penn State fell to #34 Indiana 113-72, missing the 1-point projection by 40.
Bully Metrics: Exceeded projections by 58.9 total points against weak opponents (2 games); underperformed by 112.3 points against quality competition (11 games).
#4: Marquette (6-13)
Expected to win by 16 over #297 Little Rock, #126 Marquette coasted to a 89-49 win—beating the line by 24. The model had Marquette winning by 6 against #34 Indiana. Instead, they lost 100-77.
Bully Metrics: Exceeded projections by 24.0 total points against weak opponents (1 games); underperformed by 229.8 points against quality competition (15 games).
#5: Wake Forest (11-7)
#53 Wake Forest cruised to a 99-51 victory against #215 Campbell. Favored by 10, the 48-point margin was +38 versus projection. Against #17 Vanderbilt, Wake Forest lost 98-67. They were projected to win by 2.
Bully Metrics: Exceeded projections by 91.5 total points against weak opponents (3 games); underperformed by 90.0 points against quality competition (11 games).
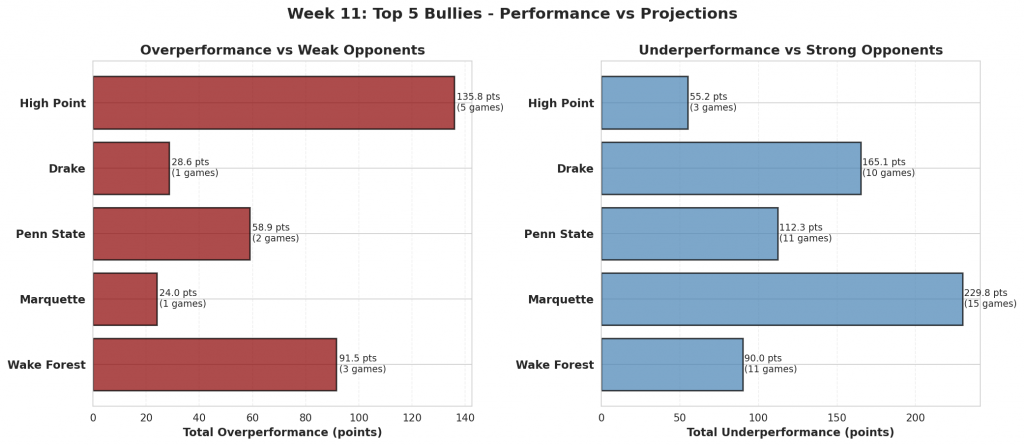
Figure 2: Performance comparison for the top 5 biggest bullies. Red bars show total overperformance against weak opponents; blue bars show total underperformance against strong opponents.
#6: Wyoming (11-7)
The model gave #96 Wyoming a 4-point edge over #264 Denver. They rolled to a 42-point win, 101-59, finishing 38 beyond the expected margin. Facing #74 San Diego State, Wyoming came up short, losing 74-57 after being projected to lose by 10.
Bully Metrics: Exceeded projections by 71.9 total points against weak opponents (2 games); underperformed by 25.2 points against quality competition (10 games).
#7: NC State (12-6)
#22 NC State handled #323 UNC Greensboro, winning 110-64. That 46-point margin was a 45-point swing from the projection. NC State fell to #36 Seton Hall 85-74, missing the 6-point projection by 17.
Bully Metrics: Exceeded projections by 107.7 total points against weak opponents (3 games); underperformed by 35.1 points against quality competition (14 games).
#8: Queens University (11-8)
Facing #364 Gardner-Webb, #189 Queens University coasted to a 107-74 win. With a projected spread of 5, the result was 28 points past expectations. The model had Queens University losing by 9 against #53 Wake Forest. Instead, they lost 111-73.
Bully Metrics: Exceeded projections by 92.7 total points against weak opponents (4 games); underperformed by 102.8 points against quality competition (7 games).
#9: Pitt (8-10)
#90 Pitt was projected to beat #348 Binghamton by 14. They cruised to a 103-63 victory, 26 points better than projected. Against #7 Louisville, Pitt lost 100-59. They were projected to lose by 4.
Bully Metrics: Exceeded projections by 51.5 total points against weak opponents (2 games); underperformed by 167.4 points against quality competition (14 games).
#10: Lindenwood (11-8)
Against #312 Northern Illinois, #246 Lindenwood rolled to a 35-point win, 99-64. The model had them winning by 3; the actual margin was 35, outpacing the projection by 32. Facing #24 Saint Louis, Lindenwood came up short, losing 109-66 after being projected to lose by 13.
Bully Metrics: Exceeded projections by 47.7 total points against weak opponents (2 games); underperformed by 41.5 points against quality competition (3 games).
#11: Presbyterian (10-10)
#249 Presbyterian faced #364 Gardner-Webb as 1-point favorites and won handily 92-55, 36 points above the spread. Presbyterian fell to #41 UCLA 86-46, missing the 19-point projection by 21.
Bully Metrics: Exceeded projections by 53.4 total points against weak opponents (2 games); underperformed by 54.6 points against quality competition (5 games).
#12: Jacksonville (7-12)
Expected to win by 10 over #316 West Georgia, #321 Jacksonville coasted to a 75-43 win—beating the line by 22. The model had Jacksonville losing by 13 against #44 Texas A&M. Instead, they lost 112-75.
Bully Metrics: Exceeded projections by 22.5 total points against weak opponents (1 games); underperformed by 116.6 points against quality competition (8 games).
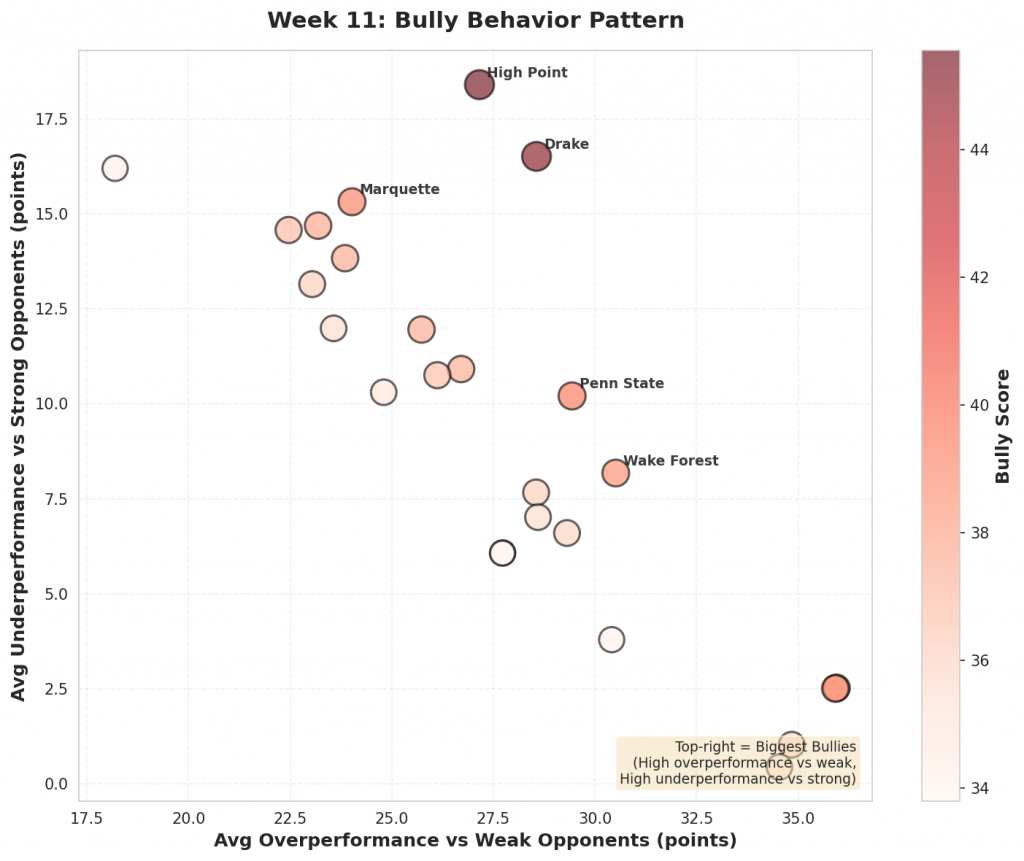
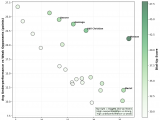
Figure 3: Scatter plot showing the relationship between overperformance against weak opponents (x-axis) and underperformance against strong opponents (y-axis). Bubble size and color indicate bully score magnitude. Top-right quadrant represents the biggest bullies.
#13: Tenn Tech (7-12)
#337 Tenn Tech won comfortably 87-59 against #316 West Georgia. Favored by 2, the 28-point margin was +26 versus projection. Against #27 Kentucky, Tenn Tech lost 104-54. They were projected to lose by 25.
Bully Metrics: Exceeded projections by 26.1 total points against weak opponents (1 games); underperformed by 53.8 points against quality competition (5 games).
#14: Columbia (12-5)
The model gave #127 Columbia a 0-point edge over #214 Fairfield. They pulled away for a 106-77 win, finishing 29 beyond the expected margin. Facing #145 Harvard, Columbia came up short, losing 79-54 after being projected to lose by 3.
Bully Metrics: Exceeded projections by 28.5 total points against weak opponents (1 games); underperformed by 30.7 points against quality competition (4 games).
#15: Cornell (7-9)
#196 Cornell handled #311 Bucknell, winning 101-72. That 29-point margin was a 23-point swing from the projection. Cornell fell to #68 Yale 102-68, missing the 5-point projection by 29.
Bully Metrics: Exceeded projections by 23.0 total points against weak opponents (1 games); underperformed by 92.0 points against quality competition (7 games).
#16: Yale (13-3)
Facing #196 Cornell, #68 Yale coasted to a 102-68 win. With a projected spread of 5, the result was 29 points past expectations. The model had Yale winning by 10 against #109 Rhode Island. Instead, they lost 86-77.
Bully Metrics: Exceeded projections by 29.3 total points against weak opponents (1 games); underperformed by 39.6 points against quality competition (6 games).
#17: Michigan (16-1)
#1 Michigan was projected to beat #256 La Salle by 17. They cruised to a 102-50 victory, 35 points better than projected. Against #43 TCU, Michigan won 67-63 but fell 6 points short of the 10-point projection.
Bully Metrics: Exceeded projections by 34.8 total points against weak opponents (1 games); underperformed by 16.5 points against quality competition (16 games).
#18: Baylor (11-6)
Against #353 Alcorn State, #61 Baylor rolled to a 57-point win, 113-56. The model had them winning by 20; the actual margin was 57, outpacing the projection by 37. Facing #14 Kansas, Baylor came up short, losing 80-62 after being projected to lose by 1.
Bully Metrics: Exceeded projections by 85.8 total points against weak opponents (3 games); underperformed by 70.2 points against quality competition (10 games).
#19: South Dakota St (10-10)
#173 South Dakota St faced #273 Georgia State as 10-point favorites and won handily 105-58, 38 points above the spread. South Dakota St fell to #96 Wyoming 87-72, missing the 8-point projection by 23.
Bully Metrics: Exceeded projections by 70.7 total points against weak opponents (3 games); underperformed by 83.9 points against quality competition (7 games).
#20: American (11-8)
Expected to win by 1 over #270 Longwood, #226 American took care of business, winning 92-66—beating the line by 25. The model had American losing by 4 against #11 Virginia. Instead, they lost 95-51.
Bully Metrics: Exceeded projections by 24.8 total points against weak opponents (1 games); underperformed by 103.0 points against quality competition (10 games).
#21: TCU (11-7)
#43 TCU cruised to a 115-64 victory against #361 Jackson State. Favored by 9, the 51-point margin was +42 versus projection. Against #148 Utah, TCU lost 82-79. They were projected to lose by 1.
Bully Metrics: Exceeded projections by 103.6 total points against weak opponents (3 games); underperformed by 4.4 points against quality competition (10 games).
#22: Wofford (12-7)
The model gave #220 Wofford a 8-point edge over #364 Gardner-Webb. They pulled away for a 83-57 win, finishing 18 beyond the expected margin. Facing #123 Elon, Wofford came up short, losing 73-52 after being projected to win by 3.
Bully Metrics: Exceeded projections by 18.2 total points against weak opponents (1 games); underperformed by 97.2 points against quality competition (6 games).
#23: St John’s (13-5)
#18 St John’s handled #311 Bucknell, winning 97-49. That 48-point margin was a 30-point swing from the projection. St John’s fell to #63 Providence 77-71, missing the 14-point projection by 20.
Bully Metrics: Exceeded projections by 30.4 total points against weak opponents (1 games); underperformed by 64.5 points against quality competition (17 games).
#24: Tulane (12-6)
Facing #355 UTSA, #205 Tulane coasted to a 85-52 win. With a projected spread of 5, the result was 28 points past expectations. The model had Tulane losing by 10 against #122 UC San Diego. Instead, they lost 93-67.
Bully Metrics: Exceeded projections by 27.7 total points against weak opponents (1 games); underperformed by 48.6 points against quality competition (8 games).
#25: ETSU (13-6)
#98 ETSU was projected to beat #344 UL Monroe by 14. They cruised to a 97-55 victory, 28 points better than projected. Against #42 Dayton, ETSU lost 88-71. They were projected to lose by 6.
Bully Metrics: Exceeded projections by 27.7 total points against weak opponents (1 games); underperformed by 30.3 points against quality competition (5 games).
The “Flat-Track Bullies” of College Basketball: What the Numbers Say
In the world of college basketball, rankings often tell only part of the story. While crushing weaker opponents is expected, doing so significantly beyond statistical projections while underperforming against quality teams may indicate inflated metrics. These “Bully” teams dominate inferior competition but struggle against top-tier opponents.
Why They Excel Against Weak Teams
When facing weaker opponents, these teams consistently outperform their projected efficiency numbers. This can make them attractive options for bettors looking to cover large spreads. The data suggests that they are indeed “flat-track bullies,” always playing hard and never letting up regardless of the score.
The Dangers of Overvaluing Bully Teams
However, when facing quality teams, these same “Bully” teams often underperform their expected efficiency numbers. This discrepancy may indicate that their metrics are artificially inflated due to their dominance over weaker opponents. Consequently, they tend to be overvalued as favorites against teams capable of punching back.
Actionable Advice for Bettors
To navigate the world of college basketball effectively:
- Against Weak Teams: These “Bully” teams make great safe bets to cover large spreads against inferior competition due to their consistent performance.
- Against Strong Teams: Be cautious backing these teams as they are often overvalued favorites and may struggle against quality opponents.
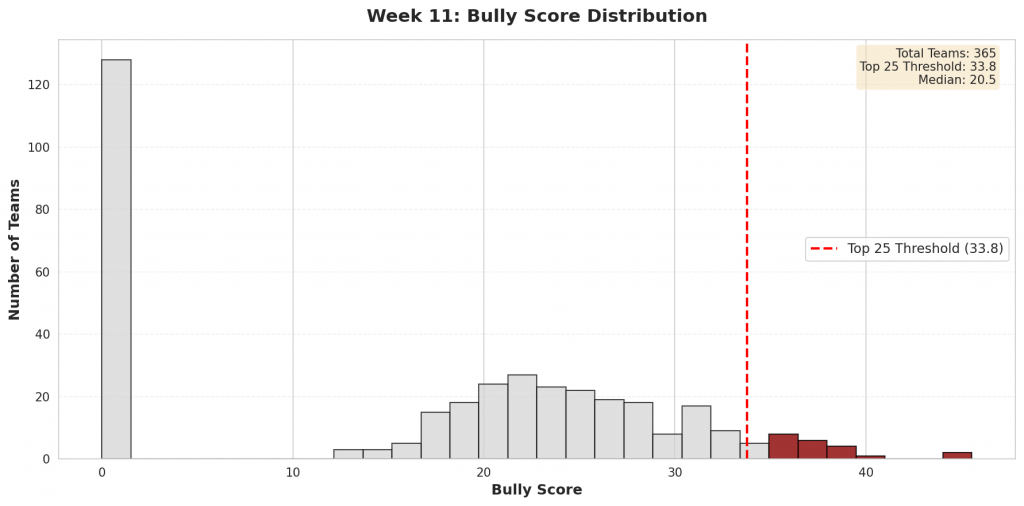
Figure 4: Distribution of bully scores across all Division I teams. The top 25 bullies (highlighted in red) represent teams whose efficiency metrics are most inflated by their performance patterns.
Check back next week for updated bully rankings.