Big South Update: Week 11
January 19, 2026The Big South enters Week 11 with teams showing diverse trending patterns. This analysis examines each team’s performance trends using MACD (Moving Average Convergence Divergence) indicators to identify not just where teams stand, but where they’re headed.
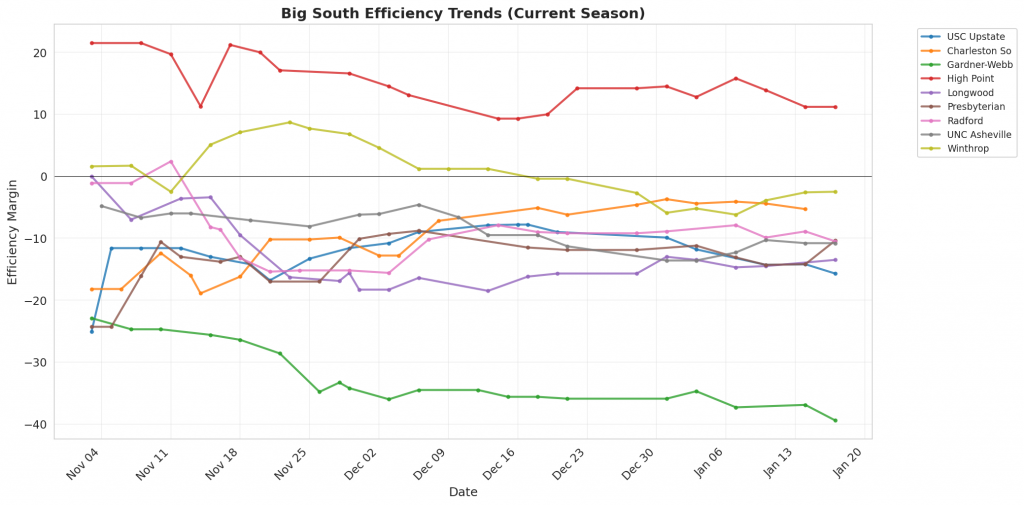
Figure 1: Efficiency margin trends for Big South teams throughout the season. Teams trending upward show improving performance, while downward trends indicate struggles.
Conference Snapshot
- Week Dates: January 12 – January 18, 2026
- Trending Up (Efficiency): Charleston So, Longwood, Presbyterian, Radford
- Trending Down (Efficiency): USC Upstate, Gardner-Webb, High Point, UNC Asheville, Winthrop
Team-by-Team Analysis
Charleston So
Record: 11-9 | Elo: 1412.7 (ranked 293 of 365) | Efficiency Margin: -5.27 (ranked 204 of 365)
Offensive Trends:
- Turnovers (Turnovers): Currently ranked 180 of 365 in D1. Trending down strongly 🟢.
- Off Reb Pct (Offensive Rebounding): Currently ranked 211 of 365 in D1. Trending down strongly 🔴.
Defensive Trends:
- Opp Shooting (Opp Shooting): Currently ranked 11 of 365 in D1. Trending down strongly 🟢.
- Opp FT Rate (Opp FTA/FGA (%)): Currently ranked 319 of 365 in D1. Trending up strongly 🔴.
Gardner-Webb
Record: 2-18 | Elo: 1336.0 (ranked 356 of 365) | Efficiency Margin: -39.44 (ranked 364 of 365)
Offensive Trends:
- Off Reb Pct (Offensive Rebounding): Currently ranked 356 of 365 in D1. Trending down strongly 🔴.
- Adj Off Eff (Adjusted Offensive Efficiency): Currently ranked 362 of 365 in D1. Trending down strongly 🔴.
Defensive Trends:
- Opp Turnovers (Opp Turnovers): Currently ranked 332 of 365 in D1. Trending down strongly 🟢.
- Def Reb Pct (Defensive Rebounding): Currently ranked 351 of 365 in D1. Trending down strongly 🔴.
High Point
Record: 17-4 | Elo: 1632.7 (ranked 46 of 365) | Efficiency Margin: +11.25 (ranked 79 of 365)
Offensive Trends:
- Blocks Per FGA (Blocks Per Shot Attempt): Currently ranked 160 of 365 in D1. Trending up strongly 🟢.
- Shooting (Shooting): Currently ranked 32 of 365 in D1. Trending down moderately 🔴.
Defensive Trends:
- Opp FT Pct (Opp FTM/FTA (%)): Currently ranked 30 of 365 in D1. Trending down strongly 🟢.
- Opp FT Rate (Opp FTA/FGA (%)): Currently ranked 179 of 365 in D1. Trending down moderately 🟢.
Longwood
Record: 10-10 | Elo: 1467.2 (ranked 233 of 365) | Efficiency Margin: -13.54 (ranked 274 of 365)
Offensive Trends:
- Shooting (Shooting): Currently ranked 261 of 365 in D1. Trending up strongly 🟢.
- Off Reb Pct (Offensive Rebounding): Currently ranked 60 of 365 in D1. Trending up strongly 🟢.
Defensive Trends:
- Opp Turnovers (Opp Turnovers): Currently ranked 100 of 365 in D1. Trending down strongly 🟢.
- Opp FTM Per Poss (Opp Free Throw Makes Per Possession (%)): Currently ranked 281 of 365 in D1. Trending up strongly 🔴.
Presbyterian
Record: 10-10 | Elo: 1423.0 (ranked 279 of 365) | Efficiency Margin: -10.44 (ranked 253 of 365)
Offensive Trends:
- Shooting (Shooting): Currently ranked 239 of 365 in D1. Trending up strongly 🟢.
- FT Rate (FTA/FGA (%)): Currently ranked 141 of 365 in D1. Trending up strongly 🟢.
Defensive Trends:
- Opp 2PM Per Poss (Opp 2 Point Makes Per Possession (%)): Currently ranked 196 of 365 in D1. Trending down strongly 🟢.
- Opp 2Pt Pct (Opp 2 Point FGM/FGA (%)): Currently ranked 98 of 365 in D1. Trending down strongly 🟢.
Radford
Record: 11-9 | Elo: 1487.8 (ranked 207 of 365) | Efficiency Margin: -10.46 (ranked 254 of 365)
Offensive Trends:
- Turnovers (Turnovers): Currently ranked 116 of 365 in D1. Trending down strongly 🟢.
- Off Reb Pct (Offensive Rebounding): Currently ranked 264 of 365 in D1. Trending down strongly 🔴.
Defensive Trends:
- Opp Shooting (Opp Shooting): Currently ranked 267 of 365 in D1. Trending up strongly 🔴.
- Opp FGM Per Poss (Opp FG Makes Per Possession (%)): Currently ranked 182 of 365 in D1. Trending up strongly 🔴.
UNC Asheville
Record: 7-12 | Elo: 1480.4 (ranked 214 of 365) | Efficiency Margin: -10.84 (ranked 256 of 365)
Offensive Trends:
- Shooting (Shooting): Currently ranked 182 of 365 in D1. Trending down strongly 🔴.
- FGM Per Poss (Field Goal Makes Per Possession (%)): Currently ranked 243 of 365 in D1. Trending down strongly 🔴.
Defensive Trends:
- Opp FT Rate (Opp FTA/FGA (%)): Currently ranked 282 of 365 in D1. Trending up strongly 🔴.
- Opp FGM Per Poss (Opp FG Makes Per Possession (%)): Currently ranked 252 of 365 in D1. Trending down strongly 🟢.
USC Upstate
Record: 9-11 | Elo: 1364.2 (ranked 339 of 365) | Efficiency Margin: -15.69 (ranked 291 of 365)
Offensive Trends:
- Shooting (Shooting): Currently ranked 284 of 365 in D1. Trending down strongly 🔴.
- FG Pct (Field Goal Percentage (FGM/FGA)): Currently ranked 215 of 365 in D1. Trending down strongly 🔴.
Defensive Trends:
- Opp Turnovers (Opp Turnovers): Currently ranked 282 of 365 in D1. Trending down strongly 🟢.
- Opp FT Pct (Opp FTM/FTA (%)): Currently ranked 139 of 365 in D1. Trending down strongly 🟢.
Winthrop
Record: 13-8 | Elo: 1552.2 (ranked 112 of 365) | Efficiency Margin: -2.50 (ranked 186 of 365)
Offensive Trends:
- Shooting (Shooting): Currently ranked 226 of 365 in D1. Trending down strongly 🔴.
- FT Rate (FTA/FGA (%)): Currently ranked 43 of 365 in D1. Trending up strongly 🟢.
Defensive Trends:
- Opp Shooting (Opp Shooting): Currently ranked 209 of 365 in D1. Trending down strongly 🟢.
- Opp FGM Per Poss (Opp FG Makes Per Possession (%)): Currently ranked 161 of 365 in D1. Trending down strongly 🟢.
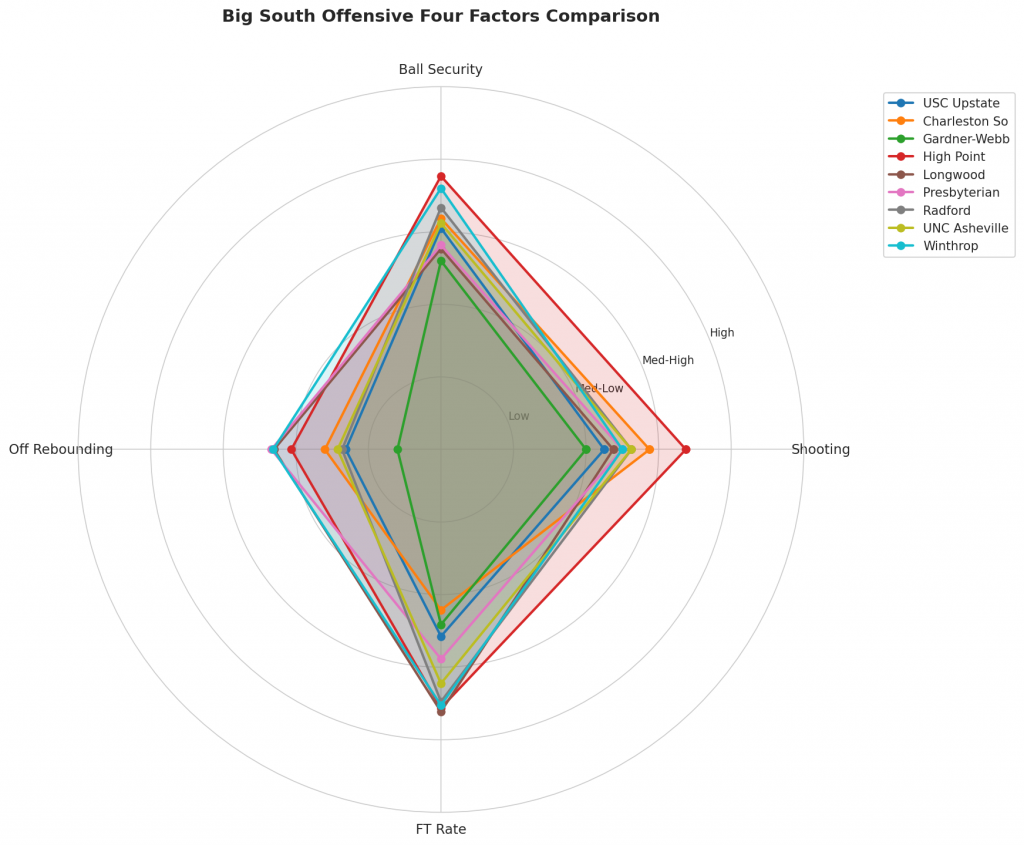
Figure 2: Offensive Four Factors comparison across Big South teams. The radar chart shows each team’s shooting efficiency (eFG%), ball security (TOV%), offensive rebounding (OREB%), and free throw generation (FT Rate).
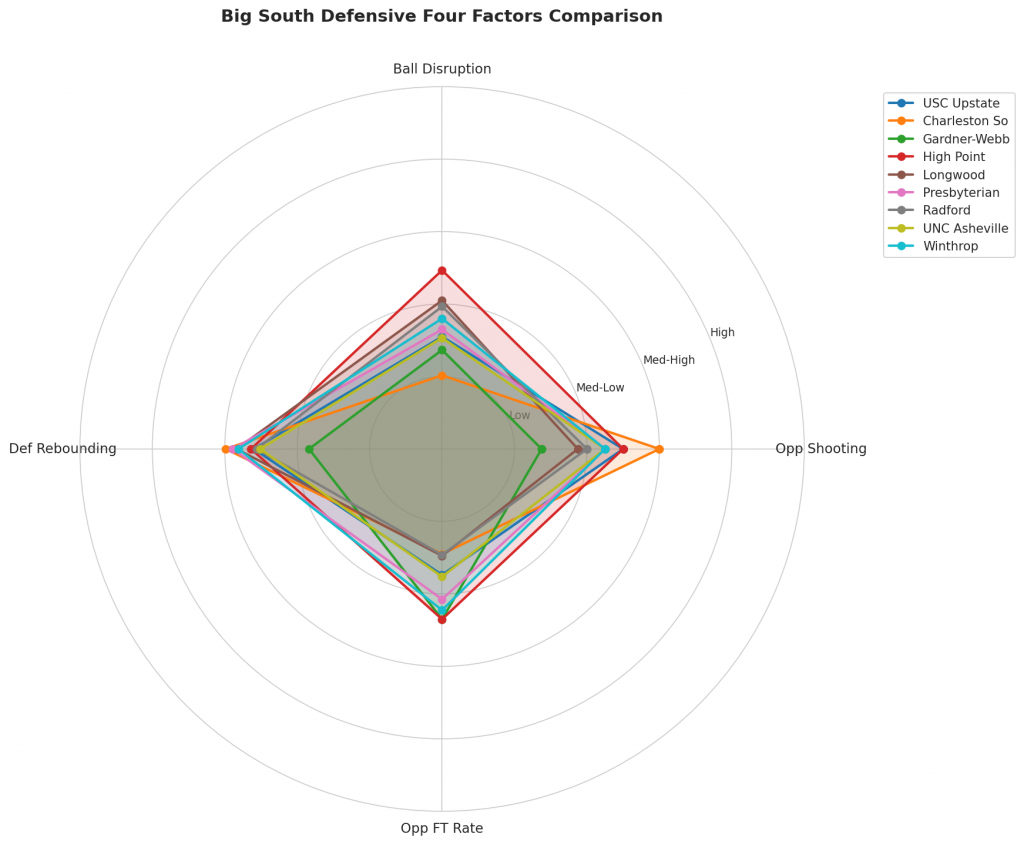
Figure 3: Defensive Four Factors comparison across Big South teams. The radar chart shows each team’s opponent shooting defense (Opp eFG%), ball disruption (forcing TOV%), defensive rebounding (DREB%), and opponent free throw prevention (Opp FT Rate).
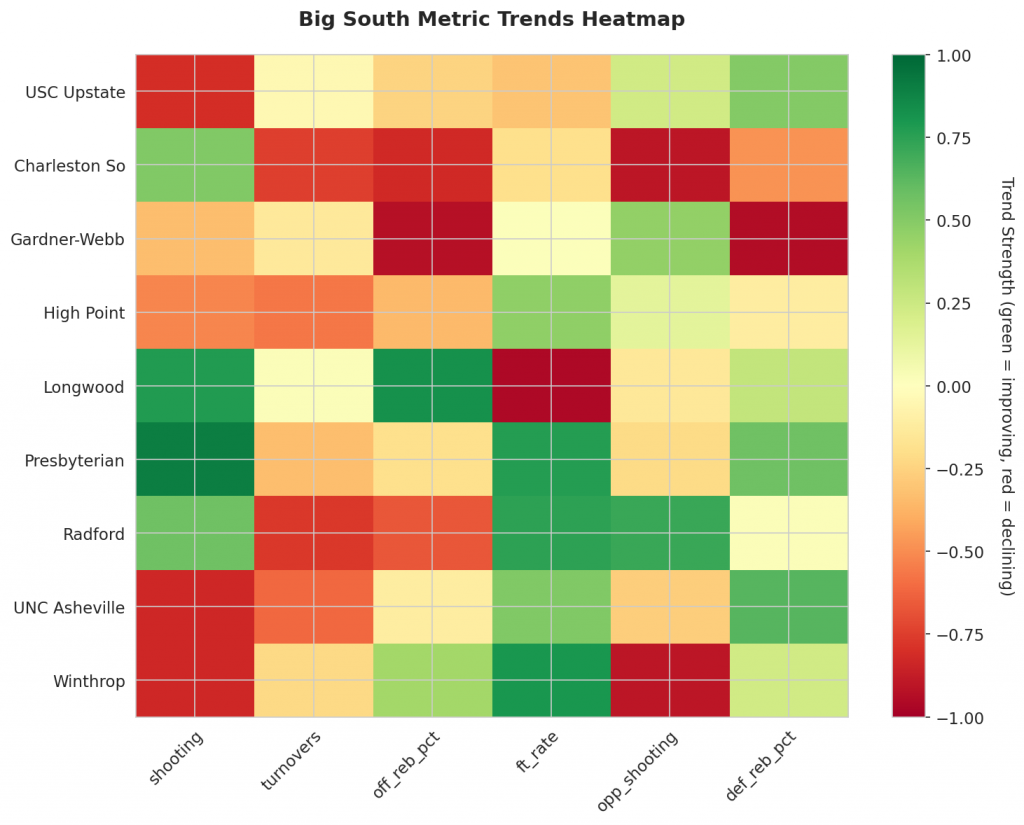
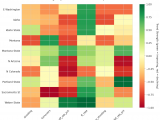
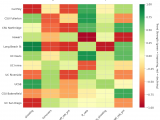
Figure 4: MACD trends heatmap showing which metrics are improving (green) or declining (red) for each team. Stronger colors indicate more pronounced trends.
Looking Ahead
As Big South teams continue their season, the MACD trending indicators will help identify which teams are genuinely improving versus those riding unsustainable momentum. Check back next week for updated analysis.
Metrics Glossary
Four Factors (Dean Oliver’s framework for basketball success):
- eFG% (Effective Field Goal %): Field goal percentage adjusted for 3-pointers being worth more (FGM + 0.5×3PM) / FGA. Higher is better offensively, lower is better defensively.
- TOV% (Turnover Rate): Turnovers per 100 possessions. Lower is better offensively (taking care of the ball), higher is better defensively (forcing turnovers).
- OREB% / DREB% (Offensive/Defensive Rebound Rate): Percentage of available rebounds grabbed. Offensive rebounds create second-chance points; defensive rebounds end opponent possessions.
- FTR (Free Throw Rate): Free throws made per field goal attempt (FTM/FGA). Measures ability to get to the line AND convert. Higher is better offensively, lower is better defensively.
Other Metrics:
- Elo Rating: Chess-style rating system that updates based on game results and opponent strength. Higher Elo indicates stronger team.
- Efficiency Margin: Point differential per 100 possessions (Offensive Efficiency – Defensive Efficiency). Accounts for pace of play.
- MACD (Moving Average Convergence Divergence): Trend indicator comparing 12-game and 26-game exponential moving averages. Positive MACD = improving trend, Negative MACD = declining trend.
Analysis powered by HoopSci’s advanced metrics and MACD trending indicators.