Ohio Valley Update: Week 11
January 19, 2026The Ohio Valley enters Week 11 with teams showing diverse trending patterns. This analysis examines each team’s performance trends using MACD (Moving Average Convergence Divergence) indicators to identify not just where teams stand, but where they’re headed.
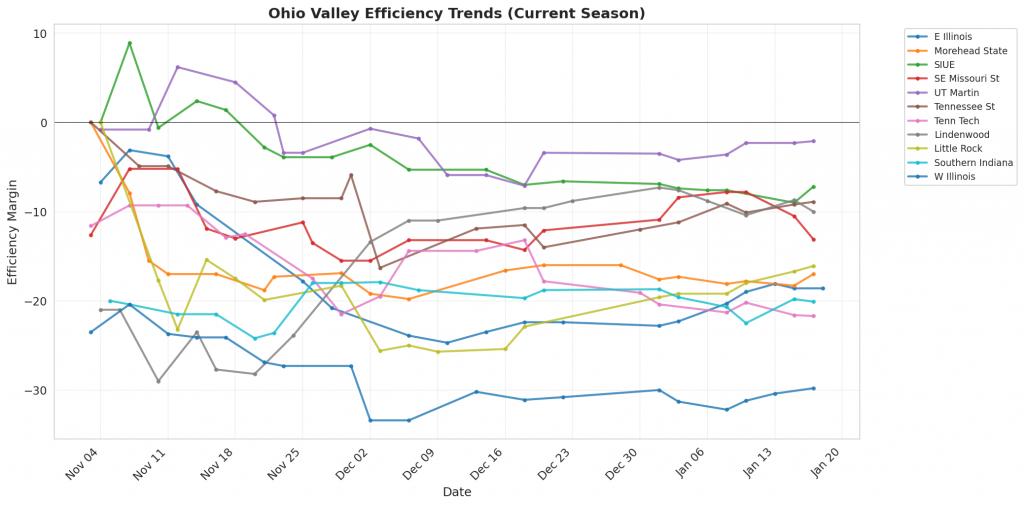
Figure 1: Efficiency margin trends for Ohio Valley teams throughout the season. Teams trending upward show improving performance, while downward trends indicate struggles.
Conference Snapshot
- Week Dates: January 12 – January 18, 2026
- Trending Up (Efficiency): E Illinois, Morehead State, SIUE, Tennessee St, Lindenwood
- Trending Down (Efficiency): SE Missouri St, UT Martin, Tenn Tech, Southern Indiana, W Illinois
Team-by-Team Analysis
E Illinois
Record: 7-11 | Elo: 1388.0 (ranked 319 of 365) | Efficiency Margin: -18.60 (ranked 319 of 365)
Offensive Trends:
- Shooting (Shooting): Currently ranked 350 of 365 in D1. Trending up strongly 🟢.
- Off Reb Pct (Offensive Rebounding): Currently ranked 328 of 365 in D1. Trending up strongly 🟢.
Defensive Trends:
- Opp Shooting (Opp Shooting): Currently ranked 147 of 365 in D1. Trending down strongly 🟢.
- Opp FG Pct (%) (Opp FGM/FGA (%)): Currently ranked 162 of 365 in D1. Trending down strongly 🟢.
Lindenwood
Record: 11-8 | Elo: 1439.0 (ranked 262 of 365) | Efficiency Margin: -9.96 (ranked 246 of 365)
Offensive Trends:
- Adj Off Eff (Adjusted Offensive Efficiency): Currently ranked 311 of 365 in D1. Trending up strongly 🟢.
- 2Pt Pct (2 Point FGM/FGA (%)): Currently ranked 155 of 365 in D1. Trending up strongly 🟢.
Defensive Trends:
- Opp FT Rate (Opp FTA/FGA (%)): Currently ranked 172 of 365 in D1. Trending down strongly 🟢.
- Opp 2PM Per Poss (Opp 2 Point Makes Per Possession (%)): Currently ranked 256 of 365 in D1. Trending up strongly 🔴.
Little Rock
Record: 8-10 | Elo: 1476.9 (ranked 225 of 365) | Efficiency Margin: -16.08 (ranked 299 of 365)
Offensive Trends:
- Turnovers (Turnovers): Currently ranked 345 of 365 in D1. Trending down strongly 🟢.
- Off Reb Pct (Offensive Rebounding): Currently ranked 119 of 365 in D1. Trending up strongly 🟢.
Defensive Trends:
- Opp FT Rate (Opp FTA/FGA (%)): Currently ranked 67 of 365 in D1. Trending down strongly 🟢.
- Opp FGA Per Poss (Opp FG Attempts Per Possession (%)): Currently ranked 247 of 365 in D1. Trending up strongly 🔴.
Morehead State
Record: 9-10 | Elo: 1461.8 (ranked 241 of 365) | Efficiency Margin: -17.02 (ranked 305 of 365)
Offensive Trends:
- Shooting (Shooting): Currently ranked 291 of 365 in D1. Trending up strongly 🟢.
- Turnovers (Turnovers): Currently ranked 309 of 365 in D1. Trending down strongly 🟢.
Defensive Trends:
- Def Reb Pct (Defensive Rebounding): Currently ranked 329 of 365 in D1. Trending down strongly 🔴.
- Opp FGM Per Poss (Opp FG Makes Per Possession (%)): Currently ranked 284 of 365 in D1. Trending up strongly 🔴.
SE Missouri St
Record: 9-10 | Elo: 1455.2 (ranked 248 of 365) | Efficiency Margin: -13.10 (ranked 272 of 365)
Offensive Trends:
- FT Rate (FTA/FGA (%)): Currently ranked 167 of 365 in D1. Trending up strongly 🟢.
- FGM Per Poss (Field Goal Makes Per Possession (%)): Currently ranked 168 of 365 in D1. Trending down strongly 🔴.
Defensive Trends:
- Opp 3Pt Pct (Opp 3 Point FGM/FGA (%)): Currently ranked 306 of 365 in D1. Trending up strongly 🔴.
- Opp Off Tempo (Opp Offensive Possessions Per Game): Currently ranked 138 of 365 in D1. Trending down strongly 🟢.
SIUE
Record: 11-8 | Elo: 1494.7 (ranked 200 of 365) | Efficiency Margin: -7.15 (ranked 223 of 365)
Offensive Trends:
- Off Tempo (Offensive Possessions Per Game): Currently ranked 296 of 365 in D1. Trending down strongly 🔴.
- Steals Per Poss (Steals Per Possession): Currently ranked 115 of 365 in D1. Trending up strongly 🟢.
Defensive Trends:
- Opp FT Rate (Opp FTA/FGA (%)): Currently ranked 223 of 365 in D1. Trending up strongly 🔴.
- Opp FGA Per Poss (Opp FG Attempts Per Possession (%)): Currently ranked 172 of 365 in D1. Trending down strongly 🟢.
Southern Indiana
Record: 4-14 | Elo: 1308.1 (ranked 363 of 365) | Efficiency Margin: -20.06 (ranked 325 of 365)
Offensive Trends:
- 2Pt Rate (2 Point Attempts/FGA (%)): Currently ranked 260 of 365 in D1. Trending down strongly 🔴.
- 2Pt Pct (2 Point FGM/FGA (%)): Currently ranked 357 of 365 in D1. Trending down strongly 🔴.
Defensive Trends:
- Opp 2Pt Rate (Opp 2 Point Attempts/FGA (%)): Currently ranked 364 of 365 in D1. Trending up strongly 🔴.
- Opp 2PM Per Poss (Opp 2 Point Makes Per Possession (%)): Currently ranked 345 of 365 in D1. Trending up strongly 🔴.
Tenn Tech
Record: 7-12 | Elo: 1368.4 (ranked 335 of 365) | Efficiency Margin: -21.68 (ranked 333 of 365)
Offensive Trends:
- Shooting (Shooting): Currently ranked 278 of 365 in D1. Trending down strongly 🔴.
- FG Pct (Field Goal Percentage (FGM/FGA)): Currently ranked 211 of 365 in D1. Trending down strongly 🔴.
Defensive Trends:
- Opp Turnovers (Opp Turnovers): Currently ranked 262 of 365 in D1. Trending down strongly 🟢.
- Def Reb Pct (Defensive Rebounding): Currently ranked 294 of 365 in D1. Trending down strongly 🔴.
Tennessee St
Record: 12-6 | Elo: 1514.4 (ranked 162 of 365) | Efficiency Margin: -8.86 (ranked 240 of 365)
Offensive Trends:
- Turnovers (Turnovers): Currently ranked 165 of 365 in D1. Trending down strongly 🟢.
- Off Reb Pct (Offensive Rebounding): Currently ranked 179 of 365 in D1. Trending down strongly 🔴.
Defensive Trends:
- Opp FT Rate (Opp FTA/FGA (%)): Currently ranked 338 of 365 in D1. Trending down strongly 🟢.
- Opp Turnovers (Opp Turnovers): Currently ranked 45 of 365 in D1. Trending down moderately 🟢.
UT Martin
Record: 15-4 | Elo: 1515.3 (ranked 160 of 365) | Efficiency Margin: -2.08 (ranked 178 of 365)
Offensive Trends:
- Balls Stolen Per Poss (Balls Stolen Per Possession): Currently ranked 332 of 365 in D1. Trending up strongly 🟢.
- Adj Def Eff (Adjusted Defensive Efficiency): Currently ranked 105 of 365 in D1. Trending down strongly 🔴.
Defensive Trends:
- Opp Shooting (Opp Shooting): Currently ranked 24 of 365 in D1. Trending down strongly 🟢.
- Opp FGM Per Poss (Opp FG Makes Per Possession (%)): Currently ranked 46 of 365 in D1. Trending down strongly 🟢.
W Illinois
Record: 4-15 | Elo: 1332.2 (ranked 358 of 365) | Efficiency Margin: -29.77 (ranked 359 of 365)
Offensive Trends:
- Shooting (Shooting): Currently ranked 362 of 365 in D1. Trending down strongly 🔴.
- FT Rate (FTA/FGA (%)): Currently ranked 113 of 365 in D1. Trending up strongly 🟢.
Defensive Trends:
- Opp FGA Per Poss (Opp FG Attempts Per Possession (%)): Currently ranked 242 of 365 in D1. Trending down strongly 🟢.
- Opp 2Pt Rate (Opp 2 Point Attempts/FGA (%)): Currently ranked 298 of 365 in D1. Trending up strongly 🔴.
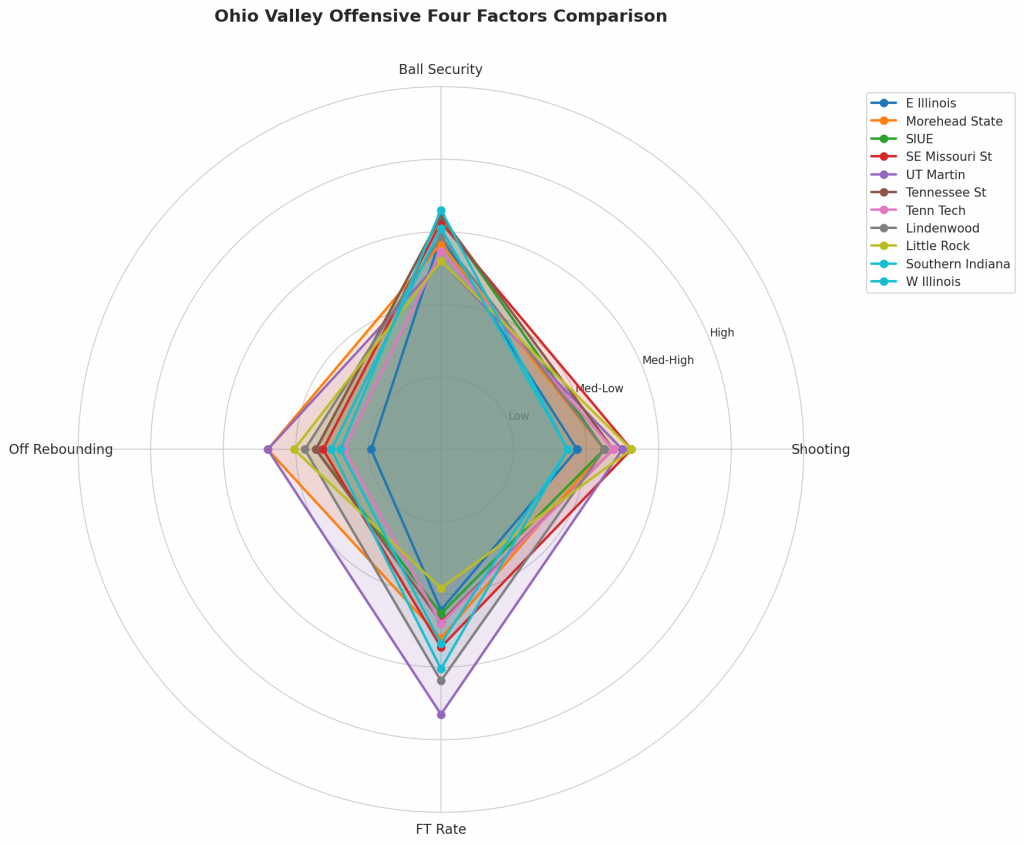
Figure 2: Offensive Four Factors comparison across Ohio Valley teams. The radar chart shows each team’s shooting efficiency (eFG%), ball security (TOV%), offensive rebounding (OREB%), and free throw generation (FT Rate).
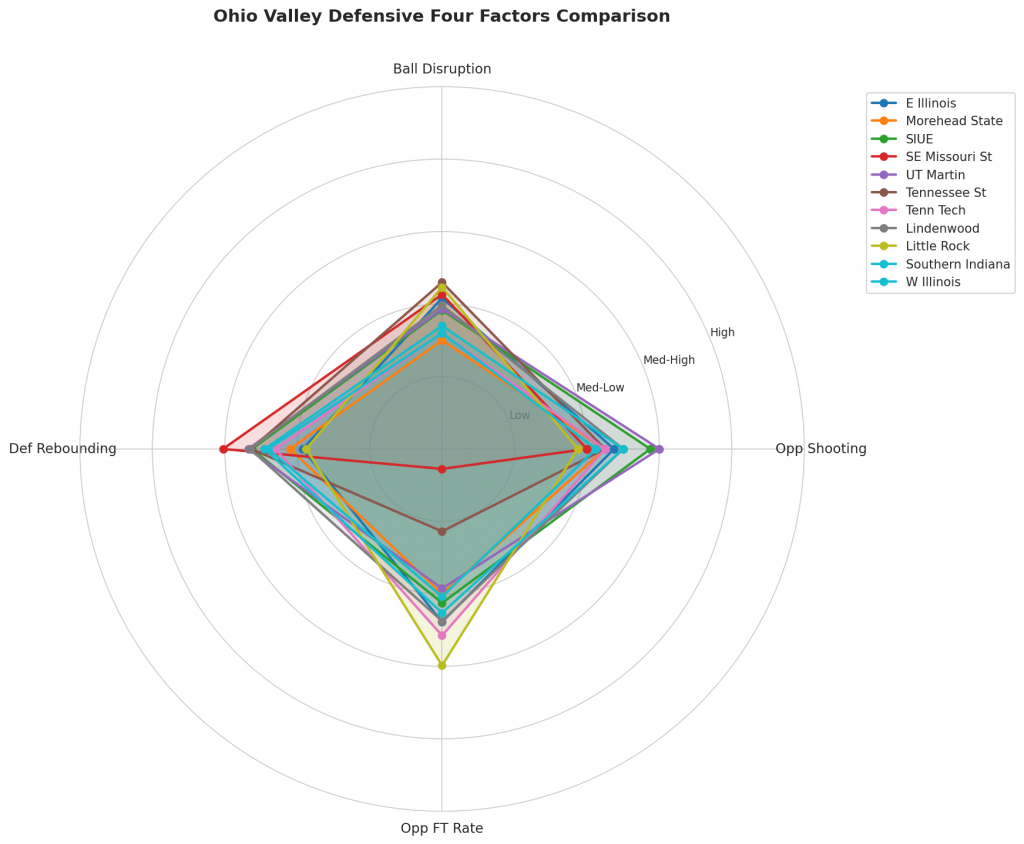
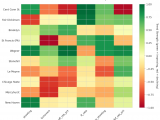
Figure 3: Defensive Four Factors comparison across Ohio Valley teams. The radar chart shows each team’s opponent shooting defense (Opp eFG%), ball disruption (forcing TOV%), defensive rebounding (DREB%), and opponent free throw prevention (Opp FT Rate).
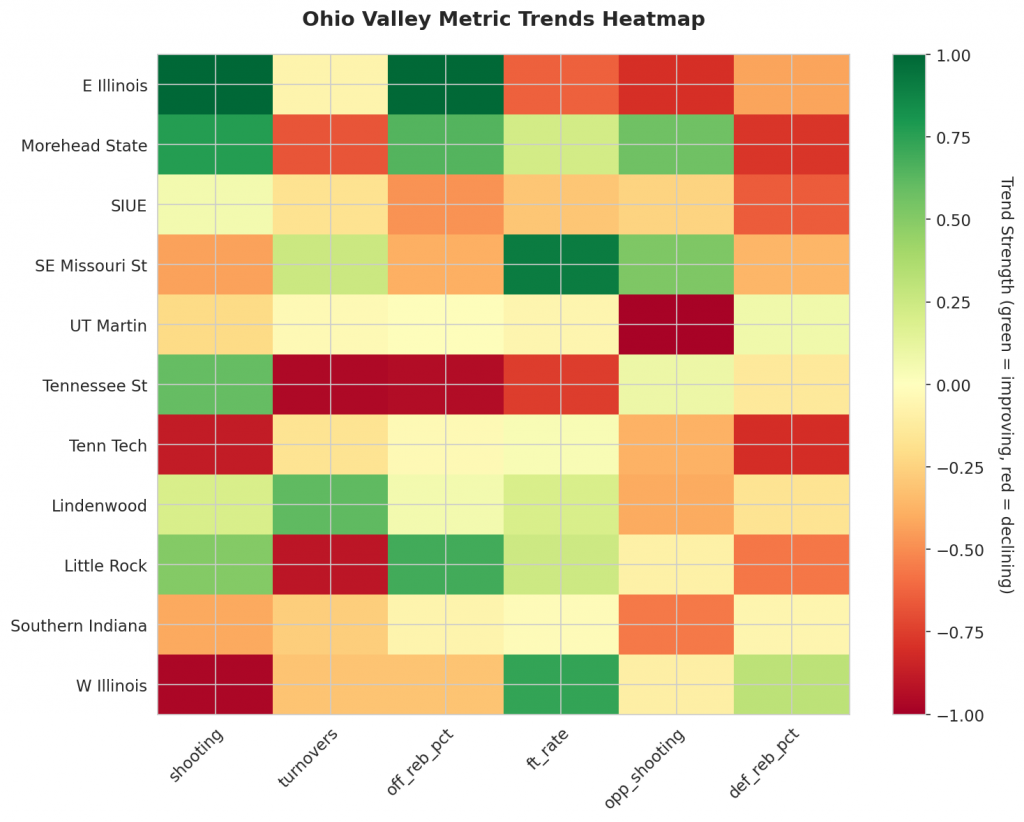
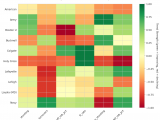
Figure 4: MACD trends heatmap showing which metrics are improving (green) or declining (red) for each team. Stronger colors indicate more pronounced trends.
Looking Ahead
As Ohio Valley teams continue their season, the MACD trending indicators will help identify which teams are genuinely improving versus those riding unsustainable momentum. Check back next week for updated analysis.
Metrics Glossary
Four Factors (Dean Oliver’s framework for basketball success):
- eFG% (Effective Field Goal %): Field goal percentage adjusted for 3-pointers being worth more (FGM + 0.5×3PM) / FGA. Higher is better offensively, lower is better defensively.
- TOV% (Turnover Rate): Turnovers per 100 possessions. Lower is better offensively (taking care of the ball), higher is better defensively (forcing turnovers).
- OREB% / DREB% (Offensive/Defensive Rebound Rate): Percentage of available rebounds grabbed. Offensive rebounds create second-chance points; defensive rebounds end opponent possessions.
- FTR (Free Throw Rate): Free throws made per field goal attempt (FTM/FGA). Measures ability to get to the line AND convert. Higher is better offensively, lower is better defensively.
Other Metrics:
- Elo Rating: Chess-style rating system that updates based on game results and opponent strength. Higher Elo indicates stronger team.
- Efficiency Margin: Point differential per 100 possessions (Offensive Efficiency – Defensive Efficiency). Accounts for pace of play.
- MACD (Moving Average Convergence Divergence): Trend indicator comparing 12-game and 26-game exponential moving averages. Positive MACD = improving trend, Negative MACD = declining trend.
Analysis powered by HoopSci’s advanced metrics and MACD trending indicators.