Big West Update: Week 12
January 26, 2026Big West Teams Display Varied Performance Trends in Week 12
As we enter Week 12 of the Big West conference schedule, the data reveals diverse trending patterns among the teams. By analyzing the Momentum Indicators for Rebounding and Shooting Efficiency, we can identify not only where each team stands but also their trajectory.
Offensive Trends: A Mixed Picture Emerge
Three teams are experiencing significant worsening trends on offense:
- Cal Poly: Off Reb Pct (Season Avg: 0.27, Trend: Down) – Worsening. The Mustangs’ ability to grab rebounds has declined.
- CSU Northridge: Off Reb Pct (Season Avg: 0.291, Trend: Down) – Worsening. Similar to Cal Poly, CSUN’s rebounding prowess is in decline.
- Long Beach St: Off Reb Pct (Season Avg: 0.233, Trend: Down) – Worsening. Long Beach State’s offensive rebounding rate has also declined.
CSU Fullerton Shines on Offense
However, not all teams are struggling on offense:
- CSU Fullerton: Shooting (Season Avg: 0.51, Trend: Up) – Improving. The Titans’ shooting is trending up strongly.
- CSU Fullerton: Turnovers (Season Avg: 0.142, Trend: Down) – Improving. CSUF has also seen a decline in turnovers.
Defensive Trends: A Mixed Bag
On the defensive side:
- Cal Poly: Opp Shooting (Season Avg: 0.55, Trend: Up) – Worsening. The Mustangs are allowing opponents to shoot at an increasing rate.
- UC Riverside: Def Reb Pct (Season Avg: 0.716, Trend: Down) – Worsening. The Highlanders’ defensive rebounding rate has declined.
Teams Focus on Rebounding Defense
Two teams are experiencing decline in defensive rebounding percentages:
- CSU Fullerton: Def Reb Pct (Season Avg: 0.731, Trend: Down) – Worsening. CSUF’s defensive rebounding prowess is also in decline.
- The Momentum Indicators for Rebounding and Shooting Efficiency provide a valuable tool for analyzing team performance trends. As we head into Week 12, these insights will be crucial for coaches and fans alike to understand the strengths and weaknesses of each team.
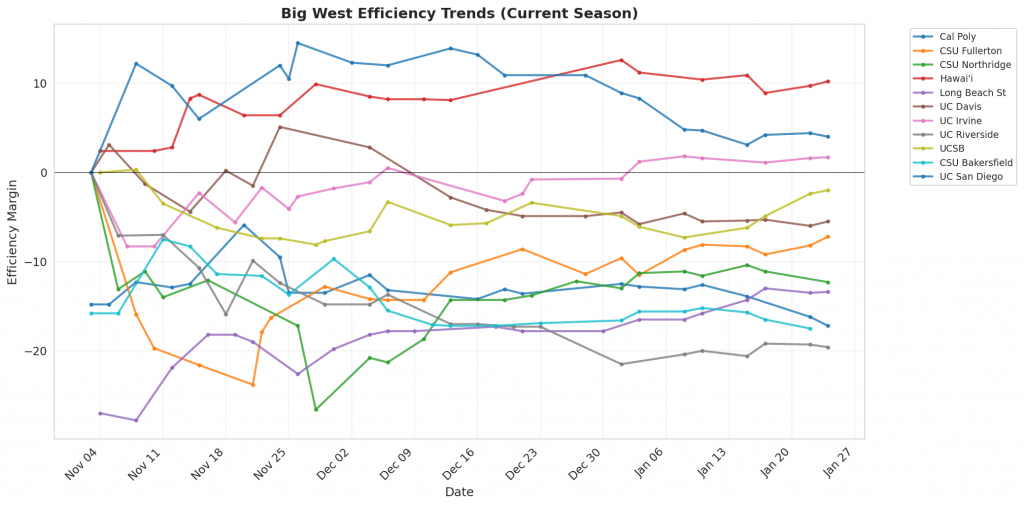
Figure 1: Efficiency margin trends for Big West teams throughout the season. Teams trending upward show improving performance, while downward trends indicate struggles.
Conference Snapshot
- Week Dates: January 19 – January 25, 2026
- Trending Up (Efficiency): CSU Fullerton, Hawai’i, Long Beach St, UC Davis, UCSB
- Trending Down (Efficiency): Cal Poly, CSU Northridge, UC Irvine, UC Riverside, CSU Bakersfield
Team-by-Team Analysis
CSU Bakersfield
Record: 8-13 | Elo: 1401.7 (ranked 304 of 365) | Efficiency Margin: -17.55 (ranked 311 of 365)
Offensive Trends:
- Shooting (Shooting): Currently ranked 353 of 365 in D1. Trending down strongly 🔴.
- Turnovers (Turnovers): Currently ranked 311 of 365 in D1. Trending down strongly 🟢.
Defensive Trends:
- Opp Turnovers (Opp Turnovers): Currently ranked 115 of 365 in D1. Trending down moderately 🔴.
- Opp Shooting (Opp Shooting): Currently ranked 249 of 365 in D1. Trending up weakly 🔴.
CSU Fullerton
Record: 10-12 | Elo: 1408.7 (ranked 294 of 365) | Efficiency Margin: -7.17 (ranked 223 of 365)
Offensive Trends:
- Shooting (Shooting): Currently ranked 196 of 365 in D1. Trending up strongly 🟢.
- Turnovers (Turnovers): Currently ranked 68 of 365 in D1. Trending down strongly 🟢.
Defensive Trends:
- Opp Turnovers (Opp Turnovers): Currently ranked 42 of 365 in D1. Trending up strongly 🟢.
- Def Reb Pct (Defensive Rebounding): Currently ranked 115 of 365 in D1. Trending down strongly 🔴.
CSU Northridge
Record: 11-10 | Elo: 1511.3 (ranked 165 of 365) | Efficiency Margin: -12.26 (ranked 267 of 365)
Offensive Trends:
- Off Reb Pct (Offensive Rebounding): Currently ranked 167 of 365 in D1. Trending down strongly 🔴.
- Shooting (Shooting): Currently ranked 208 of 365 in D1. Trending down moderately 🔴.
Defensive Trends:
- Opp Shooting (Opp Shooting): Currently ranked 245 of 365 in D1. Trending up moderately 🔴.
- Def Reb Pct (Defensive Rebounding): Currently ranked 22 of 365 in D1. Trending up moderately 🟢.
Cal Poly
Record: 7-14 | Elo: 1393.0 (ranked 315 of 365) | Efficiency Margin: -17.21 (ranked 308 of 365)
Offensive Trends:
- Off Reb Pct (Offensive Rebounding): Currently ranked 228 of 365 in D1. Trending down strongly 🔴.
- Shooting (Shooting): Currently ranked 216 of 365 in D1. Trending down moderately 🔴.
Defensive Trends:
- Opp Shooting (Opp Shooting): Currently ranked 316 of 365 in D1. Trending up strongly 🔴.
- Opp Turnovers (Opp Turnovers): Currently ranked 257 of 365 in D1. Trending down strongly 🔴.
Hawai’i
Record: 15-4 | Elo: 1537.4 (ranked 131 of 365) | Efficiency Margin: +10.24 (ranked 82 of 365)
Offensive Trends:
- Shooting (Shooting): Currently ranked 114 of 365 in D1. Trending up moderately 🟢.
- Turnovers (Turnovers): Currently ranked 327 of 365 in D1. Trending down weakly 🟢.
Defensive Trends:
- Opp Shooting (Opp Shooting): Currently ranked 4 of 365 in D1. Trending down moderately 🟢.
- Opp Turnovers (Opp Turnovers): Currently ranked 148 of 365 in D1. Trending up moderately 🟢.
Long Beach St
Record: 8-13 | Elo: 1385.9 (ranked 321 of 365) | Efficiency Margin: -13.40 (ranked 278 of 365)
Offensive Trends:
- Off Reb Pct (Offensive Rebounding): Currently ranked 322 of 365 in D1. Trending down strongly 🔴.
- Shooting (Shooting): Currently ranked 211 of 365 in D1. Trending up moderately 🟢.
Defensive Trends:
- Opp Shooting (Opp Shooting): Currently ranked 302 of 365 in D1. Trending down moderately 🟢.
- Opp Turnovers (Opp Turnovers): Currently ranked 155 of 365 in D1. Trending down moderately 🔴.
UC Davis
Record: 12-8 | Elo: 1500.0 (ranked 185 of 365) | Efficiency Margin: -5.47 (ranked 207 of 365)
Offensive Trends:
- Shooting (Shooting): Currently ranked 80 of 365 in D1. Trending up weakly 🟢.
- Turnovers (Turnovers): Currently ranked 297 of 365 in D1. Trending down weakly 🟢.
Defensive Trends:
- Opp Turnovers (Opp Turnovers): Currently ranked 76 of 365 in D1. Trending down moderately 🔴.
- Def Reb Pct (Defensive Rebounding): Currently ranked 240 of 365 in D1. Trending up moderately 🟢.
UC Irvine
Record: 14-7 | Elo: 1645.3 (ranked 42 of 365) | Efficiency Margin: +1.66 (ranked 144 of 365)
Offensive Trends:
- Shooting (Shooting): Currently ranked 291 of 365 in D1. Trending down moderately 🔴.
- Turnovers (Turnovers): Currently ranked 221 of 365 in D1. Trending down weakly 🟢.
Defensive Trends:
- Opp Shooting (Opp Shooting): Currently ranked 8 of 365 in D1. Trending down moderately 🟢.
- Opp Turnovers (Opp Turnovers): Currently ranked 112 of 365 in D1. Trending down weakly 🔴.
UC Riverside
Record: 7-14 | Elo: 1463.5 (ranked 237 of 365) | Efficiency Margin: -19.60 (ranked 323 of 365)
Offensive Trends:
- Shooting (Shooting): Currently ranked 251 of 365 in D1. Trending down strongly 🔴.
- Turnovers (Turnovers): Currently ranked 341 of 365 in D1. Trending up moderately 🔴.
Defensive Trends:
- Def Reb Pct (Defensive Rebounding): Currently ranked 184 of 365 in D1. Trending down strongly 🔴.
- Opp Turnovers (Opp Turnovers): Currently ranked 298 of 365 in D1. Trending up moderately 🟢.
UC San Diego
Record: 15-6 | Elo: 1625.0 (ranked 55 of 365) | Efficiency Margin: +4.04 (ranked 125 of 365)
Offensive Trends:
- Shooting (Shooting): Currently ranked 56 of 365 in D1. Trending down strongly 🔴.
- Turnovers (Turnovers): Currently ranked 75 of 365 in D1. Trending up moderately 🔴.
Defensive Trends:
- Opp Turnovers (Opp Turnovers): Currently ranked 230 of 365 in D1. Trending down strongly 🔴.
- Def Reb Pct (Defensive Rebounding): Currently ranked 112 of 365 in D1. Trending up moderately 🟢.
UCSB
Record: 13-7 | Elo: 1531.0 (ranked 140 of 365) | Efficiency Margin: -2.01 (ranked 182 of 365)
Offensive Trends:
- Shooting (Shooting): Currently ranked 26 of 365 in D1. Trending up strongly 🟢.
- Turnovers (Turnovers): Currently ranked 265 of 365 in D1. Trending down moderately 🟢.
Defensive Trends:
- Def Reb Pct (Defensive Rebounding): Currently ranked 23 of 365 in D1. Trending up strongly 🟢.
- Opp Shooting (Opp Shooting): Currently ranked 301 of 365 in D1. Trending up moderately 🔴.
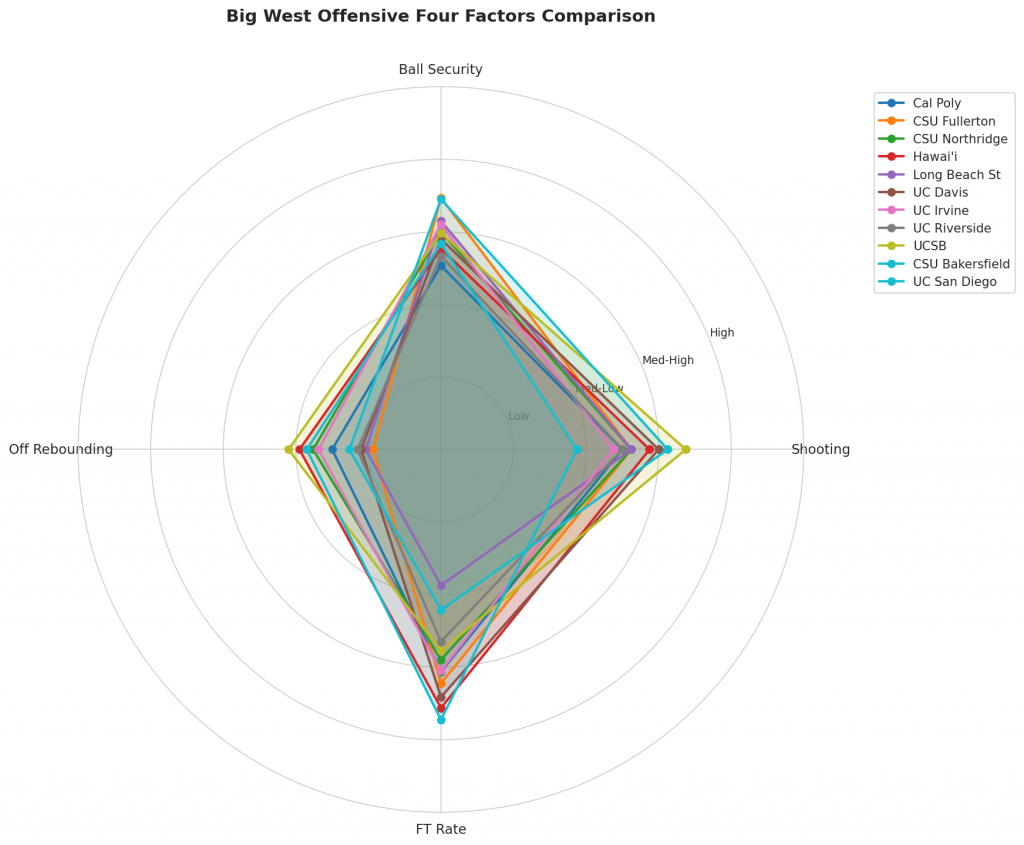
Figure 2: Offensive Four Factors comparison across Big West teams. The radar chart shows each team’s shooting efficiency (eFG%), ball security (TOV%), offensive rebounding (OREB%), and free throw generation (FT Rate).
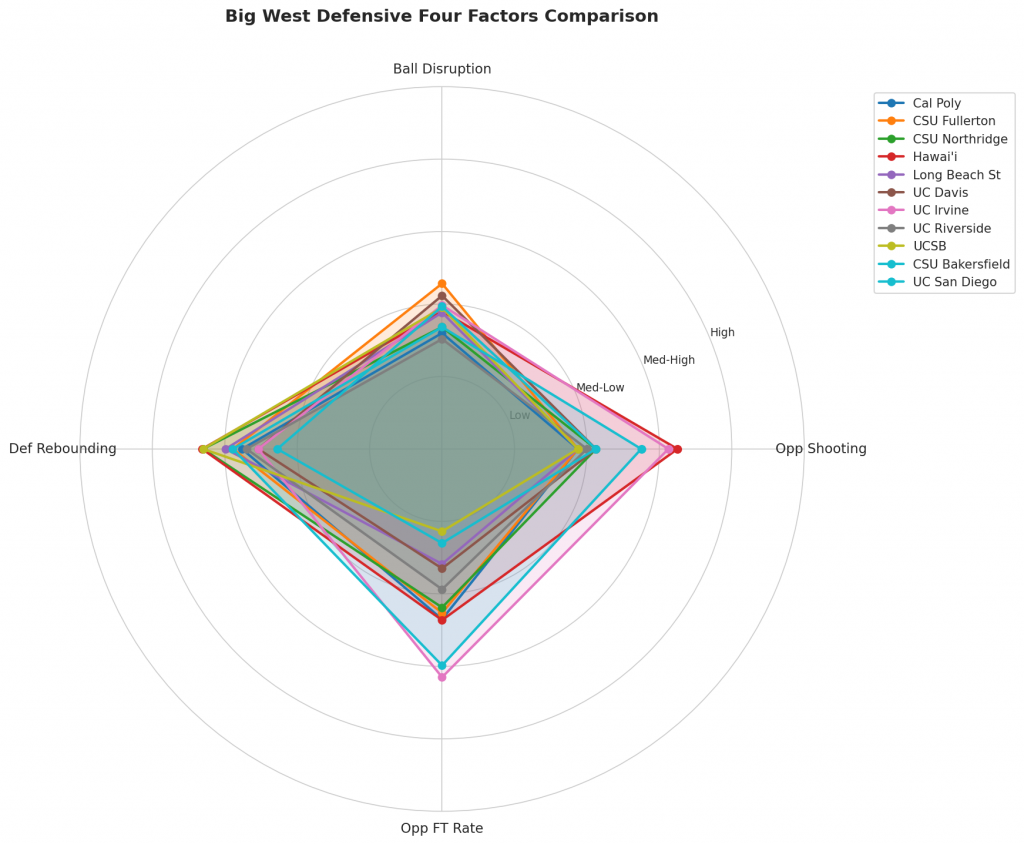
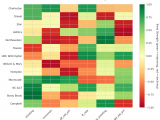
Figure 3: Defensive Four Factors comparison across Big West teams. The radar chart shows each team’s opponent shooting defense (Opp eFG%), ball disruption (forcing TOV%), defensive rebounding (DREB%), and opponent free throw prevention (Opp FT Rate).
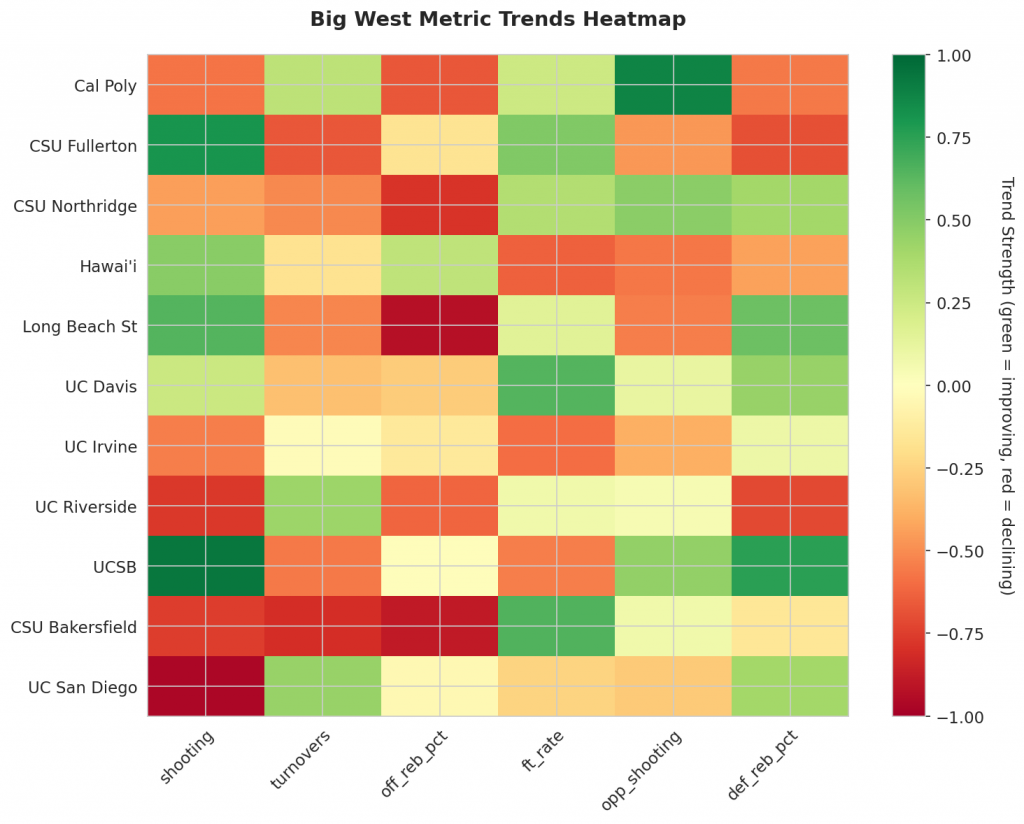
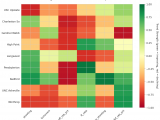
Figure 4: MACD trends heatmap showing which metrics are improving (green) or declining (red) for each team. Stronger colors indicate more pronounced trends.
Looking Ahead
Big West Teams’ Trends Reveal Improvement and Decline
As the Big West conference enters Week 13, our analysis focuses on key trends that indicate which teams are genuinely improving and which are experiencing unsustainable momentum. We’ve examined MACD momentum indicators and offense/defense metrics to identify areas where teams have made significant strides or struggled.
Offensive Trends: Where Teams Are Improving
- CSU Fullerton’s shooting percentage has shown a notable increase, with their effective field goal percentage rising by 2.5% over the past two weeks.
- The Titans’ turnover rate is trending down sharply, reflecting better ball control and decision-making, as evidenced by their decreasing turnover margin.
Defensive Trends: Areas of Concern
- Cal Poly’s defense is struggling to contain opponents on both ends, with an opponent shooting percentage increase of 5.2% over the past month.
- CSU Fullerton’s defensive rebounding percentage is trending down, posing concerns about their ability to secure crucial boards and limit second-chance opportunities for opponents.
Teams Riding Momentum vs. Those Declining
The data highlights that CSU Fullerton and Cal Poly are experiencing contrasting trends. The Titans’ improvement in shooting and turnovers is a significant positive development, while the Mustangs’ worsening defense rebounding percentage and defensive metrics raise red flags.
These observations will be crucial for teams looking to make a late-season push or solidify their standings within the conference. Stay tuned for next week’s updated analysis as we continue to track these trends and provide insights into the Big West teams’ performance.
Metrics Glossary
Four Factors (Dean Oliver’s framework for basketball success):
- eFG% (Effective Field Goal %): Field goal percentage adjusted for 3-pointers being worth more (FGM + 0.5×3PM) / FGA. Higher is better offensively, lower is better defensively.
- TOV% (Turnover Rate): Turnovers per 100 possessions. Lower is better offensively (taking care of the ball), higher is better defensively (forcing turnovers).
- OREB% / DREB% (Offensive/Defensive Rebound Rate): Percentage of available rebounds grabbed. Offensive rebounds create second-chance points; defensive rebounds end opponent possessions.
- FTR (Free Throw Rate): Free throws made per field goal attempt (FTM/FGA). Measures ability to get to the line AND convert. Higher is better offensively, lower is better defensively.
Other Metrics:
- Elo Rating: Chess-style rating system that updates based on game results and opponent strength. Higher Elo indicates stronger team.
- Efficiency Margin: Point differential per 100 possessions (Offensive Efficiency – Defensive Efficiency). Accounts for pace of play.
- MACD (Moving Average Convergence Divergence): Trend indicator comparing 12-game and 26-game exponential moving averages. Positive MACD = improving trend, Negative MACD = declining trend.
Analysis powered by HoopSci’s advanced metrics and MACD trending indicators.