Conference USA Update: Week 12
January 26, 2026Conference USA Week 12 Analysis: Diving into Team Performance Trends
As Conference USA enters its final stretch, teams are exhibiting varying performance trends, as revealed by the Momentum Analysis of Current Difference (MACD) indicators. This analysis delves into the top offensive and defensive trends, providing a data-driven perspective on each team’s trajectory.
Offensive Concerns
Three teams are struggling with their rebounding efficiency: FIU (0.305 Off Reb Pct), Mid Tennessee (0.266 Off Reb Pct), and UTEP (0.248 Off Reb Pct). All three metrics indicate a worsening trend, suggesting that these teams are struggling to secure rebounds on offense.
Defensive Struggles
On the defensive side, several teams are facing challenges in limiting their opponents’ shooting percentages. Liberty is experiencing difficulties with an increase in opponent shooting percentage (0.51 Opp Shooting), while Western Kentucky’s defense is also underperforming with a similar trend (0.52 Opp Shooting).
LA Tech’s defensive rebounding percentage is trending down strongly (0.722 Def Reb Pct), allowing opponents to grab a larger share of rebounds.
Conclusion
The data suggests that Conference USA teams face various challenges as the regular season winds down. While some teams exhibit improving trends on defense, several others struggle with rebounding efficiency and opponent shooting percentages. As teams head into Week 12, these trends will undoubtedly impact their performance in upcoming games.
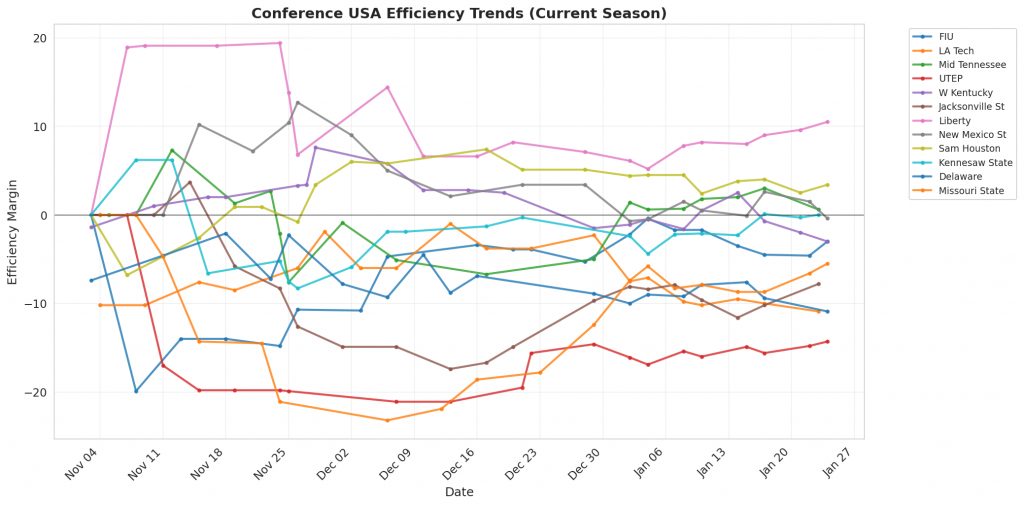
Figure 1: Efficiency margin trends for Conference USA teams throughout the season. Teams trending upward show improving performance, while downward trends indicate struggles.
Conference Snapshot
- Week Dates: January 19 – January 25, 2026
- Trending Up (Efficiency): FIU, Mid Tennessee, UTEP, Jacksonville St, Liberty
- Trending Down (Efficiency): LA Tech, W Kentucky, Kennesaw State, Delaware
Team-by-Team Analysis
Delaware
Record: 5-13 | Elo: 1415.0 (ranked 287 of 365) | Efficiency Margin: -10.85 (ranked 257 of 365)
Offensive Trends:
- Off Reb Pct (Offensive Rebounding): Currently ranked 361 of 365 in D1. Trending down strongly 🔴.
- Shooting (Shooting): Currently ranked 130 of 365 in D1. Trending down moderately 🔴.
Defensive Trends:
- Opp Turnovers (Opp Turnovers): Currently ranked 336 of 365 in D1. Trending down strongly 🔴.
- Def Reb Pct (Defensive Rebounding): Currently ranked 168 of 365 in D1. Trending up strongly 🟢.
FIU
Record: 10-10 | Elo: 1414.2 (ranked 288 of 365) | Efficiency Margin: -3.02 (ranked 193 of 365)
Offensive Trends:
- Off Reb Pct (Offensive Rebounding): Currently ranked 131 of 365 in D1. Trending down strongly 🔴.
- Turnovers (Turnovers): Currently ranked 185 of 365 in D1. Trending down moderately 🟢.
Defensive Trends:
- Def Reb Pct (Defensive Rebounding): Currently ranked 341 of 365 in D1. Trending down moderately 🔴.
- Opp Shooting (Opp Shooting): Currently ranked 244 of 365 in D1. Trending up weakly 🔴.
Jacksonville St
Record: 10-9 | Elo: 1510.8 (ranked 166 of 365) | Efficiency Margin: -7.76 (ranked 228 of 365)
Offensive Trends:
- Off Reb Pct (Offensive Rebounding): Currently ranked 192 of 365 in D1. Trending down strongly 🔴.
- Shooting (Shooting): Currently ranked 226 of 365 in D1. Trending up moderately 🟢.
Defensive Trends:
- Def Reb Pct (Defensive Rebounding): Currently ranked 74 of 365 in D1. Trending down moderately 🔴.
- Opp Shooting (Opp Shooting): Currently ranked 110 of 365 in D1. Trending up weakly 🔴.
Kennesaw State
Record: 12-8 | Elo: 1520.8 (ranked 154 of 365) | Efficiency Margin: +0.00 (ranked 159 of 365)
Offensive Trends:
- Turnovers (Turnovers): Currently ranked 241 of 365 in D1. Trending down strongly 🟢.
- Off Reb Pct (Offensive Rebounding): Currently ranked 36 of 365 in D1. Trending down strongly 🔴.
Defensive Trends:
- Opp Shooting (Opp Shooting): Currently ranked 123 of 365 in D1. Trending up strongly 🔴.
- Opp Turnovers (Opp Turnovers): Currently ranked 281 of 365 in D1. Trending down moderately 🔴.
LA Tech
Record: 11-8 | Elo: 1531.3 (ranked 139 of 365) | Efficiency Margin: -10.90 (ranked 258 of 365)
Offensive Trends:
- Shooting (Shooting): Currently ranked 348 of 365 in D1. Trending down strongly 🔴.
- Turnovers (Turnovers): Currently ranked 134 of 365 in D1. Trending down strongly 🟢.
Defensive Trends:
- Def Reb Pct (Defensive Rebounding): Currently ranked 154 of 365 in D1. Trending down strongly 🔴.
- Opp Shooting (Opp Shooting): Currently ranked 69 of 365 in D1. Trending up moderately 🔴.
Liberty
Record: 17-3 | Elo: 1674.8 (ranked 28 of 365) | Efficiency Margin: +10.52 (ranked 80 of 365)
Offensive Trends:
- Off Reb Pct (Offensive Rebounding): Currently ranked 365 of 365 in D1. Trending down strongly 🔴.
- Turnovers (Turnovers): Currently ranked 10 of 365 in D1. Trending down moderately 🟢.
Defensive Trends:
- Opp Shooting (Opp Shooting): Currently ranked 168 of 365 in D1. Trending up strongly 🔴.
- Opp Turnovers (Opp Turnovers): Currently ranked 110 of 365 in D1. Trending up strongly 🟢.
Mid Tennessee
Record: 10-8 | Elo: 1549.6 (ranked 115 of 365) | Efficiency Margin: +0.61 (ranked 154 of 365)
Offensive Trends:
- Off Reb Pct (Offensive Rebounding): Currently ranked 249 of 365 in D1. Trending down strongly 🔴.
- Shooting (Shooting): Currently ranked 179 of 365 in D1. Trending up weakly 🟢.
Defensive Trends:
- Opp Shooting (Opp Shooting): Currently ranked 77 of 365 in D1. Trending down weakly 🟢.
- Opp Turnovers (Opp Turnovers): Currently ranked 297 of 365 in D1. Trending down weakly 🔴.
Missouri State
Record: 11-8 | Elo: 1463.6 (ranked 236 of 365) | Efficiency Margin: -5.51 (ranked 208 of 365)
Offensive Trends:
- Shooting (Shooting): Currently ranked 229 of 365 in D1. Trending up weakly 🟢.
- Turnovers (Turnovers): Currently ranked 208 of 365 in D1. Trending down weakly 🟢.
Defensive Trends:
- Opp Turnovers (Opp Turnovers): Currently ranked 178 of 365 in D1. Trending down moderately 🔴.
- Def Reb Pct (Defensive Rebounding): Currently ranked 251 of 365 in D1. Trending up moderately 🟢.
New Mexico St
Record: 10-9 | Elo: 1474.5 (ranked 221 of 365) | Efficiency Margin: -0.38 (ranked 164 of 365)
Offensive Trends:
- Off Reb Pct (Offensive Rebounding): Currently ranked 102 of 365 in D1. Trending down strongly 🔴.
- Shooting (Shooting): Currently ranked 235 of 365 in D1. Trending up moderately 🟢.
Defensive Trends:
- Opp Shooting (Opp Shooting): Currently ranked 93 of 365 in D1. Trending up strongly 🔴.
- Opp Turnovers (Opp Turnovers): Currently ranked 316 of 365 in D1. Trending down strongly 🔴.
Sam Houston
Record: 13-7 | Elo: 1547.3 (ranked 121 of 365) | Efficiency Margin: +3.42 (ranked 131 of 365)
Offensive Trends:
- Shooting (Shooting): Currently ranked 125 of 365 in D1. Trending up strongly 🟢.
- Off Reb Pct (Offensive Rebounding): Currently ranked 68 of 365 in D1. Trending down strongly 🔴.
Defensive Trends:
- Opp Shooting (Opp Shooting): Currently ranked 160 of 365 in D1. Trending down strongly 🟢.
- Opp Turnovers (Opp Turnovers): Currently ranked 149 of 365 in D1. Trending up moderately 🟢.
UTEP
Record: 7-13 | Elo: 1435.2 (ranked 268 of 365) | Efficiency Margin: -14.31 (ranked 284 of 365)
Offensive Trends:
- Off Reb Pct (Offensive Rebounding): Currently ranked 288 of 365 in D1. Trending down strongly 🔴.
- Shooting (Shooting): Currently ranked 296 of 365 in D1. Trending up moderately 🟢.
Defensive Trends:
- Opp Turnovers (Opp Turnovers): Currently ranked 96 of 365 in D1. Trending down strongly 🔴.
- Def Reb Pct (Defensive Rebounding): Currently ranked 278 of 365 in D1. Trending up strongly 🟢.
W Kentucky
Record: 11-9 | Elo: 1499.0 (ranked 187 of 365) | Efficiency Margin: -2.95 (ranked 192 of 365)
Offensive Trends:
- Turnovers (Turnovers): Currently ranked 58 of 365 in D1. Trending up strongly 🔴.
- Shooting (Shooting): Currently ranked 340 of 365 in D1. Trending down moderately 🔴.
Defensive Trends:
- Opp Shooting (Opp Shooting): Currently ranked 195 of 365 in D1. Trending up strongly 🔴.
- Opp Turnovers (Opp Turnovers): Currently ranked 163 of 365 in D1. Trending down moderately 🔴.
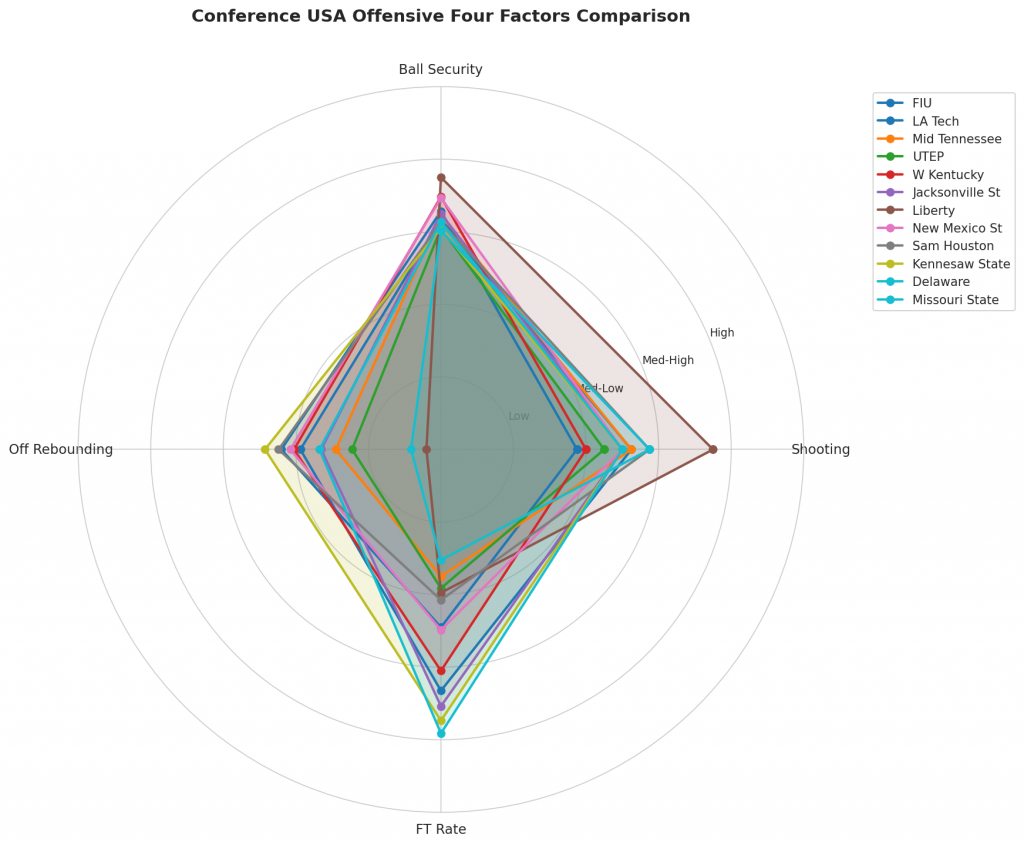
Figure 2: Offensive Four Factors comparison across Conference USA teams. The radar chart shows each team’s shooting efficiency (eFG%), ball security (TOV%), offensive rebounding (OREB%), and free throw generation (FT Rate).
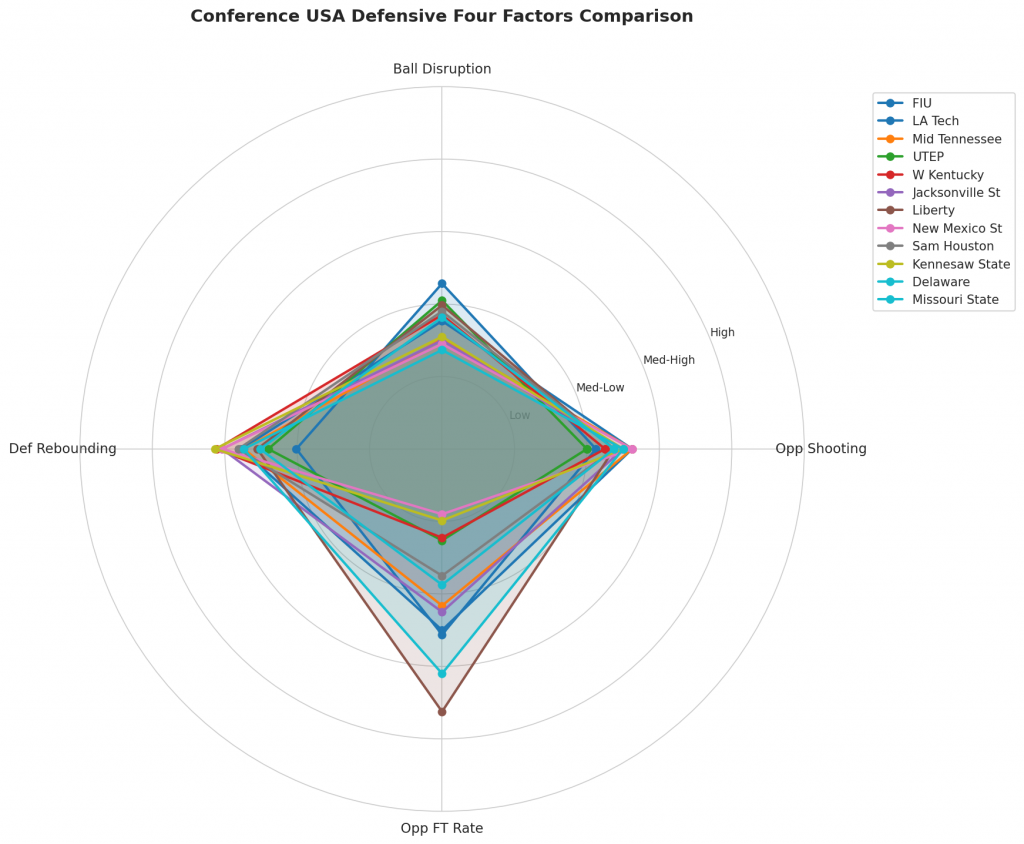
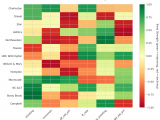
Figure 3: Defensive Four Factors comparison across Conference USA teams. The radar chart shows each team’s opponent shooting defense (Opp eFG%), ball disruption (forcing TOV%), defensive rebounding (DREB%), and opponent free throw prevention (Opp FT Rate).
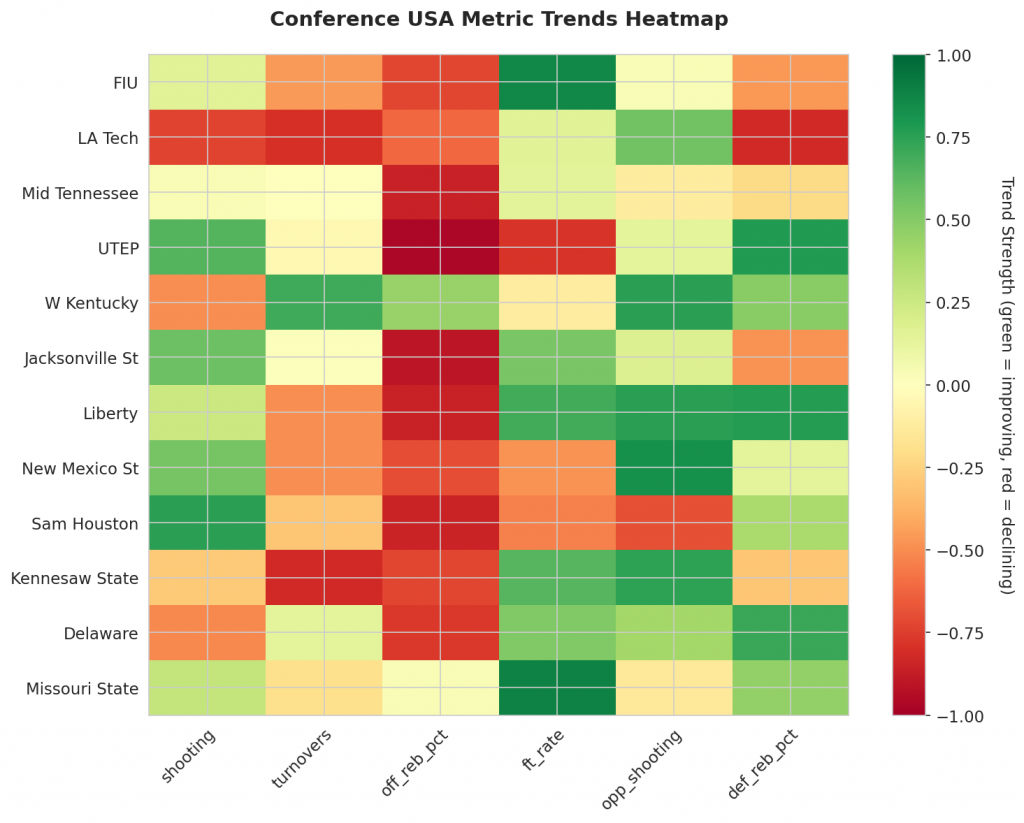
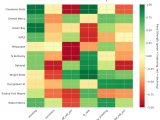
Figure 4: MACD trends heatmap showing which metrics are improving (green) or declining (red) for each team. Stronger colors indicate more pronounced trends.
Looking Ahead
Conference USA Analysis for Week 12
This week’s analysis of Conference USA teams reveals several trends that provide valuable insights into their performance.
Offensive Trends:
- FIU has seen a decline in its offensive rebounding percentage, which has worsened over time.
- LA Tech’s shooting percentage has decreased, indicating a decrease in scoring efficiency.
- Mid Tennessee’s offensive rebounding percentage has shown a downward trend, suggesting a decline in securing rebounds on offense.
Defensive Trends:
- LA Tech’s defensive rebounding percentage has been trending downwards, which is a notable concern for the team.
- UTEP’s opponents have committed fewer turnovers against them, but this trend suggests that their defense may be less effective at forcing turnovers.
- On the other hand, UTEP’s defensive rebounding percentage has improved, indicating better performance in securing rebounds on defense.
- W Kentucky’s opponents have shot more effectively against them, with an upward trend in opponent shooting percentage.
These trends offer a snapshot of Conference USA teams’ performance and provide a foundation for future analysis. As we move forward, it will be essential to monitor these trends and adjust the narrative accordingly.
The momentum indicator for team performance will continue to play a crucial role in identifying which teams are genuinely improving versus those riding unsustainable momentum. We will revisit this analysis next week, incorporating updated data and trends.
Metrics Glossary
Four Factors (Dean Oliver’s framework for basketball success):
- eFG% (Effective Field Goal %): Field goal percentage adjusted for 3-pointers being worth more (FGM + 0.5×3PM) / FGA. Higher is better offensively, lower is better defensively.
- TOV% (Turnover Rate): Turnovers per 100 possessions. Lower is better offensively (taking care of the ball), higher is better defensively (forcing turnovers).
- OREB% / DREB% (Offensive/Defensive Rebound Rate): Percentage of available rebounds grabbed. Offensive rebounds create second-chance points; defensive rebounds end opponent possessions.
- FTR (Free Throw Rate): Free throws made per field goal attempt (FTM/FGA). Measures ability to get to the line AND convert. Higher is better offensively, lower is better defensively.
Other Metrics:
- Elo Rating: Chess-style rating system that updates based on game results and opponent strength. Higher Elo indicates stronger team.
- Efficiency Margin: Point differential per 100 possessions (Offensive Efficiency – Defensive Efficiency). Accounts for pace of play.
- MACD (Moving Average Convergence Divergence): Trend indicator comparing 12-game and 26-game exponential moving averages. Positive MACD = improving trend, Negative MACD = declining trend.
Analysis powered by HoopSci’s advanced metrics and MACD trending indicators.