Summit League Update: Week 12
January 26, 2026Mid-Season Analysis: Summit League Teams Show Diverse Performance Trends
As we enter Week 12 of the college basketball season, the Summit League teams are exhibiting a mix of improving and declining trends. By analyzing Moving Average Convergence Divergence (MACD) indicators, which measure momentum by comparing short-term and long-term moving averages, we can identify which teams are on the rise and which are experiencing setbacks.
Offensive Trends: Shooting and Turnovers
North Dakota is making strides in two key areas. Their shooting has been improving, with a strong upward trend, indicating a potential boost to their scoring average. Additionally, they have seen a significant decrease in turnovers, suggesting better ball management and reduced mistakes on the court.
Denver is also experiencing an uptick in shooting performance, which could translate into more points scored per game. This trend suggests that Denver’s offense may be heating up at the right time.
North Dakota St has made notable progress in reducing turnovers, which can lead to a decrease in scoring opportunities for their opponents. However, it’s essential to monitor this trend closely as the season progresses.
Omaha’s turnover numbers have taken a step back, indicating potential difficulties with ball control and decision-making on offense.
Defensive Trends: Opponent Turnovers
North Dakota is making strides on defense by forcing more turnovers from their opponents, which can lead to easy scoring opportunities. This upward trend suggests that North Dakota’s defensive intensity may be increasing.
Denver’s opponent turnover numbers are trending downward, indicating potential struggles with pressuring the ball and disrupting opponents’ offenses.
North Dakota St has seen a significant increase in opponent turnovers, which can contribute to a stronger defensive performance. This trend is a promising sign for their chances of success.
Omaha’s defense has shown improvement on two fronts: opponent shooting percentage and opponent turnover rate. These trends suggest that Omaha’s defensive strategy may be paying off.
In conclusion, the Summit League teams are displaying diverse performance patterns as we approach Week 12. By analyzing these MACD indicators, which measure momentum by comparing short-term and long-term moving averages, we can identify areas of strength and weakness for each team. As the season unfolds, it will be essential to monitor these trends closely to predict which teams are poised for success.
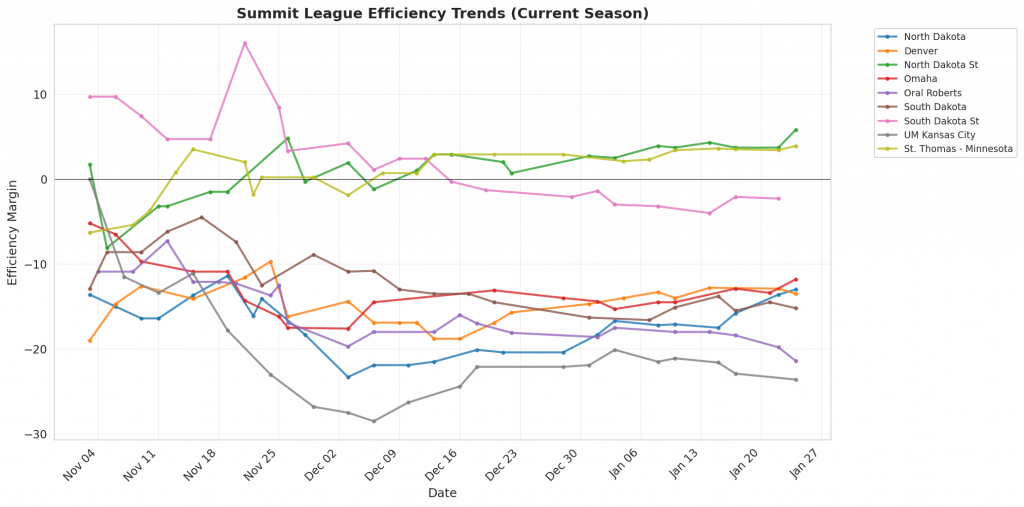
Figure 1: Efficiency margin trends for Summit League teams throughout the season. Teams trending upward show improving performance, while downward trends indicate struggles.
Conference Snapshot
- Week Dates: January 19 – January 25, 2026
- Trending Up (Efficiency): North Dakota, Denver, North Dakota St, South Dakota, South Dakota St
- Trending Down (Efficiency): Omaha, Oral Roberts
Team-by-Team Analysis
Denver
Record: 9-13 | Elo: 1386.2 (ranked 320 of 365) | Efficiency Margin: -13.53 (ranked 279 of 365)
Offensive Trends:
- Shooting (Shooting): Currently ranked 93 of 365 in D1. Trending up strongly 🟢.
- Turnovers (Turnovers): Currently ranked 54 of 365 in D1. Trending down moderately 🟢.
Defensive Trends:
- Opp Turnovers (Opp Turnovers): Currently ranked 343 of 365 in D1. Trending down strongly 🔴.
- Opp Shooting (Opp Shooting): Currently ranked 360 of 365 in D1. Trending up weakly 🔴.
North Dakota
Record: 12-12 | Elo: 1439.2 (ranked 264 of 365) | Efficiency Margin: -12.98 (ranked 273 of 365)
Offensive Trends:
- Shooting (Shooting): Currently ranked 283 of 365 in D1. Trending up strongly 🟢.
- Turnovers (Turnovers): Currently ranked 47 of 365 in D1. Trending down strongly 🟢.
Defensive Trends:
- Opp Turnovers (Opp Turnovers): Currently ranked 20 of 365 in D1. Trending up strongly 🟢.
- Opp Shooting (Opp Shooting): Currently ranked 359 of 365 in D1. Trending up moderately 🔴.
North Dakota St
Record: 18-5 | Elo: 1601.9 (ranked 69 of 365) | Efficiency Margin: +5.80 (ranked 110 of 365)
Offensive Trends:
- Turnovers (Turnovers): Currently ranked 117 of 365 in D1. Trending down strongly 🟢.
- Shooting (Shooting): Currently ranked 129 of 365 in D1. Trending up moderately 🟢.
Defensive Trends:
- Opp Turnovers (Opp Turnovers): Currently ranked 41 of 365 in D1. Trending up strongly 🟢.
- Opp Shooting (Opp Shooting): Currently ranked 215 of 365 in D1. Trending up moderately 🔴.
Omaha
Record: 7-12 | Elo: 1468.2 (ranked 233 of 365) | Efficiency Margin: -11.82 (ranked 265 of 365)
Offensive Trends:
- Turnovers (Turnovers): Currently ranked 214 of 365 in D1. Trending up strongly 🔴.
- Off Reb Pct (Offensive Rebounding): Currently ranked 338 of 365 in D1. Trending down moderately 🔴.
Defensive Trends:
- Opp Shooting (Opp Shooting): Currently ranked 247 of 365 in D1. Trending down strongly 🟢.
- Opp Turnovers (Opp Turnovers): Currently ranked 273 of 365 in D1. Trending up strongly 🟢.
Oral Roberts
Record: 5-17 | Elo: 1311.8 (ranked 362 of 365) | Efficiency Margin: -21.42 (ranked 335 of 365)
Offensive Trends:
- Shooting (Shooting): Currently ranked 285 of 365 in D1. Trending down moderately 🔴.
- Turnovers (Turnovers): Currently ranked 314 of 365 in D1. Trending up moderately 🔴.
Defensive Trends:
- Opp Turnovers (Opp Turnovers): Currently ranked 244 of 365 in D1. Trending down strongly 🔴.
- Opp Shooting (Opp Shooting): Currently ranked 305 of 365 in D1. Trending up moderately 🔴.
South Dakota
Record: 10-11 | Elo: 1450.9 (ranked 250 of 365) | Efficiency Margin: -15.16 (ranked 293 of 365)
Offensive Trends:
- Shooting (Shooting): Currently ranked 202 of 365 in D1. Trending up strongly 🟢.
- Off Reb Pct (Offensive Rebounding): Currently ranked 163 of 365 in D1. Trending down strongly 🔴.
Defensive Trends:
- Opp Shooting (Opp Shooting): Currently ranked 343 of 365 in D1. Trending up moderately 🔴.
- Opp Turnovers (Opp Turnovers): Currently ranked 201 of 365 in D1. Trending down moderately 🔴.
South Dakota St
Record: 10-11 | Elo: 1510.3 (ranked 168 of 365) | Efficiency Margin: -2.32 (ranked 184 of 365)
Offensive Trends:
- Off Reb Pct (Offensive Rebounding): Currently ranked 157 of 365 in D1. Trending down strongly 🔴.
- Shooting (Shooting): Currently ranked 147 of 365 in D1. Trending up moderately 🟢.
Defensive Trends:
- Def Reb Pct (Defensive Rebounding): Currently ranked 89 of 365 in D1. Trending down strongly 🔴.
- Opp Turnovers (Opp Turnovers): Currently ranked 225 of 365 in D1. Trending up moderately 🟢.
St. Thomas – Minnesota
Record: 17-5 | Elo: 1599.6 (ranked 71 of 365) | Efficiency Margin: +3.94 (ranked 126 of 365)
Offensive Trends:
- Turnovers (Turnovers): Currently ranked 37 of 365 in D1. Trending up strongly 🔴.
- Shooting (Shooting): Currently ranked 8 of 365 in D1. Trending up moderately 🟢.
Defensive Trends:
- Opp Turnovers (Opp Turnovers): Currently ranked 82 of 365 in D1. Trending down strongly 🔴.
- Opp Shooting (Opp Shooting): Currently ranked 243 of 365 in D1. Trending down weakly 🟢.
UM Kansas City
Record: 3-17 | Elo: 1327.2 (ranked 357 of 365) | Efficiency Margin: -23.57 (ranked 342 of 365)
Offensive Trends:
- Shooting (Shooting): Currently ranked 328 of 365 in D1. Trending up weakly 🟢.
- Turnovers (Turnovers): Currently ranked 330 of 365 in D1. Trending up weakly 🔴.
Defensive Trends:
- Opp Shooting (Opp Shooting): Currently ranked 338 of 365 in D1. Trending up strongly 🔴.
- Def Reb Pct (Defensive Rebounding): Currently ranked 349 of 365 in D1. Trending down strongly 🔴.
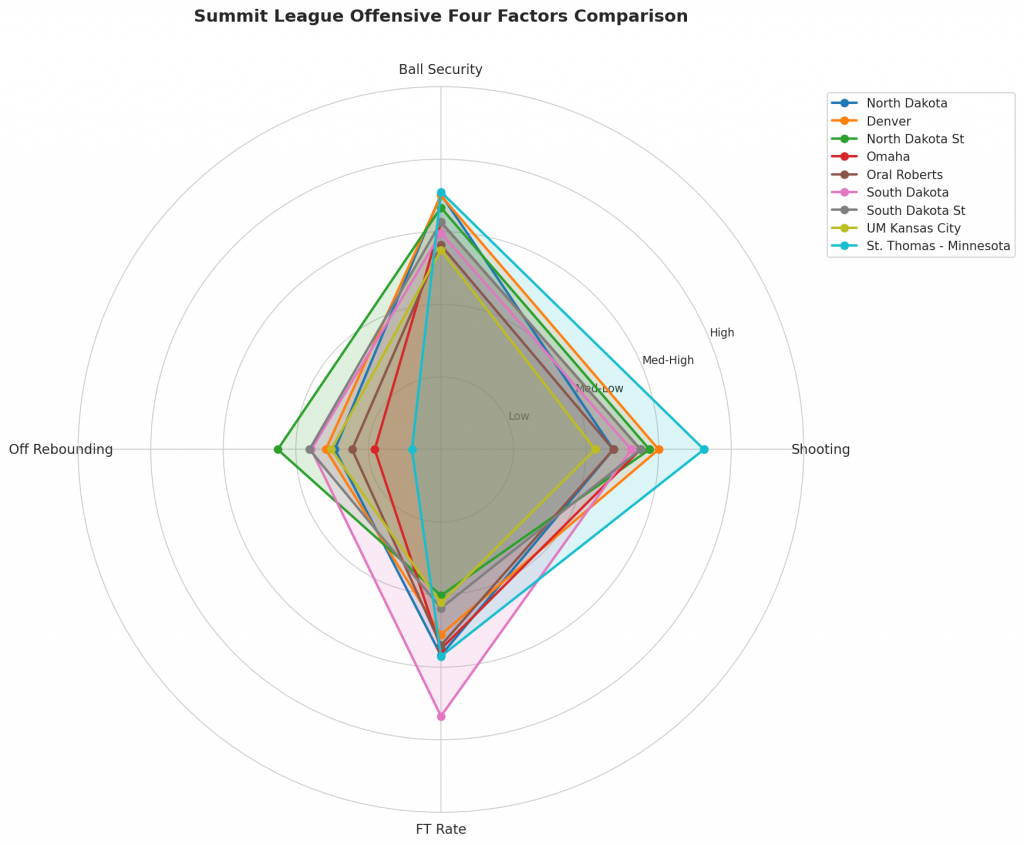
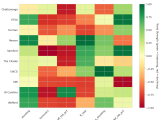
Figure 2: Offensive Four Factors comparison across Summit League teams. The radar chart shows each team’s shooting efficiency (eFG%), ball security (TOV%), offensive rebounding (OREB%), and free throw generation (FT Rate).
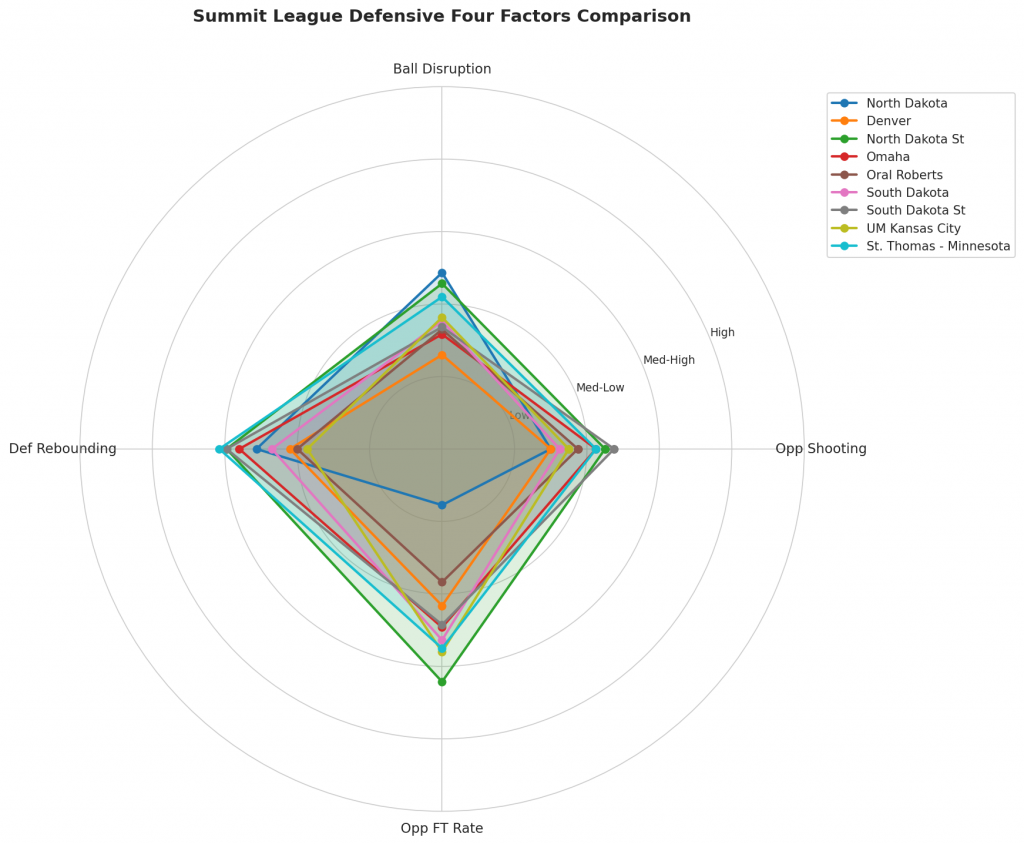
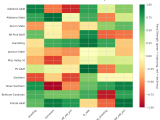
Figure 3: Defensive Four Factors comparison across Summit League teams. The radar chart shows each team’s opponent shooting defense (Opp eFG%), ball disruption (forcing TOV%), defensive rebounding (DREB%), and opponent free throw prevention (Opp FT Rate).
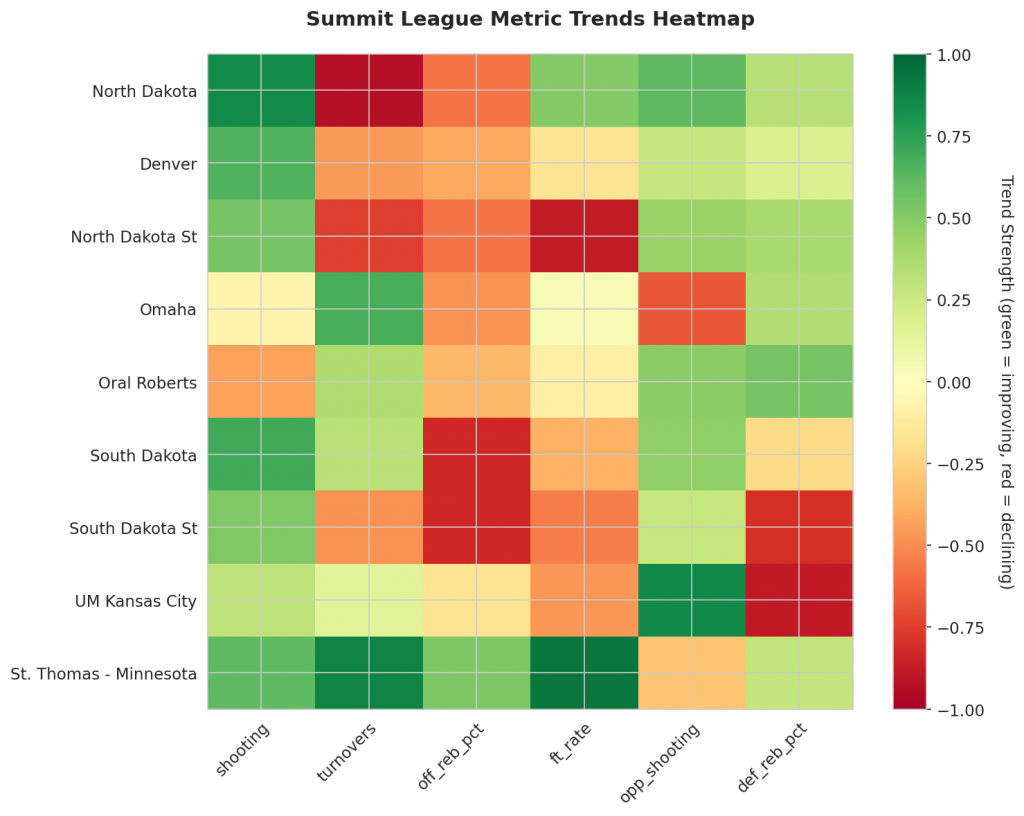
Figure 4: MACD trends heatmap showing which metrics are improving (green) or declining (red) for each team. Stronger colors indicate more pronounced trends.
Looking Ahead
Summit League Teams Show Promising Signs of Improvement
As the Summit League season nears its conclusion, several teams are demonstrating notable improvements in key areas of their game. By analyzing Shooting Efficiency Momentum (SEM) indicators, we can identify which teams are genuinely enhancing their performance and which may be experiencing unsustainable momentum.
Offensive Trends to Watch
North Dakota has been making significant strides on offense, with a strong upward trend in shooting percentages (Season Avg: 0.49, Trend: Up). This improvement is particularly notable given the team’s consistent scoring ability. Meanwhile, Denver has also shown signs of growth, with its shooting percentage trending up strongly (Season Avg: 0.54, Trend: Up).
Defensive Trends to Note
On the defensive side, North Dakota has been excelling at forcing turnovers from opposing teams, with a notable increase in opp turnovers (Season Avg: 0.196, Trend: Up). This bodes well for the team’s chances of success in the latter stages of the season.
Teams on the Rise
North Dakota State’s ability to limit turnovers has also been a key factor in its success, with a significant downward trend in turnover rates (Season Avg: 0.15, Trend: Down).
Metrics Glossary
Four Factors (Dean Oliver’s framework for basketball success):
- eFG% (Effective Field Goal %): Field goal percentage adjusted for 3-pointers being worth more (FGM + 0.5×3PM) / FGA. Higher is better offensively, lower is better defensively.
- TOV% (Turnover Rate): Turnovers per 100 possessions. Lower is better offensively (taking care of the ball), higher is better defensively (forcing turnovers).
- OREB% / DREB% (Offensive/Defensive Rebound Rate): Percentage of available rebounds grabbed. Offensive rebounds create second-chance points; defensive rebounds end opponent possessions.
- FTR (Free Throw Rate): Free throws made per field goal attempt (FTM/FGA). Measures ability to get to the line AND convert. Higher is better offensively, lower is better defensively.
Other Metrics:
- Elo Rating: Chess-style rating system that updates based on game results and opponent strength. Higher Elo indicates stronger team.
- Efficiency Margin: Point differential per 100 possessions (Offensive Efficiency – Defensive Efficiency). Accounts for pace of play.
- MACD (Moving Average Convergence Divergence): Trend indicator comparing 12-game and 26-game exponential moving averages. Positive MACD = improving trend, Negative MACD = declining trend.
Analysis powered by HoopSci’s advanced metrics and MACD trending indicators.