Conference USA Update: Week 15
February 16, 2026Strongest Offensive Trends
Conference USA Week 15 Offense Report
The mid-season mark has arrived in Conference USA, and our analysis reveals several key trends shaping the league’s offense. Here are the top trends to monitor:
• Liberty: Off Reb Pct is Worsening versus stronger competition, a significant problem for their scoring woes.
• New Mexico St’s rebound efficiency versus weaker competition has been hurtful to their paint production.
• FIU’s shooting percentage (35%) is impacting their overall scoring potential versus stronger competition.
• UTEP’s offense is struggling to rebound versus weaker competition.
Strongest Defensive Trends
Conference USA Defensive Trends: Week 15
Our analysis of defensive trends in Conference USA reveals the following key takeaways:
• LA Tech’s Opponent Turnovers struggle versus weaker competition, forcing fewer turnovers and creating challenges for their own defense to control games, which worsens against stronger competition.
• Mid Tennessee’s Opponent Shooting is a problem versus weaker competition, with their opponents shooting worse against them as their value of defense increases versus stronger competition (Negative Trend – Bad).
• UTEP: Opp Turnovers struggle, with their opponents forcing more turnovers and stifling scoring opportunities for UTEP.
• W Kentucky’s Defensive Rebound Percentage is a concern, allowing more offensive boards and putting pressure on their own defense.
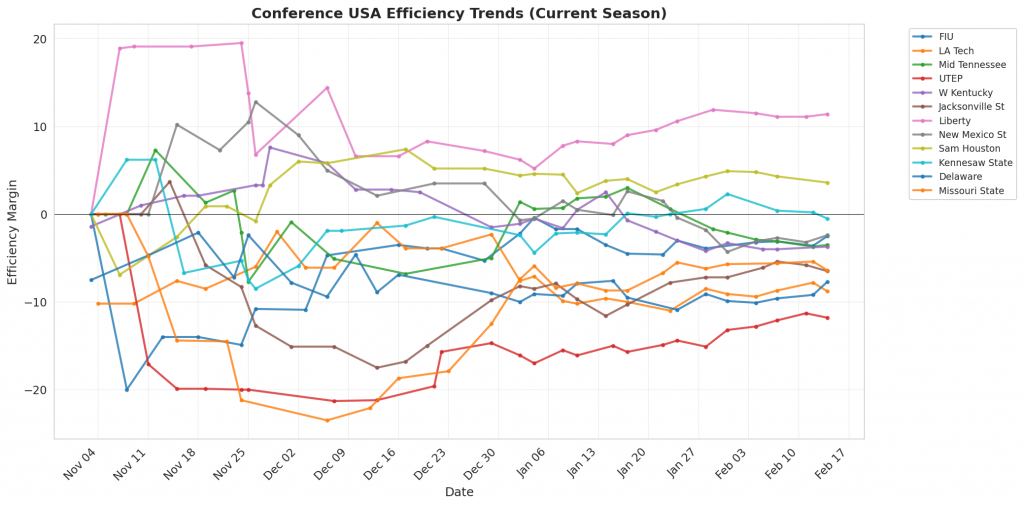
Figure 1: Efficiency margin trends for Conference USA teams throughout the season. Teams trending upward show improving performance, while downward trends indicate struggles.
Conference Snapshot
- Week Dates: February 09 – February 15, 2026
- Trending Up (Efficiency): Mid Tennessee, UTEP, New Mexico St, Sam Houston, Delaware
- Trending Down (Efficiency): FIU, LA Tech, W Kentucky, Jacksonville St, Liberty
Team-by-Team Analysis
Delaware
Record: 9-15 | Elo: 1451.7 (ranked 249 of 365) | Efficiency Margin: -7.71 (ranked 230 of 365)
Offensive Trends:
- Shooting (Shooting): Currently ranked 96 of 365 in D1. Trending up moderately 🟢.
- Off Reb Pct (Offensive Rebounding): Currently ranked 362 of 365 in D1. Trending down moderately 🔴.
Defensive Trends:
- Opp Turnovers (Opp Turnovers): Currently ranked 336 of 365 in D1. Trending down moderately 🔴.
- Opp Shooting (Opp Shooting): Currently ranked 138 of 365 in D1. Trending down weakly 🟢.
FIU
Record: 12-13 | Elo: 1413.0 (ranked 292 of 365) | Efficiency Margin: -2.48 (ranked 187 of 365)
Offensive Trends:
- Shooting (Shooting): Currently ranked 208 of 365 in D1. Trending down weakly 🔴.
- Turnovers (Turnovers): Currently ranked 249 of 365 in D1. Trending up weakly 🔴.
Defensive Trends:
- Def Reb Pct (Defensive Rebounding): Currently ranked 322 of 365 in D1. Trending up moderately 🟢.
- Opp Shooting (Opp Shooting): Currently ranked 228 of 365 in D1. Trending down weakly 🟢.
Jacksonville St
Record: 13-12 | Elo: 1502.5 (ranked 178 of 365) | Efficiency Margin: -6.51 (ranked 218 of 365)
Offensive Trends:
- Off Reb Pct (Offensive Rebounding): Currently ranked 185 of 365 in D1. Trending down strongly 🔴.
- Turnovers (Turnovers): Currently ranked 193 of 365 in D1. Trending down moderately 🟢.
Defensive Trends:
- Opp Shooting (Opp Shooting): Currently ranked 81 of 365 in D1. Trending down weakly 🟢.
- Opp Turnovers (Opp Turnovers): Currently ranked 276 of 365 in D1. Trending up weakly 🟢.
Kennesaw State
Record: 14-11 | Elo: 1500.6 (ranked 180 of 365) | Efficiency Margin: -0.49 (ranked 164 of 365)
Offensive Trends:
- Turnovers (Turnovers): Currently ranked 215 of 365 in D1. Trending down strongly 🟢.
- Off Reb Pct (Offensive Rebounding): Currently ranked 43 of 365 in D1. Trending down strongly 🔴.
Defensive Trends:
- Opp Shooting (Opp Shooting): Currently ranked 91 of 365 in D1. Trending up strongly 🔴.
- Def Reb Pct (Defensive Rebounding): Currently ranked 80 of 365 in D1. Trending down moderately 🔴.
LA Tech
Record: 14-11 | Elo: 1528.2 (ranked 141 of 365) | Efficiency Margin: -8.77 (ranked 244 of 365)
Offensive Trends:
- Shooting (Shooting): Currently ranked 348 of 365 in D1. Trending down moderately 🔴.
- Turnovers (Turnovers): Currently ranked 234 of 365 in D1. Trending up moderately 🔴.
Defensive Trends:
- Opp Turnovers (Opp Turnovers): Currently ranked 164 of 365 in D1. Trending up strongly 🟢.
- Def Reb Pct (Defensive Rebounding): Currently ranked 207 of 365 in D1. Trending down strongly 🔴.
Liberty
Record: 22-3 | Elo: 1704.8 (ranked 19 of 365) | Efficiency Margin: +11.38 (ranked 72 of 365)
Offensive Trends:
- Off Reb Pct (Offensive Rebounding): Currently ranked 365 of 365 in D1. Trending down strongly 🔴.
- Turnovers (Turnovers): Currently ranked 10 of 365 in D1. Trending down moderately 🟢.
Defensive Trends:
- Opp Shooting (Opp Shooting): Currently ranked 213 of 365 in D1. Trending up strongly 🔴.
- Def Reb Pct (Defensive Rebounding): Currently ranked 187 of 365 in D1. Trending up strongly 🟢.
Mid Tennessee
Record: 11-13 | Elo: 1506.7 (ranked 174 of 365) | Efficiency Margin: -3.47 (ranked 194 of 365)
Offensive Trends:
- Shooting (Shooting): Currently ranked 167 of 365 in D1. Trending up moderately 🟢.
- Off Reb Pct (Offensive Rebounding): Currently ranked 218 of 365 in D1. Trending down moderately 🔴.
Defensive Trends:
- Opp Shooting (Opp Shooting): Currently ranked 184 of 365 in D1. Trending up strongly 🔴.
- Def Reb Pct (Defensive Rebounding): Currently ranked 101 of 365 in D1. Trending up moderately 🟢.
Missouri State
Record: 12-12 | Elo: 1435.6 (ranked 265 of 365) | Efficiency Margin: -6.36 (ranked 217 of 365)
Offensive Trends:
- Shooting (Shooting): Currently ranked 237 of 365 in D1. Trending down moderately 🔴.
- Turnovers (Turnovers): Currently ranked 212 of 365 in D1. Trending down moderately 🟢.
Defensive Trends:
- Def Reb Pct (Defensive Rebounding): Currently ranked 230 of 365 in D1. Trending up strongly 🟢.
- Opp Shooting (Opp Shooting): Currently ranked 201 of 365 in D1. Trending up moderately 🔴.
New Mexico St
Record: 12-13 | Elo: 1469.0 (ranked 225 of 365) | Efficiency Margin: -2.36 (ranked 185 of 365)
Offensive Trends:
- Off Reb Pct (Offensive Rebounding): Currently ranked 105 of 365 in D1. Trending down strongly 🔴.
- Shooting (Shooting): Currently ranked 258 of 365 in D1. Trending up weakly 🟢.
Defensive Trends:
- Opp Turnovers (Opp Turnovers): Currently ranked 337 of 365 in D1. Trending down strongly 🔴.
- Opp Shooting (Opp Shooting): Currently ranked 82 of 365 in D1. Trending up weakly 🔴.
Sam Houston
Record: 17-8 | Elo: 1571.7 (ranked 87 of 365) | Efficiency Margin: +3.58 (ranked 123 of 365)
Offensive Trends:
- Off Reb Pct (Offensive Rebounding): Currently ranked 84 of 365 in D1. Trending down strongly 🔴.
- Shooting (Shooting): Currently ranked 116 of 365 in D1. Trending up moderately 🟢.
Defensive Trends:
- Def Reb Pct (Defensive Rebounding): Currently ranked 191 of 365 in D1. Trending down strongly 🔴.
- Opp Shooting (Opp Shooting): Currently ranked 135 of 365 in D1. Trending down moderately 🟢.
UTEP
Record: 10-16 | Elo: 1445.6 (ranked 256 of 365) | Efficiency Margin: -11.78 (ranked 270 of 365)
Offensive Trends:
- Off Reb Pct (Offensive Rebounding): Currently ranked 288 of 365 in D1. Trending down strongly 🔴.
- Shooting (Shooting): Currently ranked 308 of 365 in D1. Trending up moderately 🟢.
Defensive Trends:
- Opp Turnovers (Opp Turnovers): Currently ranked 91 of 365 in D1. Trending down strongly 🔴.
- Opp Shooting (Opp Shooting): Currently ranked 223 of 365 in D1. Trending down moderately 🟢.
W Kentucky
Record: 14-11 | Elo: 1506.7 (ranked 173 of 365) | Efficiency Margin: -3.66 (ranked 196 of 365)
Offensive Trends:
- Shooting (Shooting): Currently ranked 353 of 365 in D1. Trending down moderately 🔴.
- Off Reb Pct (Offensive Rebounding): Currently ranked 115 of 365 in D1. Trending down moderately 🔴.
Defensive Trends:
- Def Reb Pct (Defensive Rebounding): Currently ranked 95 of 365 in D1. Trending down moderately 🔴.
- Opp Shooting (Opp Shooting): Currently ranked 143 of 365 in D1. Trending down weakly 🟢.
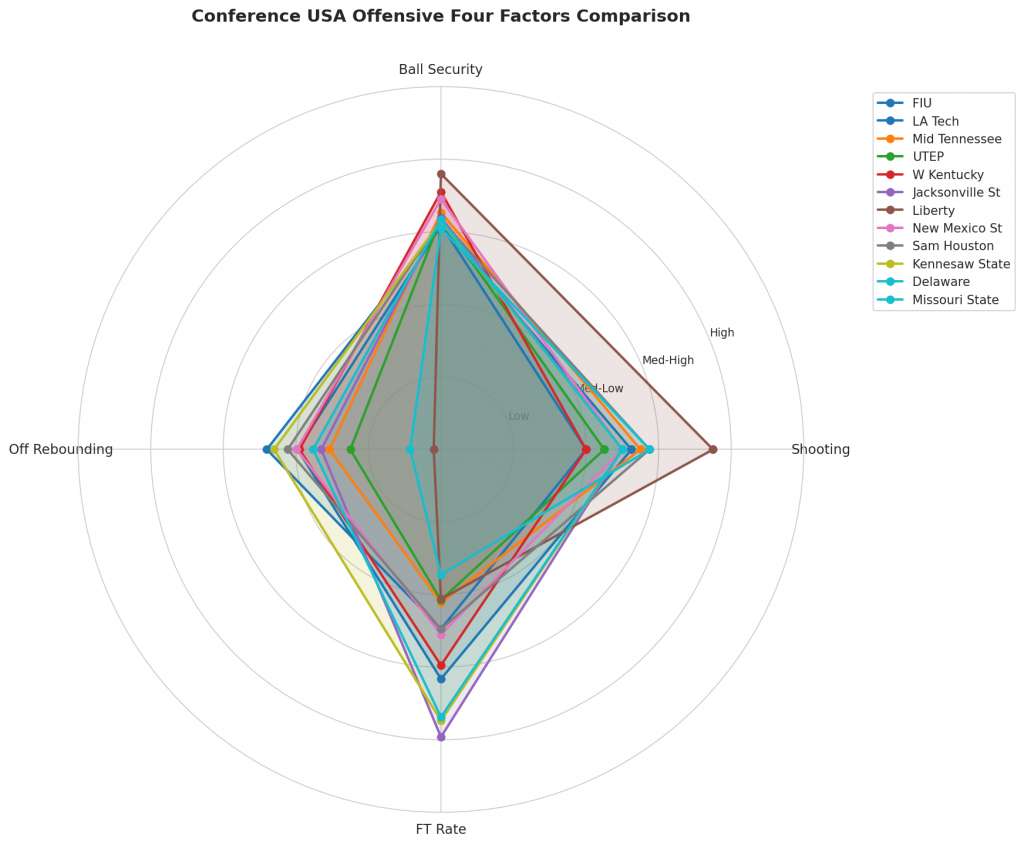
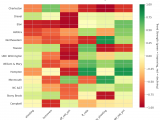
Figure 2: Offensive Four Factors comparison across Conference USA teams. The radar chart shows each team’s shooting efficiency (eFG%), ball security (TOV%), offensive rebounding (OREB%), and free throw generation (FT Rate).
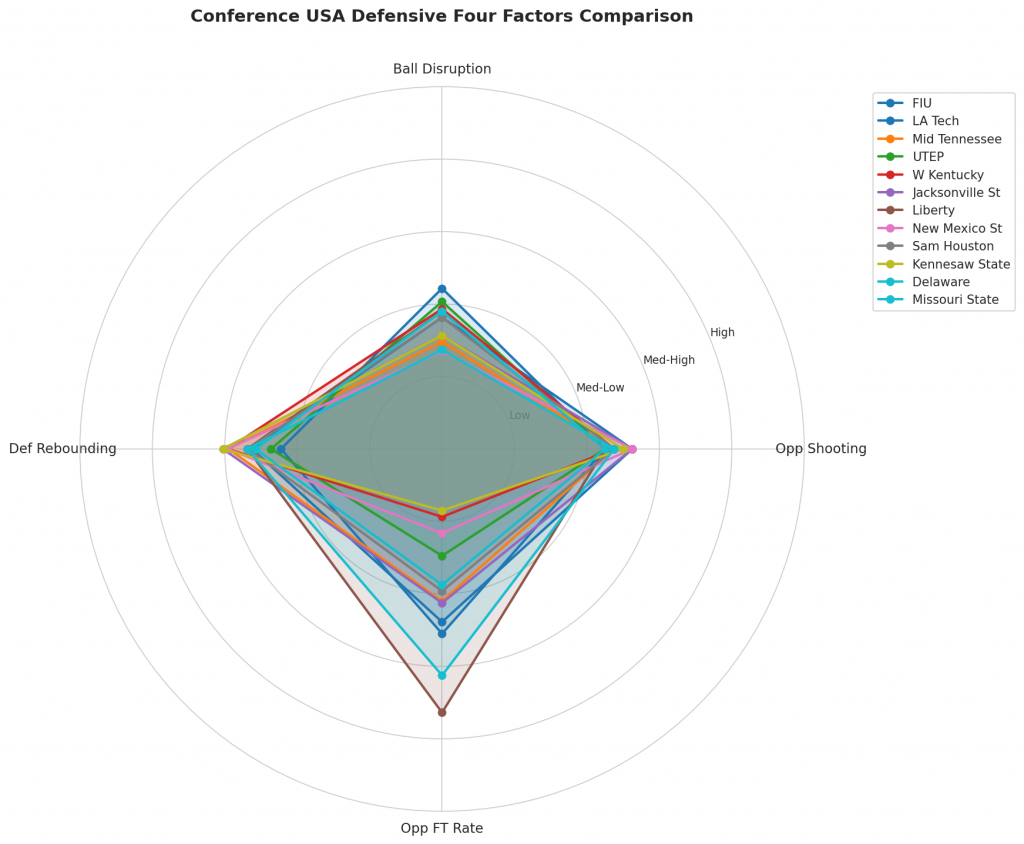
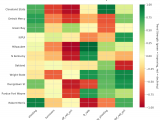
Figure 3: Defensive Four Factors comparison across Conference USA teams. The radar chart shows each team’s opponent shooting defense (Opp eFG%), ball disruption (forcing TOV%), defensive rebounding (DREB%), and opponent free throw prevention (Opp FT Rate).
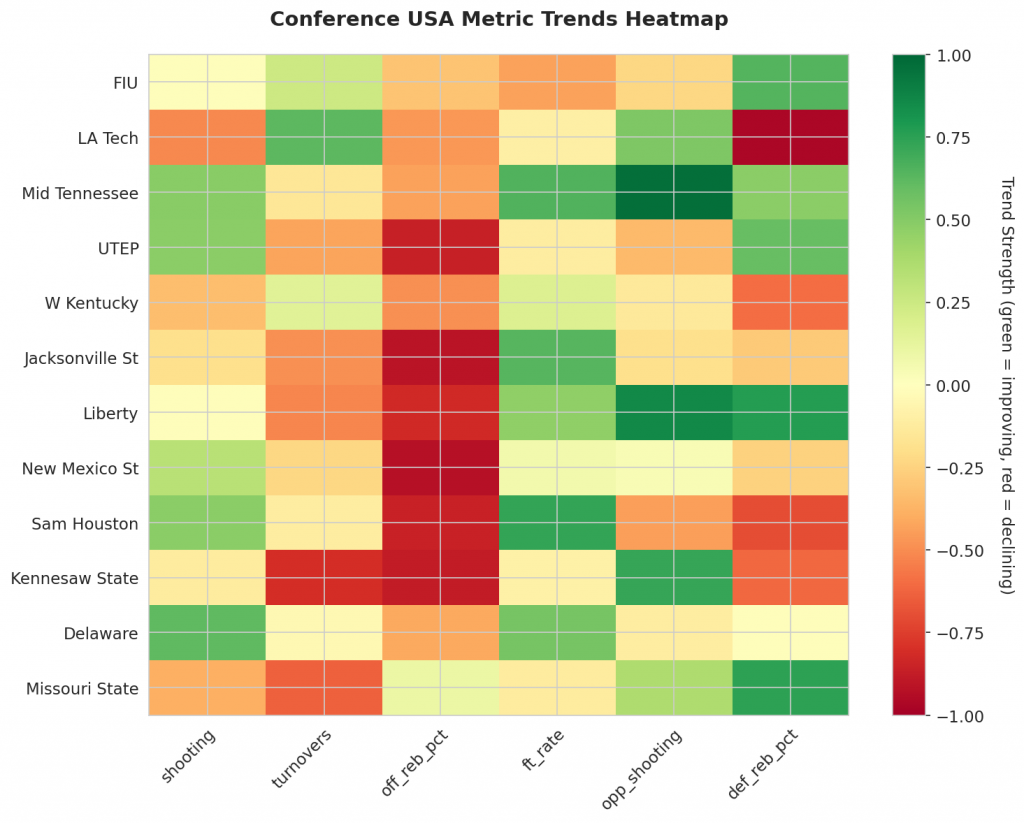
Figure 4: MACD trends heatmap showing which metrics are improving (green) or declining (red) for each team. Stronger colors indicate more pronounced trends.
Looking Ahead
Conference USA Week 15 Review: Key Trends and Momentum
A closer look at the momentum indicators reveals some notable trends in offense and defense for Conference USA teams.
On the offensive end, Liberty’s rebounding percentage has worsened versus weaker competition. Meanwhile, UTEP is struggling on the glass, with a worsening trend in offense rebounding percentage down to 0.25 versus stronger competition. New Mexico St also faces challenges, with a declining trend in rebounding percentage versus stronger competition.
In contrast, LA Tech’s ability to force turnovers has improved versus weaker competition, up from its season average of 0.159. However, they have been allowing more offensive boards versus weaker competition, with a decline in defensive rebounding percentage down to 0.71. Mid Tennessee’s defense is facing challenges versus stronger competition, with an upward trend in opponents’ shooting above its season average.
These trends will be crucial for teams looking to make a push towards the end of the season. Next week, we’ll take a deeper dive into updated analysis and see how these momentum indicators continue to shape Conference USA’s fortunes.
Metrics Glossary
Four Factors (Dean Oliver’s framework for basketball success):
- eFG% (Effective Field Goal %): Field goal percentage adjusted for 3-pointers being worth more (FGM + 0.5×3PM) / FGA. Higher is better offensively, lower is better defensively.
- TOV% (Turnover Rate): Turnovers per 100 possessions. Lower is better offensively (taking care of the ball), higher is better defensively (forcing turnovers).
- OREB% / DREB% (Offensive/Defensive Rebound Rate): Percentage of available rebounds grabbed. Offensive rebounds create second-chance points; defensive rebounds end opponent possessions.
- FTR (Free Throw Rate): Free throws made per field goal attempt (FTM/FGA). Measures ability to get to the line AND convert. Higher is better offensively, lower is better defensively.
Other Metrics:
- Elo Rating: Chess-style rating system that updates based on game results and opponent strength. Higher Elo indicates stronger team.
- Efficiency Margin: Point differential per 100 possessions (Offensive Efficiency – Defensive Efficiency). Accounts for pace of play.
- MACD (Moving Average Convergence Divergence): Trend indicator comparing 12-game and 26-game exponential moving averages. Positive MACD = improving trend, Negative MACD = declining trend.
Analysis powered by HoopSci’s advanced metrics and MACD trending indicators.