Mid-American Update: Week 16
February 24, 2026Strongest Offensive Trends
- Buffalo, Off Reb Pct, Down, Trend Strength: -0.029 – Buffalo struggles with defensive rebounding, hindering their ability to maintain possession and capitalize on scoring opportunities.
- Bowling Green, Off Reb Pct, Down, Trend Strength: -0.027 – Bowling Green’s inability to secure rebounds on offense has been a persistent problem throughout their season, hindering their ability to maintain possession and create scoring opportunities.
- Ball State, Off Reb Pct, Down, Trend Strength: -0.017 – Ball State’s inconsistent rebounding has become a significant problem, as it prevents the team from capitalizing on its scoring opportunities and creates difficulties in maintaining possession of the ball.
- Cent Michigan, Shooting, Up, Trend Strength: 0.015 – Cent Michigan’s shooting has been a significant contributor to their overall performance, with accuracy in mid-range shots and clutch free throws proving crucial during key moments in games this season.
- Akron, Shooting, Down, Trend Strength: -0.013 – Akron’s inconsistent shooting has proven to be a significant issue on offense, contributing to their struggles in scoring effectively.
Strongest Defensive Trends
- Cent Michigan, Opp Shooting, Down, Trend Strength: -0.018 – Cent Michigan’s opponents have been shooting more effectively from three-point range, posing a problem for the team that could lead to defensive difficulties if they fail to adapt.
- Akron, Def Reb Pct, Up, Trend Strength: 0.016 – Akron’s inability to secure rebounds on defensive boards is a significant problem, stifling opponents’ scoring chances by limiting their field goal opportunities.
- Cent Michigan, Opp Turnovers, Up, Trend Strength: 0.011 – Cent Michigan’s defense has shown a marked improvement in their performance, allowing them to pose a significant challenge for opposing offenses.
- Buffalo, Opp Shooting, Up, Trend Strength: 0.01 – The Buffalo defense has struggled to contain opponents’ three-point shooting, a weakness that has contributed to its overall defensive performance issues throughout the season.
- Bowling Green, Opp Turnovers, Down, Trend Strength: -0.008 – Bowling Green’s inability to force turnovers against opponents like Toledo and Kent State has allowed them to maintain possession and exploit scoring opportunities, exacerbating the team’s defensive struggles.
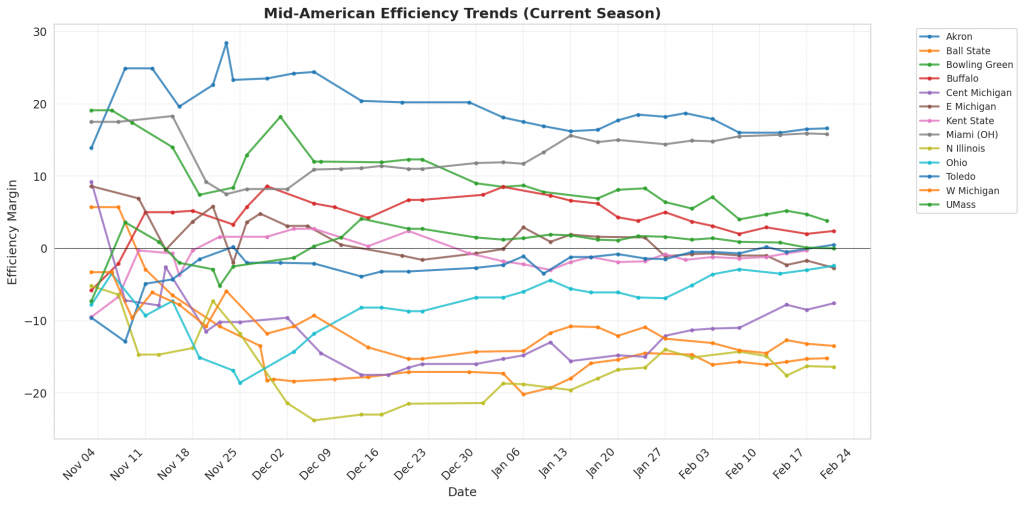
Figure 1: Efficiency margin trends for Mid-American teams throughout the season. Teams trending upward show improving performance, while downward trends indicate struggles.
Conference Snapshot
- Week Dates: February 16 – February 22, 2026
- Trending Up (Efficiency): Buffalo, Cent Michigan, E Michigan, Miami (OH), N Illinois
- Trending Down (Efficiency): Akron, Ball State, Bowling Green, Kent State, Ohio
Team-by-Team Analysis
Akron
Record: 22-5 | Elo: 1687.6 (ranked 27 of 365) | Efficiency Margin: +16.60 (ranked 44 of 365)
Offensive Trends:
- Shooting (Shooting): Currently ranked 11 of 365 in D1. Trending down strongly 🔴.
- Turnovers (Turnovers): Currently ranked 80 of 365 in D1. Trending down moderately 🟢.
Defensive Trends:
- Def Reb Pct (Defensive Rebounding): Currently ranked 183 of 365 in D1. Trending up strongly 🟢.
- Opp Shooting (Opp Shooting): Currently ranked 180 of 365 in D1. Trending up weakly 🔴.
Ball State
Record: 8-19 | Elo: 1372.9 (ranked 326 of 365) | Efficiency Margin: -15.24 (ranked 299 of 365)
Offensive Trends:
- Off Reb Pct (Offensive Rebounding): Currently ranked 324 of 365 in D1. Trending down strongly 🔴.
- Shooting (Shooting): Currently ranked 352 of 365 in D1. Trending down moderately 🔴.
Defensive Trends:
- Opp Shooting (Opp Shooting): Currently ranked 290 of 365 in D1. Trending down moderately 🟢.
- Opp Turnovers (Opp Turnovers): Currently ranked 69 of 365 in D1. Trending down weakly 🔴.
Bowling Green
Record: 16-12 | Elo: 1473.2 (ranked 222 of 365) | Efficiency Margin: +3.79 (ranked 126 of 365)
Offensive Trends:
- Off Reb Pct (Offensive Rebounding): Currently ranked 246 of 365 in D1. Trending down strongly 🔴.
- Shooting (Shooting): Currently ranked 156 of 365 in D1. Trending down moderately 🔴.
Defensive Trends:
- Opp Turnovers (Opp Turnovers): Currently ranked 44 of 365 in D1. Trending down strongly 🔴.
- Opp Shooting (Opp Shooting): Currently ranked 141 of 365 in D1. Trending up weakly 🔴.
Buffalo
Record: 16-11 | Elo: 1435.5 (ranked 268 of 365) | Efficiency Margin: +2.45 (ranked 133 of 365)
Offensive Trends:
- Off Reb Pct (Offensive Rebounding): Currently ranked 260 of 365 in D1. Trending down strongly 🔴.
- Shooting (Shooting): Currently ranked 31 of 365 in D1. Trending up weakly 🟢.
Defensive Trends:
- Opp Shooting (Opp Shooting): Currently ranked 300 of 365 in D1. Trending up strongly 🔴.
- Opp Turnovers (Opp Turnovers): Currently ranked 120 of 365 in D1. Trending up moderately 🟢.
Cent Michigan
Record: 9-18 | Elo: 1395.4 (ranked 307 of 365) | Efficiency Margin: -7.63 (ranked 234 of 365)
Offensive Trends:
- Shooting (Shooting): Currently ranked 186 of 365 in D1. Trending up strongly 🟢.
- Off Reb Pct (Offensive Rebounding): Currently ranked 213 of 365 in D1. Trending down strongly 🔴.
Defensive Trends:
- Opp Shooting (Opp Shooting): Currently ranked 272 of 365 in D1. Trending down strongly 🟢.
- Opp Turnovers (Opp Turnovers): Currently ranked 190 of 365 in D1. Trending up strongly 🟢.
E Michigan
Record: 10-18 | Elo: 1405.8 (ranked 301 of 365) | Efficiency Margin: -2.66 (ranked 189 of 365)
Offensive Trends:
- Off Reb Pct (Offensive Rebounding): Currently ranked 258 of 365 in D1. Trending down strongly 🔴.
- Turnovers (Turnovers): Currently ranked 266 of 365 in D1. Trending up moderately 🔴.
Defensive Trends:
- Opp Turnovers (Opp Turnovers): Currently ranked 253 of 365 in D1. Trending down strongly 🔴.
- Opp Shooting (Opp Shooting): Currently ranked 124 of 365 in D1. Trending up moderately 🔴.
Kent State
Record: 20-7 | Elo: 1623.8 (ranked 56 of 365) | Efficiency Margin: -0.27 (ranked 163 of 365)
Offensive Trends:
- Shooting (Shooting): Currently ranked 164 of 365 in D1. Trending down strongly 🔴.
- Off Reb Pct (Offensive Rebounding): Currently ranked 44 of 365 in D1. Trending down strongly 🔴.
Defensive Trends:
- Opp Shooting (Opp Shooting): Currently ranked 188 of 365 in D1. Trending down strongly 🟢.
- Opp Turnovers (Opp Turnovers): Currently ranked 229 of 365 in D1. Trending down weakly 🔴.
Miami (OH)
Record: 27-0 | Elo: 1696.0 (ranked 22 of 365) | Efficiency Margin: +15.79 (ranked 49 of 365)
Offensive Trends:
- Off Reb Pct (Offensive Rebounding): Currently ranked 326 of 365 in D1. Trending down strongly 🔴.
- Turnovers (Turnovers): Currently ranked 63 of 365 in D1. Trending down moderately 🟢.
Defensive Trends:
- Opp Shooting (Opp Shooting): Currently ranked 143 of 365 in D1. Trending up moderately 🔴.
- Opp Turnovers (Opp Turnovers): Currently ranked 73 of 365 in D1. Trending down weakly 🔴.
N Illinois
Record: 9-17 | Elo: 1342.9 (ranked 347 of 365) | Efficiency Margin: -16.38 (ranked 306 of 365)
Offensive Trends:
- Off Reb Pct (Offensive Rebounding): Currently ranked 157 of 365 in D1. Trending down strongly 🔴.
- Turnovers (Turnovers): Currently ranked 356 of 365 in D1. Trending up moderately 🔴.
Defensive Trends:
- Def Reb Pct (Defensive Rebounding): Currently ranked 189 of 365 in D1. Trending up strongly 🟢.
- Opp Turnovers (Opp Turnovers): Currently ranked 175 of 365 in D1. Trending down moderately 🔴.
Ohio
Record: 15-13 | Elo: 1507.0 (ranked 178 of 365) | Efficiency Margin: -2.35 (ranked 186 of 365)
Offensive Trends:
- Turnovers (Turnovers): Currently ranked 93 of 365 in D1. Trending down strongly 🟢.
- Off Reb Pct (Offensive Rebounding): Currently ranked 239 of 365 in D1. Trending down strongly 🔴.
Defensive Trends:
- Def Reb Pct (Defensive Rebounding): Currently ranked 286 of 365 in D1. Trending up strongly 🟢.
- Opp Shooting (Opp Shooting): Currently ranked 232 of 365 in D1. Trending up weakly 🔴.
Toledo
Record: 14-13 | Elo: 1518.2 (ranked 154 of 365) | Efficiency Margin: +0.49 (ranked 157 of 365)
Offensive Trends:
- Shooting (Shooting): Currently ranked 73 of 365 in D1. Trending up strongly 🟢.
- Off Reb Pct (Offensive Rebounding): Currently ranked 228 of 365 in D1. Trending down strongly 🔴.
Defensive Trends:
- Opp Shooting (Opp Shooting): Currently ranked 310 of 365 in D1. Trending down strongly 🟢.
- Opp Turnovers (Opp Turnovers): Currently ranked 81 of 365 in D1. Trending down moderately 🔴.
UMass
Record: 15-13 | Elo: 1441.7 (ranked 256 of 365) | Efficiency Margin: -0.01 (ranked 160 of 365)
Offensive Trends:
- Shooting (Shooting): Currently ranked 86 of 365 in D1. Trending up strongly 🟢.
- Off Reb Pct (Offensive Rebounding): Currently ranked 117 of 365 in D1. Trending down strongly 🔴.
Defensive Trends:
- Opp Shooting (Opp Shooting): Currently ranked 264 of 365 in D1. Trending up strongly 🔴.
- Opp Turnovers (Opp Turnovers): Currently ranked 133 of 365 in D1. Trending down strongly 🔴.
W Michigan
Record: 9-18 | Elo: 1384.9 (ranked 317 of 365) | Efficiency Margin: -13.52 (ranked 284 of 365)
Offensive Trends:
- Turnovers (Turnovers): Currently ranked 160 of 365 in D1. Trending down strongly 🟢.
- Off Reb Pct (Offensive Rebounding): Currently ranked 193 of 365 in D1. Trending down strongly 🔴.
Defensive Trends:
- Opp Turnovers (Opp Turnovers): Currently ranked 344 of 365 in D1. Trending down strongly 🔴.
- Opp Shooting (Opp Shooting): Currently ranked 309 of 365 in D1. Trending up moderately 🔴.
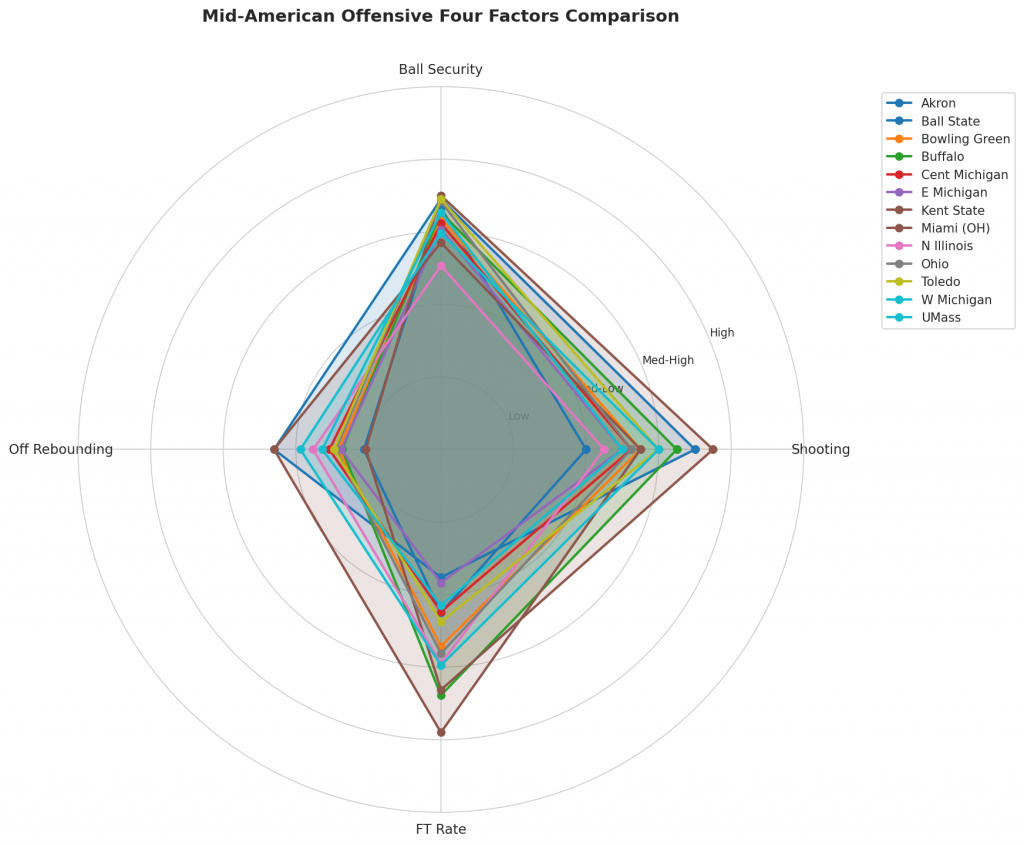
Figure 2: Offensive Four Factors comparison across Mid-American teams. The radar chart shows each team’s shooting efficiency (eFG%), ball security (TOV%), offensive rebounding (OREB%), and free throw generation (FT Rate).
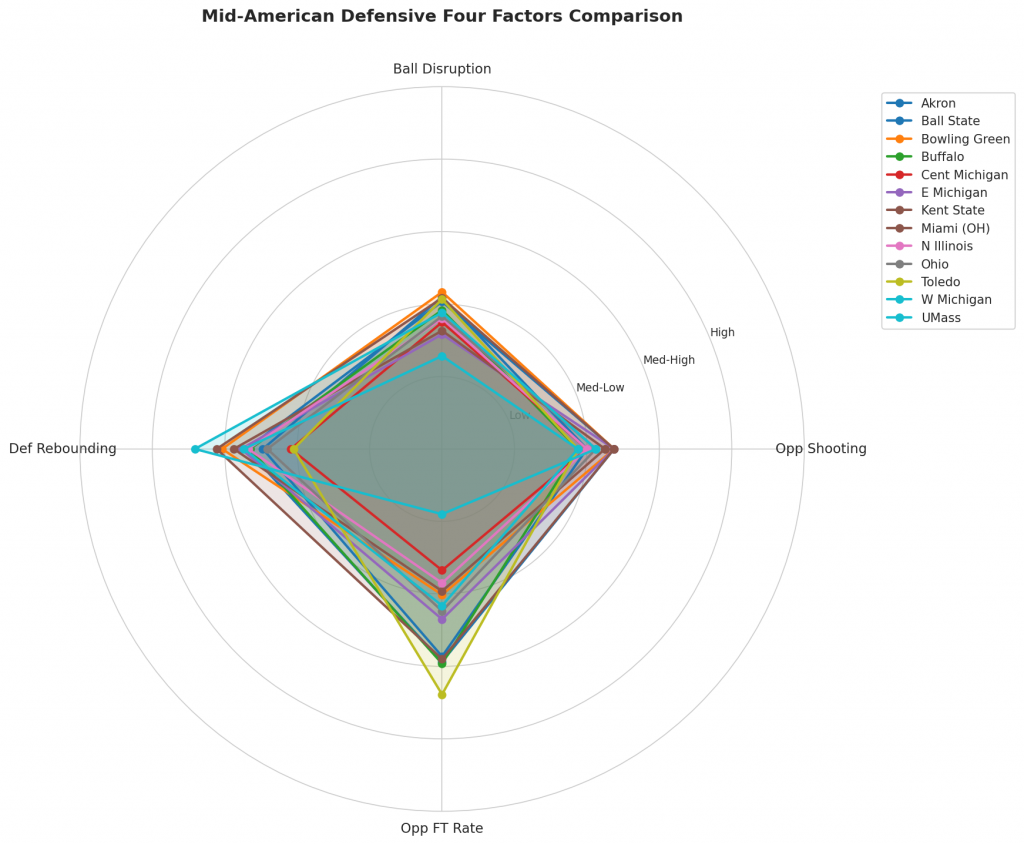
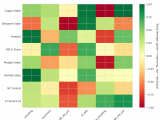
Figure 3: Defensive Four Factors comparison across Mid-American teams. The radar chart shows each team’s opponent shooting defense (Opp eFG%), ball disruption (forcing TOV%), defensive rebounding (DREB%), and opponent free throw prevention (Opp FT Rate).
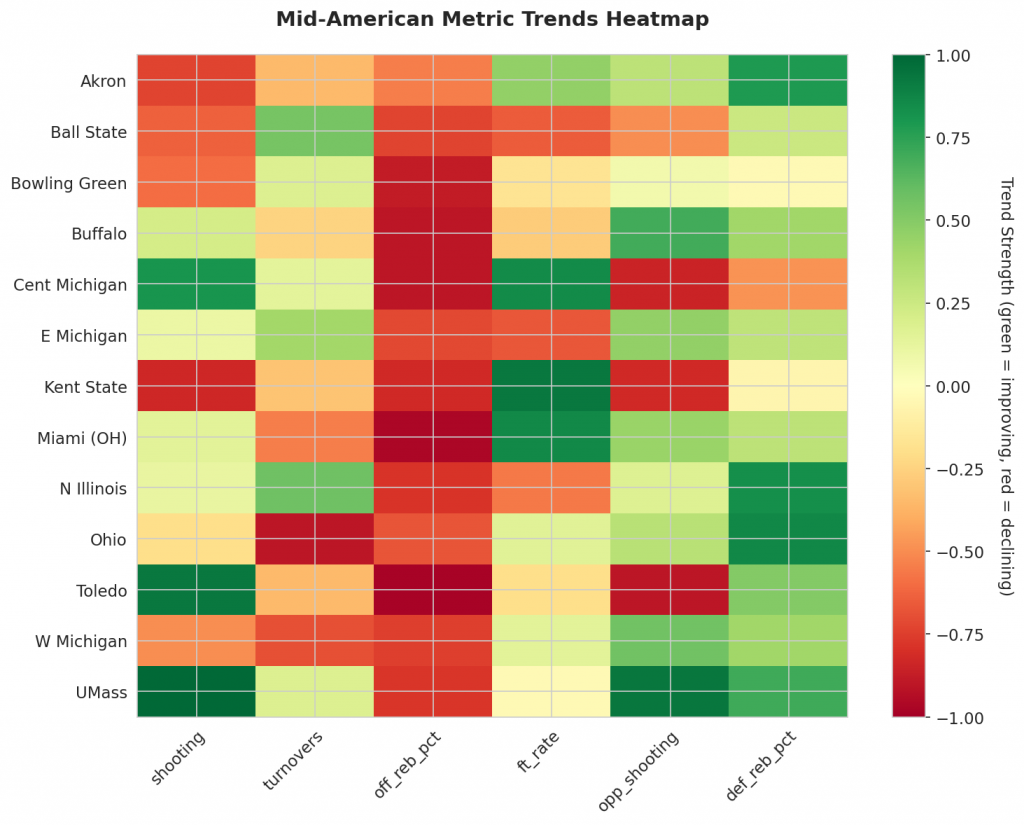
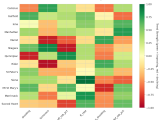
Figure 4: MACD trends heatmap showing which metrics are improving (green) or declining (red) for each team. Stronger colors indicate more pronounced trends.
Looking Ahead
Mid-American Teams Show Mixed Results in Week 16 Analysis
The Mid-American Conference (MAC) has seen varying degrees of success among its teams, with some experiencing upticks and others facing declines. Using specific data-driven metrics, we analyze the key offensive and defensive trends to understand which teams are genuinely improving and which are struggling.
Offensive Trends: Declines Across the Board
A closer look at the data reveals a concerning trend for several top performers in the league. Akron’s shooting has worsened, with their season average dropping as their trend down strengthens. Ball State is struggling to secure second-chance opportunities, as indicated by their declining offensive rebound percentage (ORPct).
- Akron: Shooting (Season Avg: 0.58, Trend: Down, Strength: Strongly) – The team’s shooting percentage has struggled in recent weeks.
- Ball State: Off Reb Pct (Season Avg: 0.235, Trend: Down, Strength: Strongly) – Ball State is facing difficulties in securing offensive rebounds.
- Bowling Green: Off Reb Pct (Season Avg: 0.263, Trend: Down, Strength: Strongly) – Bowling Green’s inability to secure second-chance opportunities has become a significant concern.
- Buffalo: Off Reb Pct (Season Avg: 0.259, Trend: Down, Strength: Strongly) – Buffalo is struggling in this area.
Defensive Trends: Some Glimmers of Improvement
While the offense has struggled for some teams, others have shown promise on defense. Akron’s defensive rebound percentage has seen an improvement, with their trend up strongly indicating a growing ability to secure boards.
- Akron: Def Reb Pct (Season Avg: 0.716, Trend: Up, Strength: Strongly) – The team’s improved defensive rebounding skills are a welcome development.
- Buffalo: Opp Shooting (Season Avg: 0.55, Trend: Up, Strength: Strongly) – Buffalo’s defensive efforts have paid off in recent weeks.
The data paints a complex picture of the Mid-American teams, with both positive and negative trends emerging in Week 16 analysis. As we continue to monitor these developments, it will be essential to assess how these trends shape the teams’ overall performance throughout the season.
Metrics Glossary
Four Factors (Dean Oliver’s framework for basketball success):
- eFG% (Effective Field Goal %): Field goal percentage adjusted for 3-pointers being worth more (FGM + 0.5×3PM) / FGA. Higher is better offensively, lower is better defensively.
- TOV% (Turnover Rate): Turnovers per 100 possessions. Lower is better offensively (taking care of the ball), higher is better defensively (forcing turnovers).
- OREB% / DREB% (Offensive/Defensive Rebound Rate): Percentage of available rebounds grabbed. Offensive rebounds create second-chance points; defensive rebounds end opponent possessions.
- FTR (Free Throw Rate): Free throws made per field goal attempt (FTM/FGA). Measures ability to get to the line AND convert. Higher is better offensively, lower is better defensively.
Other Metrics:
- Elo Rating: Chess-style rating system that updates based on game results and opponent strength. Higher Elo indicates stronger team.
- Efficiency Margin: Point differential per 100 possessions (Offensive Efficiency – Defensive Efficiency). Accounts for pace of play.
- MACD (Moving Average Convergence Divergence): Trend indicator comparing 12-game and 26-game exponential moving averages. Positive MACD = improving trend, Negative MACD = declining trend.
Analysis powered by HoopSci’s advanced metrics and MACD trending indicators.