Mountain West Update: Week 1
November 9, 2026Strongest Offensive Trends
- Air Force, Off Reb Pct, Up, Trend Strength: 0.073 – Air Force has shown a marked improvement in its ability to secure rebounds following possession, a positive development that bolsters its overall playstyle early in the season.
- San Jose State, Shooting, Up, Trend Strength: 0.023 – San Jose State has demonstrated an upward trajectory in shooting performance, contributing to enhanced offensive efficiency across its early-season games.
- Air Force, Shooting, Down, Trend Strength: -0.016 – Air Force is grappling with a troubling dip in shooting accuracy that stands to significantly hamper their offensive production early in the season.
- Air Force, Turnovers, Down, Trend Strength: -0.016 – Air Force has demonstrated clear progress in ball security, as their reduction in turnovers is now serving to enhance overall offensive efficiency.
- New Mexico, Turnovers, Down, Trend Strength: -0.01 – The Lobos are showing improved ball security which is helping drive better offensive production.
Strongest Defensive Trends
- Air Force, Def Reb Pct, Down, Trend Strength: -0.022 – Air Force is facing challenges with its defensive rebounding performance as the unit struggles to control the glass, thereby surrendering additional opportunities for opponents to generate second-chance points.
- Wyoming, Def Reb Pct, Down, Trend Strength: -0.02 – As Wyoming enters the season, a troubling pattern has emerged where the inability to protect the defensive glass translates directly into giving away second-chance opportunities to opposing squads.
- Grand Canyon, Def Reb Pct, Up, Trend Strength: 0.018 – Grand Canyon is showing positive movement by grabbing more defensive boards, indicating a steady improvement in their ability to protect the rim and limit opponents’ second-chance opportunities.
- Wyoming, Opp Shooting, Down, Trend Strength: -0.015 – The Cowboys have successfully shifted momentum against their foes by tightening their defensive identity to stifle opposing shooting efforts.
- Nevada, Opp Shooting, Down, Trend Strength: -0.014 – Throughout their opening week, Nevada has shown a marked strength in curbing opponent shooting efficiency, effectively stifling rivals early in the season.
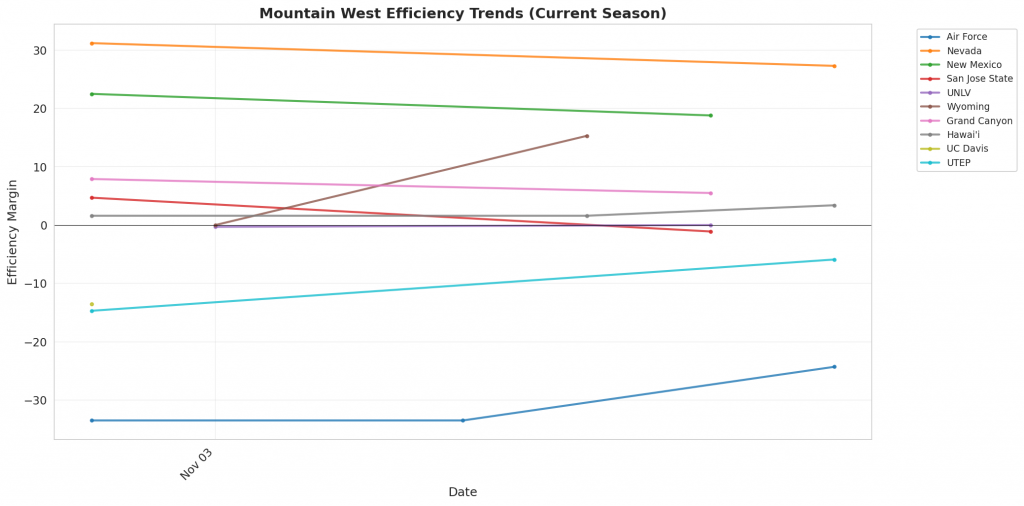
Figure 1: Efficiency margin trends for Mountain West teams throughout the season. Teams trending upward show improving performance, while downward trends indicate struggles.
Conference Snapshot
- Week Dates: November 02 – November 08, 2026
- Trending Up (Efficiency): Nevada, New Mexico, San Jose State, UNLV, Wyoming
- Trending Down (Efficiency): Air Force, Hawai’i, UC Davis
Team-by-Team Analysis
Air Force
Record: 2-1 | Elo: 1319.1 (ranked 368 of 365) | Efficiency Margin: -24.32 (ranked 335 of 365)
Offensive Trends:
- Shooting (Shooting): Currently ranked 345 of 365 in D1. Trending down strongly 🔴.
- Turnovers (Turnovers): Currently ranked 215 of 365 in D1. Trending down strongly 🟢.
Defensive Trends:
- Def Reb Pct (Defensive Rebounding): Currently ranked 346 of 365 in D1. Trending down strongly 🔴.
- Opp Shooting (Opp Shooting): Currently ranked 286 of 365 in D1. Trending down moderately 🟢.
Grand Canyon
Record: 2-0 | Elo: 1602.5 (ranked 53 of 365) | Efficiency Margin: +5.54 (ranked 124 of 365)
Offensive Trends:
- Shooting (Shooting): Currently ranked 55 of 365 in D1. Trending up strongly 🟢.
- Turnovers (Turnovers): Currently ranked 174 of 365 in D1. Trending down weakly 🟢.
Defensive Trends:
- Def Reb Pct (Defensive Rebounding): Currently ranked 32 of 365 in D1. Trending up strongly 🟢.
- Opp Shooting (Opp Shooting): Currently ranked 142 of 365 in D1. Trending up moderately 🔴.
Hawai’i
Record: 3-0 | Elo: 1562.8 (ranked 90 of 365) | Efficiency Margin: +3.40 (ranked 133 of 365)
Offensive Trends:
- Turnovers (Turnovers): Currently ranked 241 of 365 in D1. Trending down strongly 🟢.
- Off Reb Pct (Offensive Rebounding): Currently ranked 243 of 365 in D1. Trending up strongly 🟢.
Defensive Trends:
- Opp Turnovers (Opp Turnovers): Currently ranked 28 of 365 in D1. Trending up strongly 🟢.
- Opp Shooting (Opp Shooting): Currently ranked 172 of 365 in D1. Trending up moderately 🔴.
Nevada
Record: 2-0 | Elo: 1604.6 (ranked 52 of 365) | Efficiency Margin: +27.32 (ranked 26 of 365)
Offensive Trends:
- Shooting (Shooting): Currently ranked 61 of 365 in D1. Trending up moderately 🟢.
- Turnovers (Turnovers): Currently ranked 48 of 365 in D1. Trending down weakly 🟢.
Defensive Trends:
- Opp Shooting (Opp Shooting): Currently ranked 25 of 365 in D1. Trending down strongly 🟢.
- Def Reb Pct (Defensive Rebounding): Currently ranked 107 of 365 in D1. Trending up moderately 🟢.
New Mexico
Record: 2-0 | Elo: 1633.0 (ranked 39 of 365) | Efficiency Margin: +18.83 (ranked 56 of 365)
Offensive Trends:
- Turnovers (Turnovers): Currently ranked 10 of 365 in D1. Trending down strongly 🟢.
- Shooting (Shooting): Currently ranked 28 of 365 in D1. Trending up weakly 🟢.
Defensive Trends:
- Opp Shooting (Opp Shooting): Currently ranked 67 of 365 in D1. Trending down moderately 🟢.
- Opp Turnovers (Opp Turnovers): Currently ranked 48 of 365 in D1. Trending up moderately 🟢.
San Jose State
Record: 1-1 | Elo: 1421.7 (ranked 305 of 365) | Efficiency Margin: -1.13 (ranked 169 of 365)
Offensive Trends:
- Shooting (Shooting): Currently ranked 22 of 365 in D1. Trending up strongly 🟢.
- Turnovers (Turnovers): Currently ranked 236 of 365 in D1. Trending down weakly 🟢.
Defensive Trends:
- Def Reb Pct (Defensive Rebounding): Currently ranked 305 of 365 in D1. Trending down moderately 🔴.
- Opp Shooting (Opp Shooting): Currently ranked 275 of 365 in D1. Trending up weakly 🔴.
UC Davis
Record: 0-1 | Elo: 1491.7 (ranked 202 of 365) | Efficiency Margin: -13.52 (ranked 260 of 365)
Offensive Trends:
- Off Reb Pct (Offensive Rebounding): Currently ranked 297 of 365 in D1. Trending down strongly 🔴.
- Shooting (Shooting): Currently ranked 200 of 365 in D1. Trending down moderately 🔴.
Defensive Trends:
- Opp Shooting (Opp Shooting): Currently ranked 290 of 365 in D1. Trending down moderately 🟢.
- Opp Turnovers (Opp Turnovers): Currently ranked 13 of 365 in D1. Trending up moderately 🟢.
UNLV
Record: 2-0 | Elo: 1568.5 (ranked 80 of 365) | Efficiency Margin: -0.00 (ranked 160 of 365)
Offensive Trends:
- Shooting (Shooting): Currently ranked 121 of 365 in D1. Trending up moderately 🟢.
- Turnovers (Turnovers): Currently ranked 162 of 365 in D1. Trending up moderately 🔴.
Defensive Trends:
- Opp Shooting (Opp Shooting): Currently ranked 323 of 365 in D1. Trending up weakly 🔴.
- Opp Turnovers (Opp Turnovers): Currently ranked 119 of 365 in D1. Trending up weakly 🟢.
UTEP
Record: 1-1 | Elo: 1444.4 (ranked 272 of 365) | Efficiency Margin: -5.92 (ranked 199 of 365)
Offensive Trends:
- Off Reb Pct (Offensive Rebounding): Currently ranked 198 of 365 in D1. Trending down strongly 🔴.
- Shooting (Shooting): Currently ranked 152 of 365 in D1. Trending up moderately 🟢.
Defensive Trends:
- Def Reb Pct (Defensive Rebounding): Currently ranked 83 of 365 in D1. Trending up strongly 🟢.
- Opp Shooting (Opp Shooting): Currently ranked 166 of 365 in D1. Trending down moderately 🟢.
Wyoming
Record: 2-0 | Elo: 1505.2 (ranked 178 of 365) | Efficiency Margin: +15.28 (ranked 74 of 365)
Offensive Trends:
- Off Reb Pct (Offensive Rebounding): Currently ranked 8 of 365 in D1. Trending up strongly 🟢.
- Shooting (Shooting): Currently ranked 123 of 365 in D1. Trending up moderately 🟢.
Defensive Trends:
- Opp Shooting (Opp Shooting): Currently ranked 59 of 365 in D1. Trending down strongly 🟢.
- Def Reb Pct (Defensive Rebounding): Currently ranked 135 of 365 in D1. Trending down strongly 🔴.
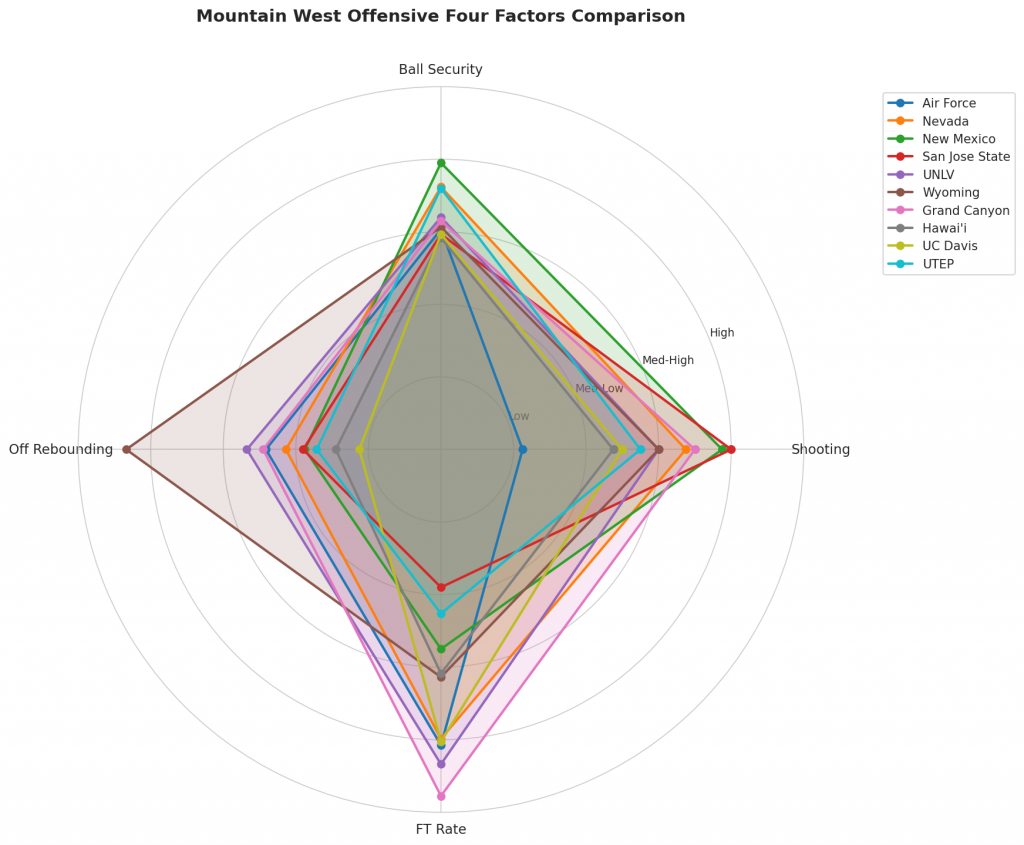
Figure 2: Offensive Four Factors comparison across Mountain West teams. The radar chart shows each team’s shooting efficiency (eFG%), ball security (TOV%), offensive rebounding (OREB%), and free throw generation (FT Rate).
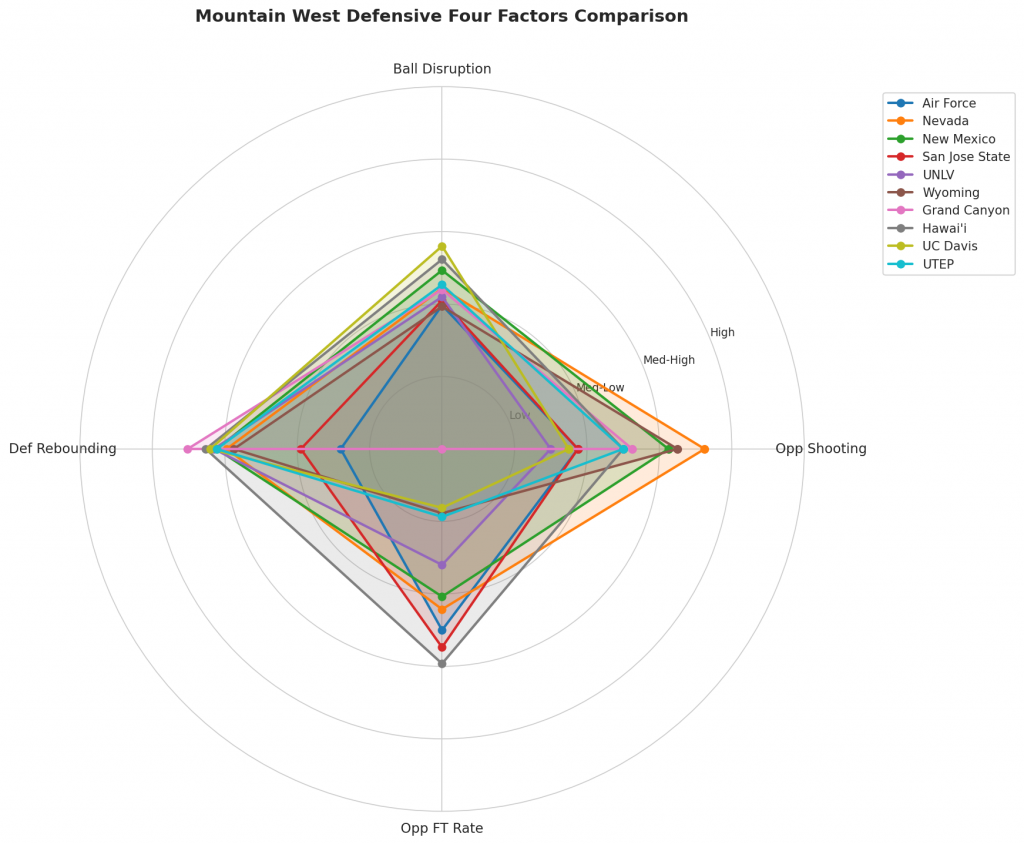
Figure 3: Defensive Four Factors comparison across Mountain West teams. The radar chart shows each team’s opponent shooting defense (Opp eFG%), ball disruption (forcing TOV%), defensive rebounding (DREB%), and opponent free throw prevention (Opp FT Rate).
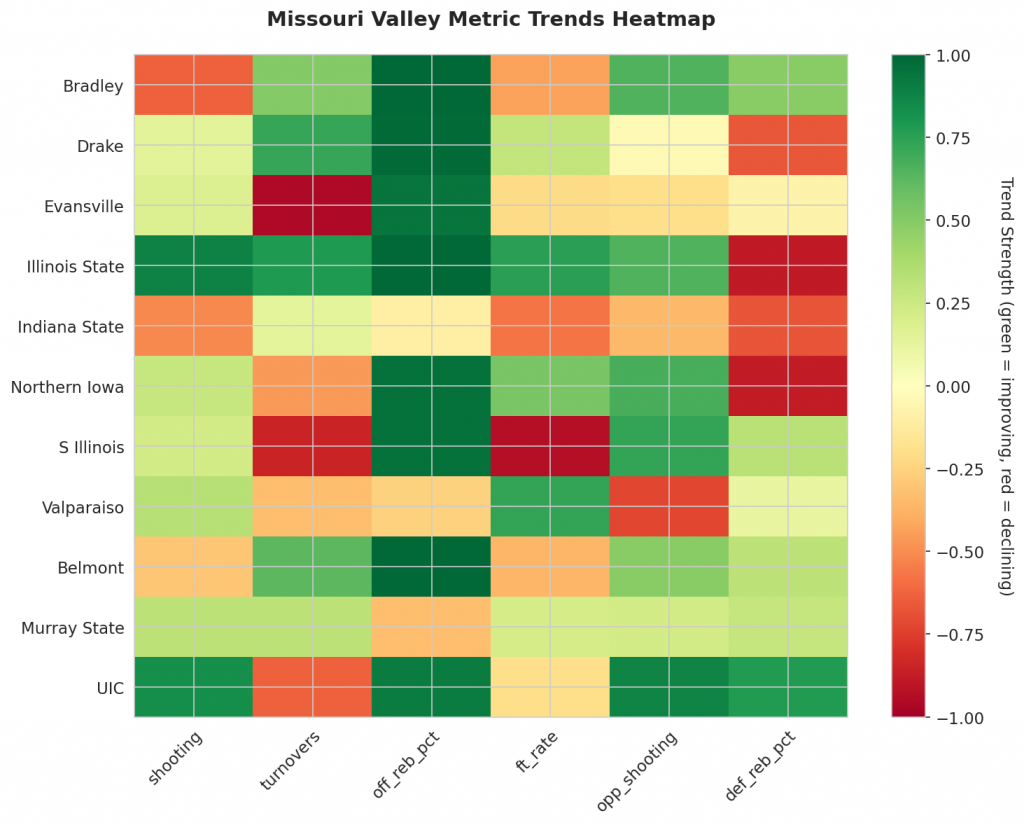
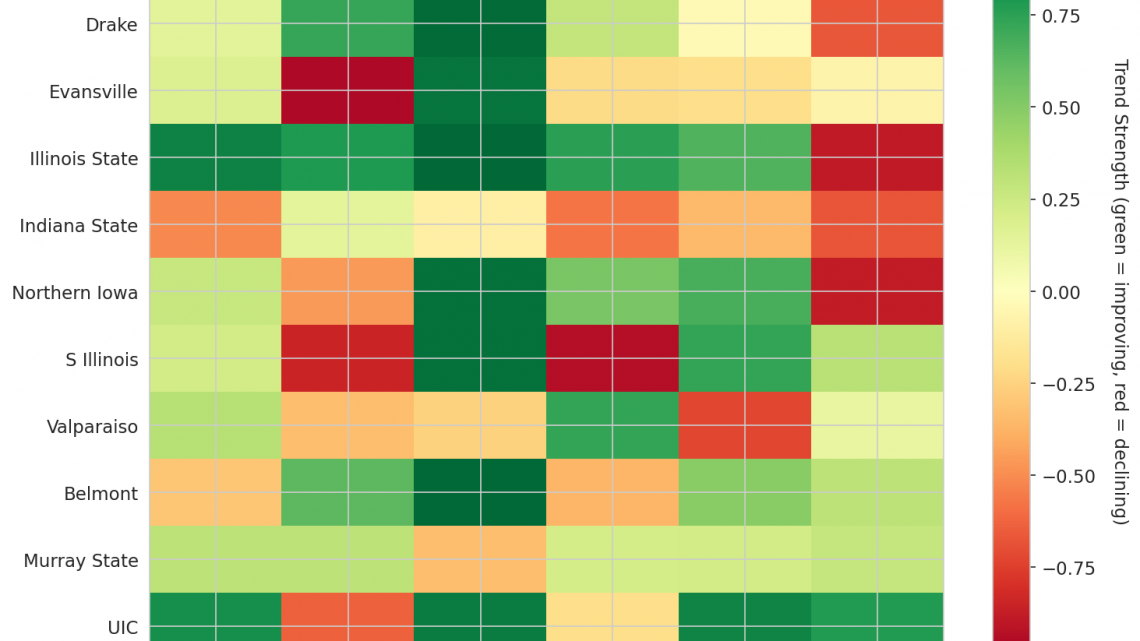
Figure 4: MACD trends heatmap showing which metrics are improving (green) or declining (red) for each team. Stronger colors indicate more pronounced trends.
Looking Ahead
Air Force presents a mixed picture regarding their offensive construction through their games so far. Their shooting performance, averaging 0.39 for the season, is showing a strongly downward trend with high magnitude. The MACD analysis confirms this is not minor fluctuation but a significant decline in scoring efficiency. Conversely, Air Force is addressing ball security; their turnover rate of 0.168 per game is trending strongly down, and a decreasing value in this context represents a massive improvement in possession management. Furthermore, Air Force has strengthened its second-chance opportunities; their offensive rebounding percentage is trending strongly up, signaling enhanced effort in the paint.
New Mexico also displays clear signs of positive momentum through ball security. With a season turnover average of 0.113, the Lobos are trending strongly down. Like Air Force’s reduced turnovers, this downward trajectory indicates an improvement in possession management, allowing the offense to run more smoothly without disruptions.
Defensively, Nevada and Wyoming are managing opponent scoring differently, though both units face challenges with interior defense. Nevada’s ability to suppress opponent shooting is improving significantly; their opponent field goal percentage of 0.41 is trending strongly down, indicating the team is successfully limiting opponents’ efficiency. Wyoming presents a defensive split. While their opponent shooting percentage of 0.44 is also trending strongly down—suggesting an improvement in stopping outside shots—they are struggling significantly with defensive rebounding. Their defensive rebounding percentage of 0.73 is trending strongly down. This worsening trend means the unit is allowing more offensive boards to opposing teams, a critical vulnerability that can lead to easy transition scoring opportunities for opponents regardless of their perimeter defense.
The MACD metrics clearly separate Air Force and New Mexico as units improving in specific areas like turnover reduction and rebounding. Nevada shows strong defensive efficiency against shooting. However, Wyoming’s inability to secure defensive rebounds poses a risk that could negate the progress seen in limiting opponent field goal percentages. These trends will likely evolve over time, and further analysis is expected next week to track whether these early indicators sustain through the remainder of the season.
Metrics Glossary
Four Factors (Dean Oliver’s framework for basketball success):
- eFG% (Effective Field Goal %): Field goal percentage adjusted for 3-pointers being worth more (FGM + 0.5×3PM) / FGA. Higher is better offensively, lower is better defensively.
- TOV% (Turnover Rate): Turnovers per 100 possessions. Lower is better offensively (taking care of the ball), higher is better defensively (forcing turnovers).
- OREB% / DREB% (Offensive/Defensive Rebound Rate): Percentage of available rebounds grabbed. Offensive rebounds create second-chance points; defensive rebounds end opponent possessions.
- FTR (Free Throw Rate): Free throws made per field goal attempt (FTM/FGA). Measures ability to get to the line AND convert. Higher is better offensively, lower is better defensively.
Other Metrics:
- Elo Rating: Chess-style rating system that updates based on game results and opponent strength. Higher Elo indicates stronger team.
- Efficiency Margin: Point differential per 100 possessions (Offensive Efficiency – Defensive Efficiency). Accounts for pace of play.
- MACD (Moving Average Convergence Divergence): Trend indicator comparing 12-game and 26-game exponential moving averages. Positive MACD = improving trend, Negative MACD = declining trend.
Analysis powered by HoopSci’s advanced metrics and MACD trending indicators.