America East Update: Week 2
November 16, 2026Strongest Offensive Trends
- Binghamton, Off Reb Pct, Up, Trend Strength: 0.046 – Binghamton’s significant improvement in grabbing rebounds after misses demonstrates a genuine offensive strength that will undoubtedly expand their opportunities to control the ball during this early season stretch.
- Albany, Off Reb Pct, Up, Trend Strength: 0.025 – Albany is seeing an improvement in their ability to grab rebounds offensively, contributing positively to their overall play as the season progresses.
- Albany, Shooting, Down, Trend Strength: -0.013 – As Albany embarks on its second week of play, a troubling downward slide in shooting accuracy has begun to erode their offensive output.
- Binghamton, Shooting, Up, Trend Strength: 0.011 – Binghamton is demonstrating marked improvement in its shooting performance throughout the early part of the season, a development that directly contributes to enhanced offensive efficiency.
- Albany, Turnovers, Up, Trend Strength: 0.008 – Albany is struggling with a troubling decline in ball security as their turnover count climbs, creating unnecessary possessions that hinder overall offensive potential and contributing to a significant problem for their game management.
Strongest Defensive Trends
- Maine, Def Reb Pct, Up, Trend Strength: 0.024 – Maine has shown improvement in securing more defensive rebounds during its games this season, which helps in limiting second-chance opportunities for opponents.
- UNH, Opp Shooting, Down, Trend Strength: -0.02 – UNH has developed a formidable defensive presence this season, effectively stifling opposing shooting efficiency and turning that strength into a tangible advantage for their campaign.
- Vermont, Def Reb Pct, Down, Trend Strength: -0.019 – Vermont is facing a growing challenge in protecting its rim, as an increasing inability to secure defensive rebounds allows opposing teams to generate extra offensive chances and maintain possession longer than desired.
- UMBC, Def Reb Pct, Down, Trend Strength: -0.015 – UMBC’s Def Reb Pct is trending down, a worsening trend (allowing more offensive boards).
- UNH, Def Reb Pct, Down, Trend Strength: -0.015 – As the team’s defensive rebounding percentage declines, UNH is increasingly surrendering extra opportunities to its opponents on offensive glass.
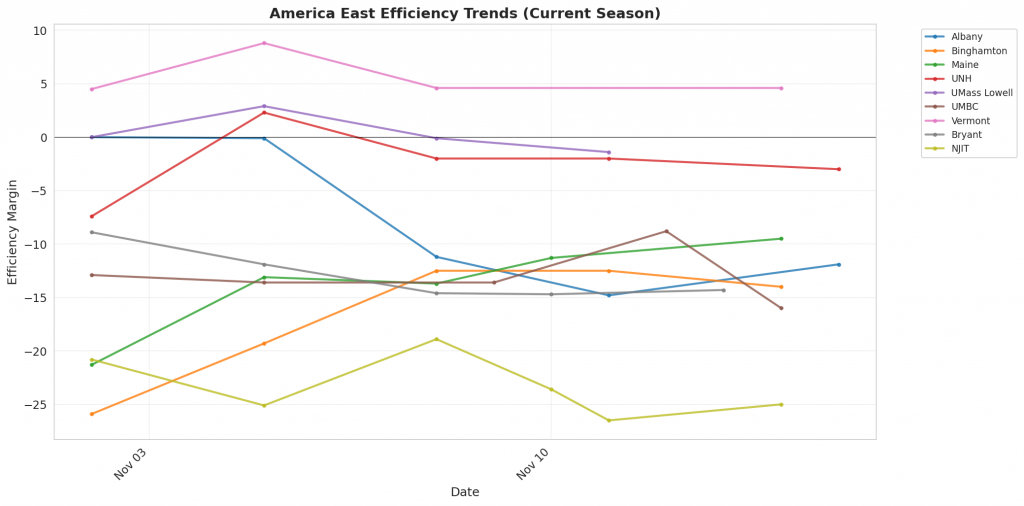
Figure 1: Efficiency margin trends for America East teams throughout the season. Teams trending upward show improving performance, while downward trends indicate struggles.
Conference Snapshot
- Week Dates: November 09 – November 15, 2026
- Trending Up (Efficiency):Binghamton, Maine, UNH, Vermont
- Trending Down (Efficiency):Albany, UMass Lowell, UMBC, Bryant, NJIT
Team-by-Team Analysis
Albany
Record: 3-2 | Elo: 1424.0 (ranked 293 of 365) | Efficiency Margin: -11.86 (ranked 257 of 365)
Offensive Trends:
- Shooting (Shooting): Currently ranked 263 of 365 in D1. Trending down strongly 🔴.
- Turnovers (Turnovers): Currently ranked 284 of 365 in D1. Trending up strongly 🔴.
Defensive Trends:
- Opp Shooting (Opp Shooting): Currently ranked 236 of 365 in D1. Trending down moderately 🟢.
- Opp Turnovers (Opp Turnovers): Currently ranked 124 of 365 in D1. Trending up moderately 🟢.
Binghamton
Record: 3-2 | Elo: 1392.4 (ranked 330 of 365) | Efficiency Margin: -14.02 (ranked 271 of 365)
Offensive Trends:
- Shooting (Shooting): Currently ranked 244 of 365 in D1. Trending up strongly 🟢.
- Off Reb Pct (Offensive Rebounding): Currently ranked 341 of 365 in D1. Trending up strongly 🟢.
Defensive Trends:
- Opp Shooting (Opp Shooting): Currently ranked 216 of 365 in D1. Trending down moderately 🟢.
- Def Reb Pct (Defensive Rebounding): Currently ranked 220 of 365 in D1. Trending down moderately 🔴.
Bryant
Record: 1-4 | Elo: 1420.5 (ranked 301 of 365) | Efficiency Margin: -14.28 (ranked 275 of 365)
Offensive Trends:
- Turnovers (Turnovers): Currently ranked 338 of 365 in D1. Trending up strongly 🔴.
- Off Reb Pct (Offensive Rebounding): Currently ranked 284 of 365 in D1. Trending down strongly 🔴.
Defensive Trends:
- Def Reb Pct (Defensive Rebounding): Currently ranked 266 of 365 in D1. Trending down strongly 🔴.
- Opp Shooting (Opp Shooting): Currently ranked 118 of 365 in D1. Trending down moderately 🟢.
Maine
Record: 1-4 | Elo: 1392.5 (ranked 329 of 365) | Efficiency Margin: -9.48 (ranked 235 of 365)
Offensive Trends:
- Turnovers (Turnovers): Currently ranked 356 of 365 in D1. Trending up strongly 🔴.
- Off Reb Pct (Offensive Rebounding): Currently ranked 363 of 365 in D1. Trending down moderately 🔴.
Defensive Trends:
- Def Reb Pct (Defensive Rebounding): Currently ranked 135 of 365 in D1. Trending up strongly 🟢.
- Opp Shooting (Opp Shooting): Currently ranked 115 of 365 in D1. Trending down moderately 🟢.
NJIT
Record: 1-5 | Elo: 1419.6 (ranked 303 of 365) | Efficiency Margin: -24.96 (ranked 343 of 365)
Offensive Trends:
- Shooting (Shooting): Currently ranked 356 of 365 in D1. Trending down strongly 🔴.
- Turnovers (Turnovers): Currently ranked 187 of 365 in D1. Trending up strongly 🔴.
Defensive Trends:
- Def Reb Pct (Defensive Rebounding): Currently ranked 337 of 365 in D1. Trending down moderately 🔴.
- Opp Shooting (Opp Shooting): Currently ranked 239 of 365 in D1. Trending up weakly 🔴.
UMBC
Record: 2-3 | Elo: 1511.9 (ranked 169 of 365) | Efficiency Margin: -16.03 (ranked 289 of 365)
Offensive Trends:
- Shooting (Shooting): Currently ranked 325 of 365 in D1. Trending down strongly 🔴.
- Turnovers (Turnovers): Currently ranked 269 of 365 in D1. Trending up strongly 🔴.
Defensive Trends:
- Def Reb Pct (Defensive Rebounding): Currently ranked 211 of 365 in D1. Trending down strongly 🔴.
- Opp Shooting (Opp Shooting): Currently ranked 117 of 365 in D1. Trending down moderately 🟢.
UMass Lowell
Record: 3-1 | Elo: 1487.2 (ranked 215 of 365) | Efficiency Margin: -1.40 (ranked 159 of 365)
Offensive Trends:
- Shooting (Shooting): Currently ranked 328 of 365 in D1. Trending down strongly 🔴.
- Turnovers (Turnovers): Currently ranked 10 of 365 in D1. Trending down strongly 🟢.
Defensive Trends:
- Opp Shooting (Opp Shooting): Currently ranked 126 of 365 in D1. Trending down moderately 🟢.
- Opp Turnovers (Opp Turnovers): Currently ranked 184 of 365 in D1. Trending up moderately 🟢.
UNH
Record: 3-2 | Elo: 1393.8 (ranked 328 of 365) | Efficiency Margin: -2.97 (ranked 173 of 365)
Offensive Trends:
- Off Reb Pct (Offensive Rebounding): Currently ranked 324 of 365 in D1. Trending up strongly 🟢.
- Shooting (Shooting): Currently ranked 276 of 365 in D1. Trending up moderately 🟢.
Defensive Trends:
- Opp Shooting (Opp Shooting): Currently ranked 20 of 365 in D1. Trending down strongly 🟢.
- Def Reb Pct (Defensive Rebounding): Currently ranked 219 of 365 in D1. Trending down strongly 🔴.
Vermont
Record: 2-2 | Elo: 1548.8 (ranked 109 of 365) | Efficiency Margin: +4.64 (ranked 125 of 365)
Offensive Trends:
- Off Reb Pct (Offensive Rebounding): Currently ranked 61 of 365 in D1. Trending up strongly 🟢.
- Shooting (Shooting): Currently ranked 121 of 365 in D1. Trending up moderately 🟢.
Defensive Trends:
- Def Reb Pct (Defensive Rebounding): Currently ranked 123 of 365 in D1. Trending down strongly 🔴.
- Opp Shooting (Opp Shooting): Currently ranked 89 of 365 in D1. Trending down moderately 🟢.
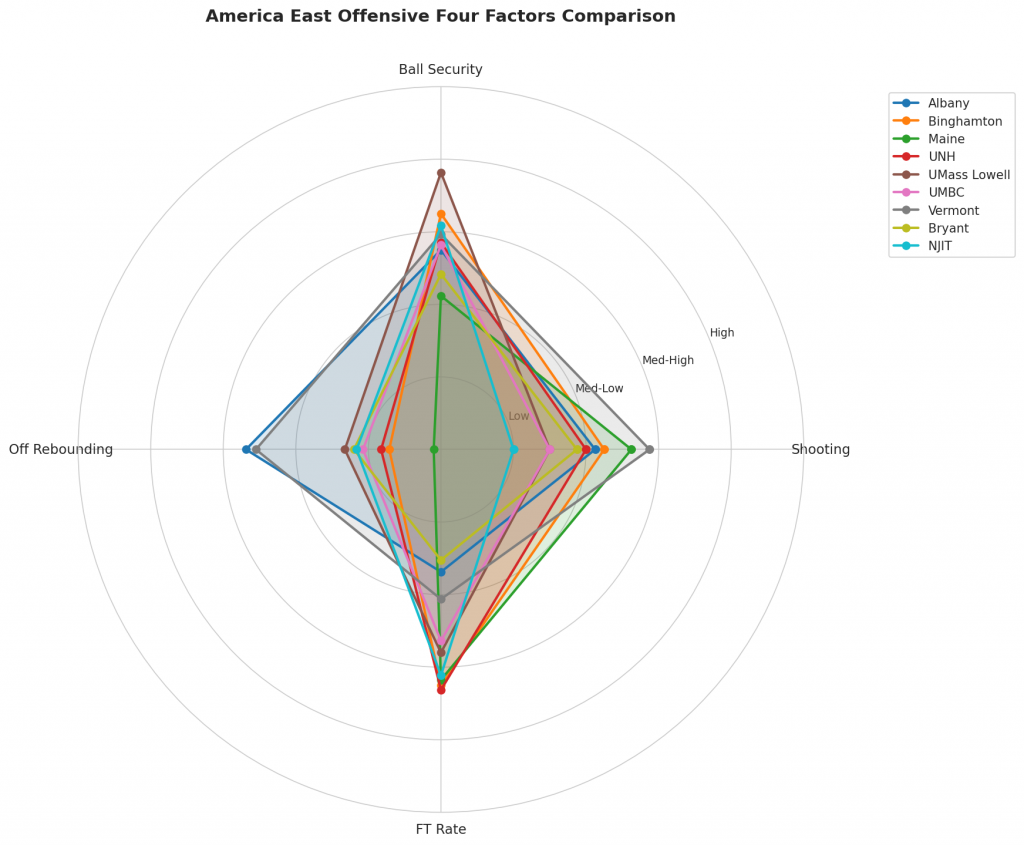
Figure 2: Offensive Four Factors comparison across America East teams. The radar chart shows each team’s shooting efficiency (eFG%), ball security (TOV%), offensive rebounding (OREB%), and free throw generation (FT Rate).
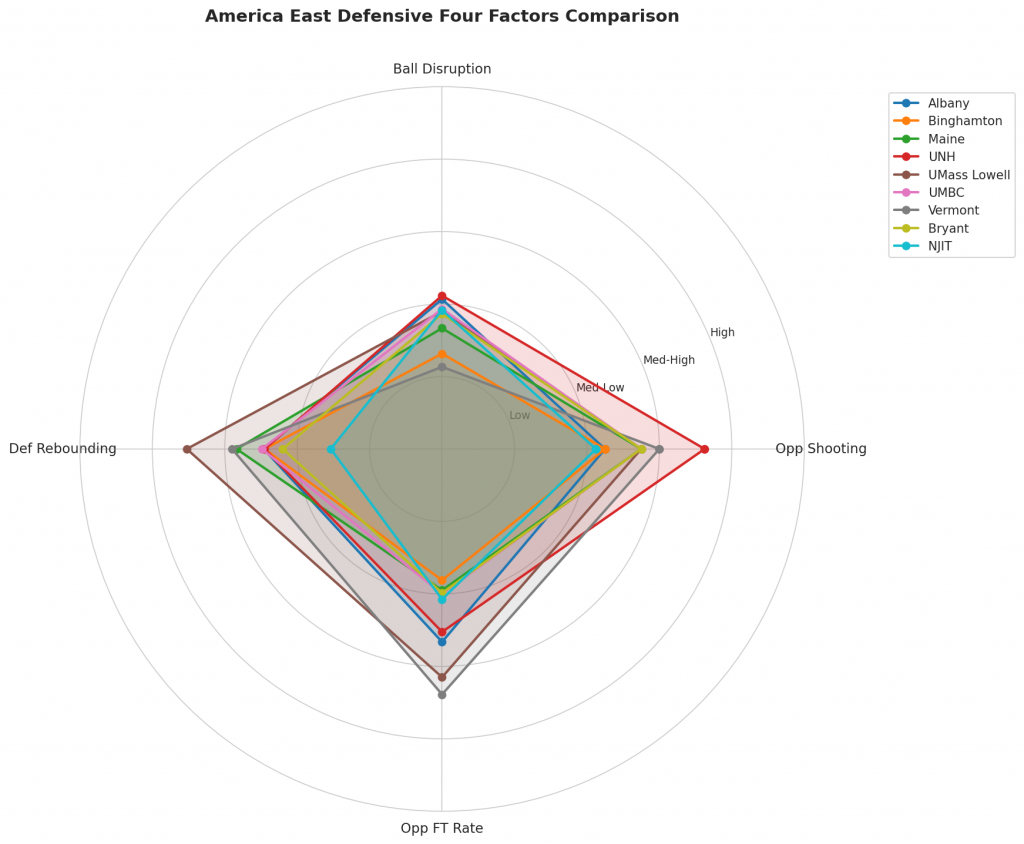
Figure 3: Defensive Four Factors comparison across America East teams. The radar chart shows each team’s opponent shooting defense (Opp eFG%), ball disruption (forcing TOV%), defensive rebounding (DREB%), and opponent free throw prevention (Opp FT Rate).
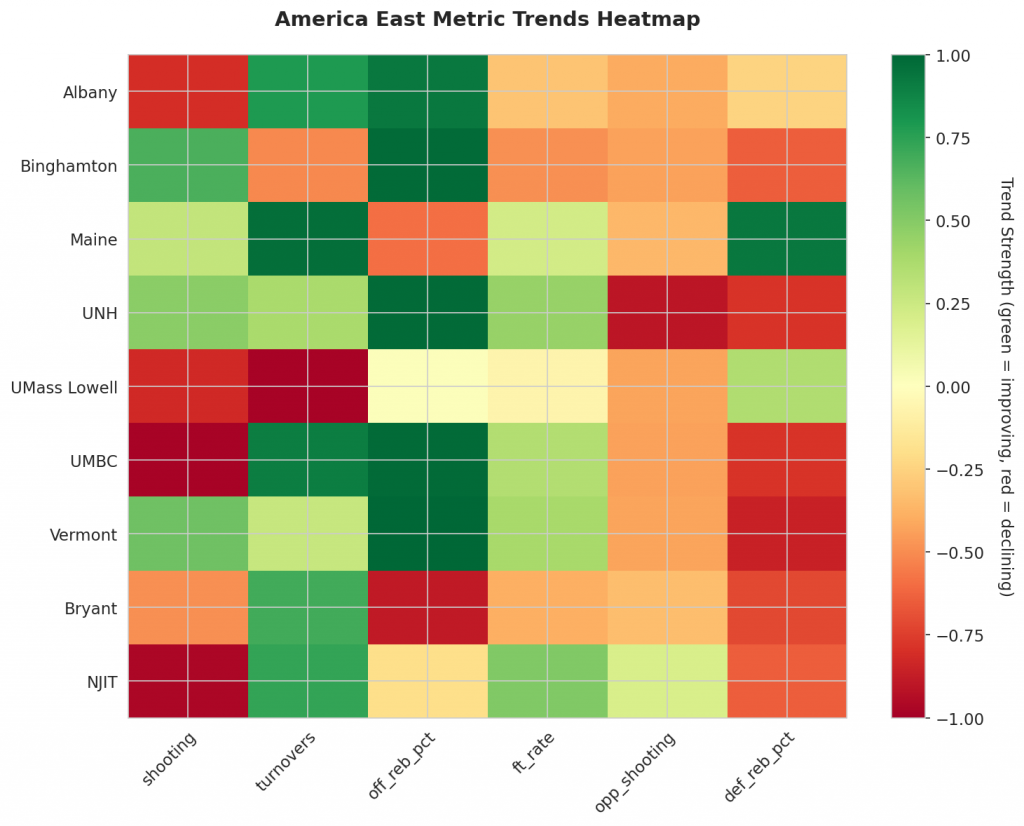
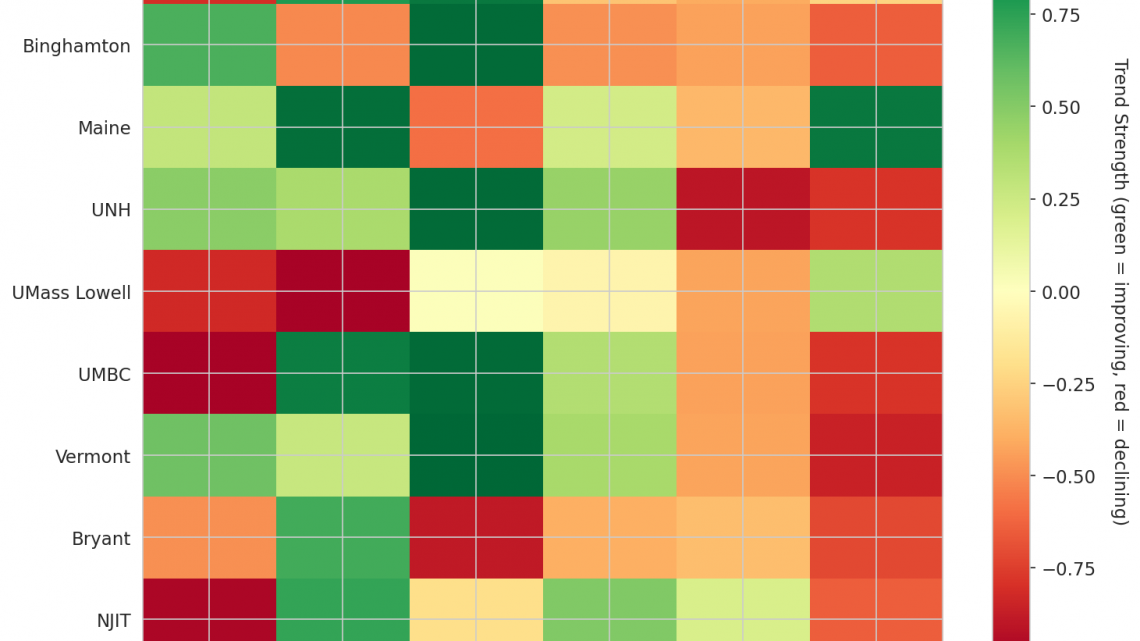
Figure 4: MACD trends heatmap showing which metrics are improving (green) or declining (red) for each team. Stronger colors indicate more pronounced trends.
Looking Ahead
The momentum indicators from the first two weeks of play reveal distinct trajectories in offensive efficiency and ball security among the conference squads. The University at Albany presents a complex statistical picture; while the team maintains a season average shooting percentage of 0.47, the magnitude indicator shows a strong downward trend, signaling that shot conversion is worsening. This offensive struggle is compounded by ball protection issues, where the turnover rate sits at a season average of 0.185 but trends strongly upward, indicating a significant deterioration in securing possession. Despite these shooting and turning over the ball concerns, Albany benefits from rebounding adjustments, as their offensive rebound percentage of 0.365 is trending strongly upward to generate second-chance opportunities.
Conversely, Binghamton is finding better rhythm with the ball, displaying a strong upward trend in their season average shooting percentage of 0.48. This suggests an improving ability to convert shots effectively as games wear on, contrasting sharply with the declining trends seen elsewhere in the conference. On the defensive end, rebounding dominance has become a primary differentiator. Maine Black Bears have elevated their defensive rebounding percentage to a season average of 0.727, a shift driven by a strongly upward trend that implies successful grab control and limits opponents’ second-chance points. However, other programs are facing significant challenges protecting the glass or suppressing opponent shooting effectively. The University of New Hampshire has seen their defensive rebounding percentage of 0.696 trend strongly downward, meaning they are permitting additional offensive boards for opposing teams. Similarly, UNH faces a specific issue regarding shot suppression; their allowed opponent shooting percentage of 0.41 is trending strongly downward in value, which technically represents an improvement in stopping the other team’s scoring.
This defensive vulnerability extends to another program as well. UMBC has experienced a downturn in their own rebounding efforts, with a defensive rebounding percentage season average of 0.699 trending strongly downward. This loss of control on the glass can be detrimental to a team’s ability to dictate the pace and secure wins in tight contests, mirroring the struggles seen with ball security at Albany. These metrics serve as early warnings, highlighting which teams need to address specific statistical weaknesses while others continue to refine their execution throughout the current slate.
Metrics Glossary
Four Factors (Dean Oliver’s framework for basketball success):
- eFG% (Effective Field Goal %): Field goal percentage adjusted for 3-pointers being worth more (FGM + 0.5×3PM) / FGA. Higher is better offensively, lower is better defensively.
- TOV% (Turnover Rate): Turnovers per 100 possessions. Lower is better offensively (taking care of the ball), higher is better defensively (forcing turnovers).
- OREB% / DREB% (Offensive/Defensive Rebound Rate): Percentage of available rebounds grabbed. Offensive rebounds create second-chance points; defensive rebounds end opponent possessions.
- FTR (Free Throw Rate): Free throws made per field goal attempt (FTM/FGA). Measures ability to get to the line AND convert. Higher is better offensively, lower is better defensively.
Other Metrics:
- Elo Rating: Chess-style rating system that updates based on game results and opponent strength. Higher Elo indicates stronger team.
- Efficiency Margin: Point differential per 100 possessions (Offensive Efficiency – Defensive Efficiency). Accounts for pace of play.
- MACD (Moving Average Convergence Divergence): Trend indicator comparing 12-game and 26-game exponential moving averages. Positive MACD = improving trend, Negative MACD = declining trend.
Analysis powered by HoopSci’s advanced metrics and MACD trending indicators.