WAC Update: Week 1
November 16, 2025The WAC enters Week 1 with teams showing diverse trending patterns. This analysis examines each team’s performance trends using MACD (Moving Average Convergence Divergence) indicators to identify not just where teams stand, but where they’re headed.
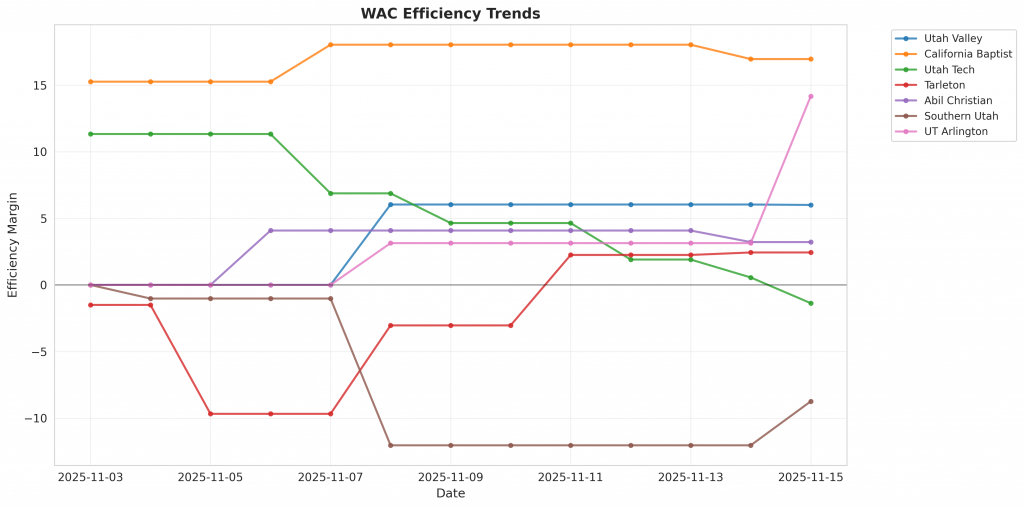
Figure 1: Efficiency margin trends for WAC teams throughout the season. Teams trending upward show improving performance, while downward trends indicate struggles.
Conference Snapshot
- Week Dates: November 03 – November 09, 2025
- Trending Up (Efficiency): Tarleton
- Trending Down (Efficiency): Utah Valley, California Baptist, Utah Tech, Abil Christian, Southern Utah
Team-by-Team Analysis
Abil Christian
Record: 1-1 | Elo: 1493.6 (ranked 194 of 365) | Efficiency Margin: +3.22 (ranked 210 of 365)
Offensive Trends:
- FTR (Free Throw Rate (FTM/FGA – getting to the line and converting)): Currently ranked 192 of 365 in D1. Trending down strongly.
California Baptist
Record: 3-0 | Elo: 1527.4 (ranked 143 of 365) | Efficiency Margin: +16.96 (ranked 101 of 365)
Offensive Trends:
- OR_PCT (Offensive Rebound Rate (% of available offensive rebounds grabbed)): Currently ranked 10 of 365 in D1. Trending up strongly.
Defensive Trends:
- FTR (FTR Allowed (opponent free throws – lower is better)): Currently ranked 275 of 365 in D1. Trending up strongly.
- EFG (eFG% Allowed (lower is better – opponents shooting less efficiently)): Currently ranked 65 of 365 in D1. Trending down strongly.
Southern Utah
Record: 0-3 | Elo: 1398.8 (ranked 319 of 365) | Efficiency Margin: -8.74 (ranked 318 of 365)
Offensive Trends:
- FTR (Free Throw Rate (FTM/FGA – getting to the line and converting)): Currently ranked 337 of 365 in D1. Trending down strongly.
- EFG (Effective Field Goal % (adjusts for 3-pointers being worth more)): Currently ranked 264 of 365 in D1. Trending down moderately.
Defensive Trends:
- EFG (eFG% Allowed (lower is better – opponents shooting less efficiently)): Currently ranked 321 of 365 in D1. Trending up strongly.
Tarleton
Record: 2-3 | Elo: 1480.8 (ranked 218 of 365) | Efficiency Margin: +2.44 (ranked 220 of 365)
Offensive Trends:
- FTR (Free Throw Rate (FTM/FGA – getting to the line and converting)): Currently ranked 36 of 365 in D1. Trending up moderately.
- OR_PCT (Offensive Rebound Rate (% of available offensive rebounds grabbed)): Currently ranked 42 of 365 in D1. Trending up strongly.
Defensive Trends:
- FTR (FTR Allowed (opponent free throws – lower is better)): Currently ranked 355 of 365 in D1. Trending up moderately.
- EFG (eFG% Allowed (lower is better – opponents shooting less efficiently)): Currently ranked 336 of 365 in D1. Trending up strongly.
UT Arlington
Record: 2-1 | Elo: 1484.3 (ranked 213 of 365) | Efficiency Margin: +14.17 (ranked 123 of 365)
Offensive Trends:
- EFG (Effective Field Goal % (adjusts for 3-pointers being worth more)): Currently ranked 315 of 365 in D1. Trending down strongly.
Defensive Trends:
- EFG (eFG% Allowed (lower is better – opponents shooting less efficiently)): Currently ranked 7 of 365 in D1. Trending down strongly.
Utah Tech
Record: 2-4 | Elo: 1378.5 (ranked 334 of 365) | Efficiency Margin: -1.37 (ranked 254 of 365)
Offensive Trends:
- OR_PCT (Offensive Rebound Rate (% of available offensive rebounds grabbed)): Currently ranked 196 of 365 in D1. Trending up strongly.
- FTR (Free Throw Rate (FTM/FGA – getting to the line and converting)): Currently ranked 227 of 365 in D1. Trending down moderately.
Utah Valley
Record: 1-2 | Elo: 1584.1 (ranked 73 of 365) | Efficiency Margin: +6.01 (ranked 186 of 365)
Offensive Trends:
- OR_PCT (Offensive Rebound Rate (% of available offensive rebounds grabbed)): Currently ranked 298 of 365 in D1. Trending down strongly.
Defensive Trends:
- EFG (eFG% Allowed (lower is better – opponents shooting less efficiently)): Currently ranked 363 of 365 in D1. Trending up strongly.
- DR_PCT (Defensive Rebound Rate (% of available defensive rebounds secured)): Currently ranked 60 of 365 in D1. Trending down moderately.
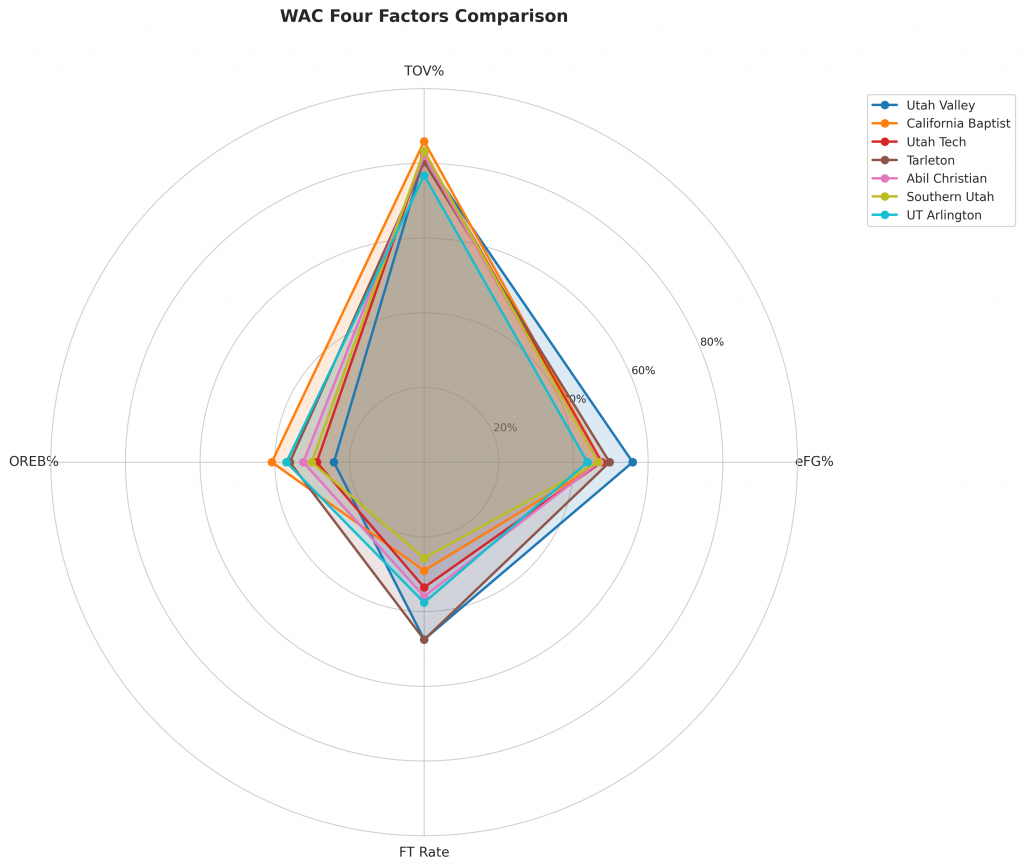
Figure 2: Four Factors comparison across WAC teams. The radar chart shows each team’s offensive efficiency (eFG%), ball security (TOV%), rebounding (OREB%), and free throw generation (FT Rate).
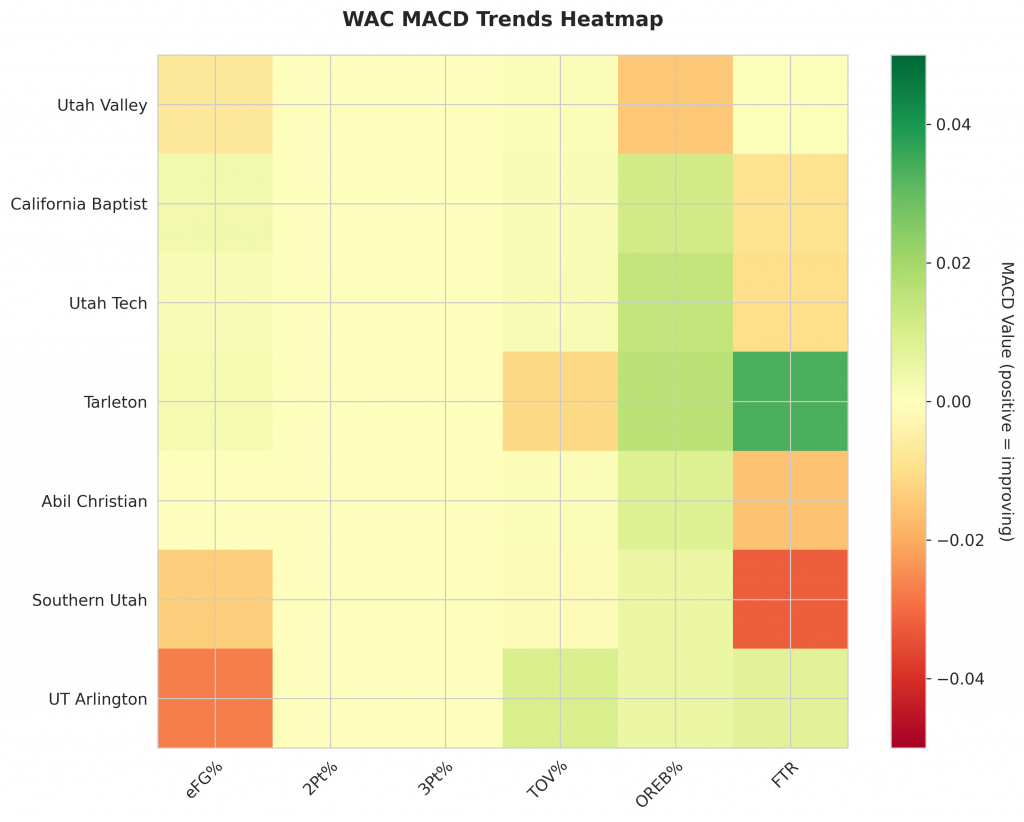
Figure 3: MACD trends heatmap showing which metrics are improving (green) or declining (red) for each team. Stronger colors indicate more pronounced trends.
Looking Ahead
As WAC teams continue their season, the MACD trending indicators will help identify which teams are genuinely improving versus those riding unsustainable momentum. Check back next week for updated analysis.
Metrics Glossary
Four Factors (Dean Oliver’s framework for basketball success):
- eFG% (Effective Field Goal %): Field goal percentage adjusted for 3-pointers being worth more (FGM + 0.5×3PM) / FGA. Higher is better offensively, lower is better defensively.
- TOV% (Turnover Rate): Turnovers per 100 possessions. Lower is better offensively (taking care of the ball), higher is better defensively (forcing turnovers).
- OREB% / DREB% (Offensive/Defensive Rebound Rate): Percentage of available rebounds grabbed. Offensive rebounds create second-chance points; defensive rebounds end opponent possessions.
- FTR (Free Throw Rate): Free throws made per field goal attempt (FTM/FGA). Measures ability to get to the line AND convert. Higher is better offensively, lower is better defensively.
Other Metrics:
- Elo Rating: Chess-style rating system that updates based on game results and opponent strength. Higher Elo indicates stronger team.
- Efficiency Margin: Point differential per 100 possessions (Offensive Efficiency – Defensive Efficiency). Accounts for pace of play.
- MACD (Moving Average Convergence Divergence): Trend indicator comparing 12-game and 26-game exponential moving averages. Positive MACD = improving trend, Negative MACD = declining trend.
Analysis powered by HoopSci’s advanced metrics and MACD trending indicators.