American Update: Week 5
December 8, 2025The American enters Week 5 with teams showing diverse trending patterns. This analysis examines each team’s performance trends using MACD (Moving Average Convergence Divergence) indicators to identify not just where teams stand, but where they’re headed.
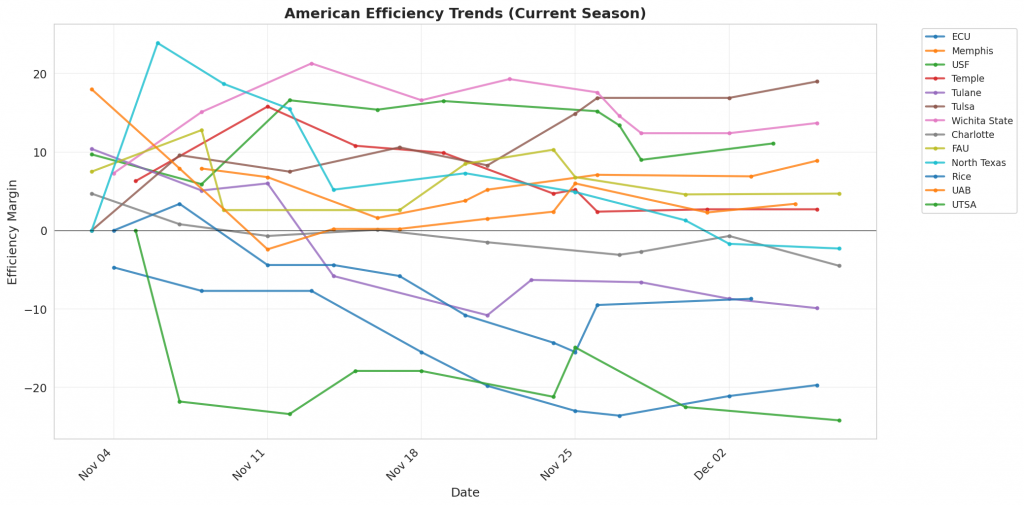
Figure 1: Efficiency margin trends for American teams throughout the season. Teams trending upward show improving performance, while downward trends indicate struggles.
Conference Snapshot
- Week Dates: December 01 – December 07, 2025
- Trending Up (Efficiency): Tulsa, Wichita State, Charlotte, North Texas, Rice
- Trending Down (Efficiency): ECU, Memphis, USF, Temple, Tulane
Team-by-Team Analysis
Charlotte
Record: 3-6 | Elo: 1431.3 (ranked 280 of 365) | Efficiency Margin: -4.53 (ranked 206 of 365)
Offensive Trends:
- Turnovers (Turnovers): Currently ranked 209 of 365 in D1. Trending up strongly 🔴.
- Off Reb Pct (Offensive Rebounding): Currently ranked 63 of 365 in D1. Trending up strongly 🟢.
Defensive Trends:
- Opp FT Rate (Opp FTA/FGA (%)): Currently ranked 345 of 365 in D1. Trending up strongly 🔴.
- Opp FGM Per Poss (Opp FG Makes Per Possession (%)): Currently ranked 150 of 365 in D1. Trending down strongly 🟢.
ECU
Record: 3-6 | Elo: 1463.2 (ranked 240 of 365) | Efficiency Margin: -19.70 (ranked 315 of 365)
Offensive Trends:
- Turnovers (Turnovers): Currently ranked 264 of 365 in D1. Trending up strongly 🔴.
- Adj Off Eff (Adjusted Offensive Efficiency): Currently ranked 311 of 365 in D1. Trending down strongly 🔴.
Defensive Trends:
- Opp 2Pt Pct (Opp 2 Point FGM/FGA (%)): Currently ranked 238 of 365 in D1. Trending up strongly 🔴.
- Opp 3Pt Pct (Opp 3 Point FGM/FGA (%)): Currently ranked 286 of 365 in D1. Trending down strongly 🟢.
FAU
Record: 6-3 | Elo: 1583.0 (ranked 81 of 365) | Efficiency Margin: +4.70 (ranked 127 of 365)
Offensive Trends:
- Off Reb Pct (Offensive Rebounding): Currently ranked 59 of 365 in D1. Trending up strongly 🟢.
- FTM Per Poss (Free Throw Makes Per Possession (%)): Currently ranked 158 of 365 in D1. Trending up strongly 🟢.
Defensive Trends:
- Opp Shooting (Opp Shooting): Currently ranked 260 of 365 in D1. Trending up strongly 🔴.
- Opp Turnovers (Opp Turnovers): Currently ranked 229 of 365 in D1. Trending up strongly 🔴.
Memphis
Record: 4-4 | Elo: 1654.0 (ranked 26 of 365) | Efficiency Margin: +8.94 (ranked 101 of 365)
Offensive Trends:
- Shooting (Shooting): Currently ranked 240 of 365 in D1. Trending down strongly 🔴.
- Adj Off Eff (Adjusted Offensive Efficiency): Currently ranked 133 of 365 in D1. Trending down strongly 🔴.
Defensive Trends:
- Opp Shooting (Opp Shooting): Currently ranked 83 of 365 in D1. Trending down strongly 🟢.
- Def Reb Pct (Defensive Rebounding): Currently ranked 317 of 365 in D1. Trending down strongly 🔴.
North Texas
Record: 7-3 | Elo: 1613.8 (ranked 55 of 365) | Efficiency Margin: -2.28 (ranked 186 of 365)
Offensive Trends:
- Turnovers (Turnovers): Currently ranked 225 of 365 in D1. Trending up strongly 🔴.
- FT Rate (FTA/FGA (%)): Currently ranked 64 of 365 in D1. Trending up strongly 🟢.
Defensive Trends:
- Opp FT Rate (Opp FTA/FGA (%)): Currently ranked 351 of 365 in D1. Trending up strongly 🔴.
- Opp FTA Per Poss (Opp Free Throw Attempts Per Possession (%)): Currently ranked 350 of 365 in D1. Trending up strongly 🔴.
Rice
Record: 4-6 | Elo: 1419.4 (ranked 295 of 365) | Efficiency Margin: -8.71 (ranked 231 of 365)
Offensive Trends:
- Assists per FGM (Assists/FGM (%)): Currently ranked 302 of 365 in D1. Trending down strongly 🔴.
- Off Tempo (Offensive Possessions Per Game): Currently ranked 180 of 365 in D1. Trending up strongly 🟢.
Defensive Trends:
- Opp Turnovers (Opp Turnovers): Currently ranked 199 of 365 in D1. Trending up strongly 🔴.
- Opp 3PA Per Poss (Opp 3 Point Attempts Per Possession (%)): Currently ranked 58 of 365 in D1. Trending down strongly 🟢.
Temple
Record: 4-5 | Elo: 1493.3 (ranked 196 of 365) | Efficiency Margin: +2.66 (ranked 140 of 365)
Offensive Trends:
- FT Rate (FTA/FGA (%)): Currently ranked 9 of 365 in D1. Trending up strongly 🟢.
- FTA Per Poss (Free Throw Attempts Per Possession (%)): Currently ranked 13 of 365 in D1. Trending up strongly 🟢.
Defensive Trends:
- Opp FGA Per Poss (Opp FG Attempts Per Possession (%)): Currently ranked 282 of 365 in D1. Trending up strongly 🔴.
- Opp 2Pt Rate (Opp 2 Point Attempts/FGA (%)): Currently ranked 123 of 365 in D1. Trending down strongly 🟢.
Tulane
Record: 6-3 | Elo: 1532.9 (ranked 137 of 365) | Efficiency Margin: -9.86 (ranked 240 of 365)
Offensive Trends:
- Off Reb Pct (Offensive Rebounding): Currently ranked 363 of 365 in D1. Trending down strongly 🔴.
- FGM Per Poss (Field Goal Makes Per Possession (%)): Currently ranked 291 of 365 in D1. Trending down strongly 🔴.
Defensive Trends:
- Opp Shooting (Opp Shooting): Currently ranked 316 of 365 in D1. Trending up strongly 🔴.
- Opp FGA Per Poss (Opp FG Attempts Per Possession (%)): Currently ranked 147 of 365 in D1. Trending down strongly 🟢.
Tulsa
Record: 8-1 | Elo: 1491.8 (ranked 201 of 365) | Efficiency Margin: +19.04 (ranked 42 of 365)
Offensive Trends:
- Shooting (Shooting): Currently ranked 42 of 365 in D1. Trending up strongly 🟢.
- Turnovers (Turnovers): Currently ranked 82 of 365 in D1. Trending down strongly 🟢.
Defensive Trends:
- Opp Turnovers (Opp Turnovers): Currently ranked 187 of 365 in D1. Trending up strongly 🔴.
- Def Reb Pct (Defensive Rebounding): Currently ranked 59 of 365 in D1. Trending up strongly 🟢.
UAB
Record: 7-3 | Elo: 1621.4 (ranked 50 of 365) | Efficiency Margin: +3.42 (ranked 134 of 365)
Offensive Trends:
- Shooting (Shooting): Currently ranked 273 of 365 in D1. Trending down strongly 🔴.
- Adj Off Eff (Adjusted Offensive Efficiency): Currently ranked 155 of 365 in D1. Trending down strongly 🔴.
Defensive Trends:
- Def Reb Pct (Defensive Rebounding): Currently ranked 36 of 365 in D1. Trending up strongly 🟢.
- Opp 2PM Per Poss (Opp 2 Point Makes Per Possession (%)): Currently ranked 186 of 365 in D1. Trending down strongly 🟢.
USF
Record: 5-4 | Elo: 1508.7 (ranked 173 of 365) | Efficiency Margin: +11.07 (ranked 85 of 365)
Offensive Trends:
- Adj Off Eff (Adjusted Offensive Efficiency): Currently ranked 98 of 365 in D1. Trending up strongly 🟢.
- FGM Per Poss (Field Goal Makes Per Possession (%)): Currently ranked 251 of 365 in D1. Trending down strongly 🔴.
Defensive Trends:
- Opp Shooting (Opp Shooting): Currently ranked 201 of 365 in D1. Trending up strongly 🔴.
- Def Reb Pct (Defensive Rebounding): Currently ranked 121 of 365 in D1. Trending up strongly 🟢.
UTSA
Record: 4-5 | Elo: 1412.8 (ranked 303 of 365) | Efficiency Margin: -24.15 (ranked 338 of 365)
Offensive Trends:
- Shooting (Shooting): Currently ranked 356 of 365 in D1. Trending down strongly 🔴.
- Turnovers (Turnovers): Currently ranked 121 of 365 in D1. Trending up strongly 🔴.
Defensive Trends:
- Opp Shooting (Opp Shooting): Currently ranked 72 of 365 in D1. Trending down strongly 🟢.
- Opp Turnovers (Opp Turnovers): Currently ranked 297 of 365 in D1. Trending down strongly 🟢.
Wichita State
Record: 6-4 | Elo: 1533.2 (ranked 134 of 365) | Efficiency Margin: +13.65 (ranked 66 of 365)
Offensive Trends:
- Shooting (Shooting): Currently ranked 230 of 365 in D1. Trending up strongly 🟢.
- Off Reb Pct (Offensive Rebounding): Currently ranked 18 of 365 in D1. Trending up strongly 🟢.
Defensive Trends:
- Opp 3Pt Pct (Opp 3 Point FGM/FGA (%)): Currently ranked 32 of 365 in D1. Trending down strongly 🟢.
- Opp FTA Per Poss (Opp Free Throw Attempts Per Possession (%)): Currently ranked 166 of 365 in D1. Trending up strongly 🔴.
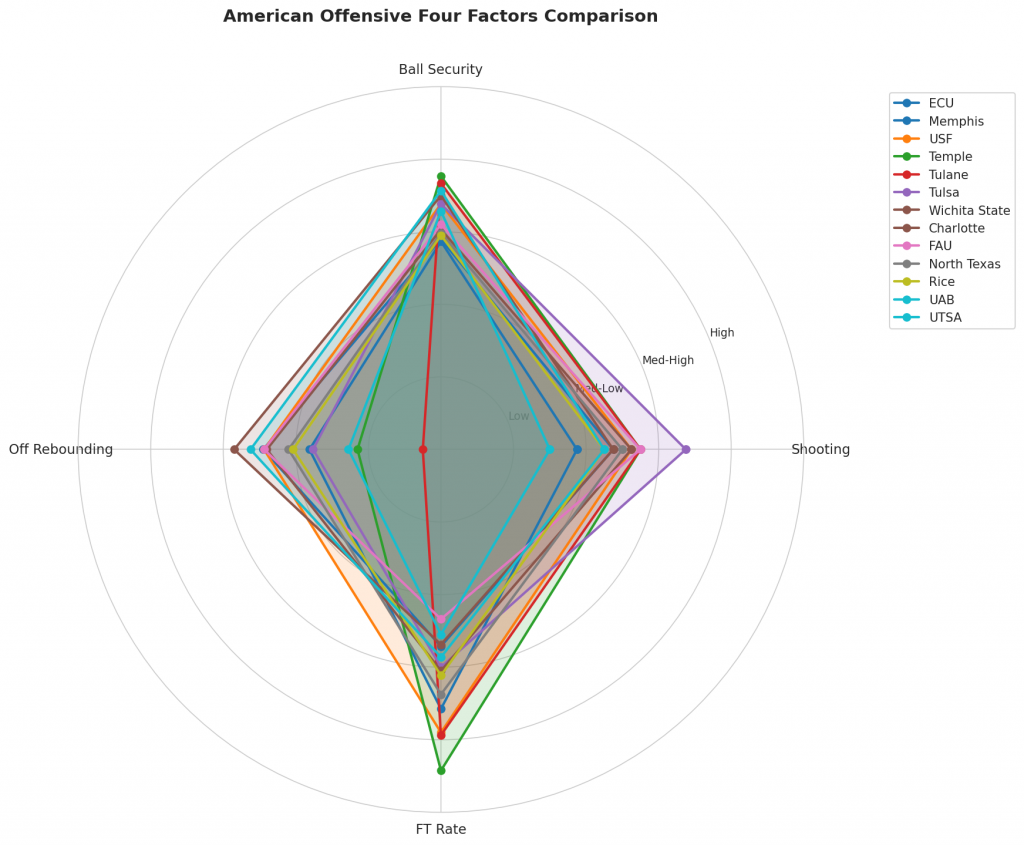
Figure 2: Offensive Four Factors comparison across American teams. The radar chart shows each team’s shooting efficiency (eFG%), ball security (TOV%), offensive rebounding (OREB%), and free throw generation (FT Rate).
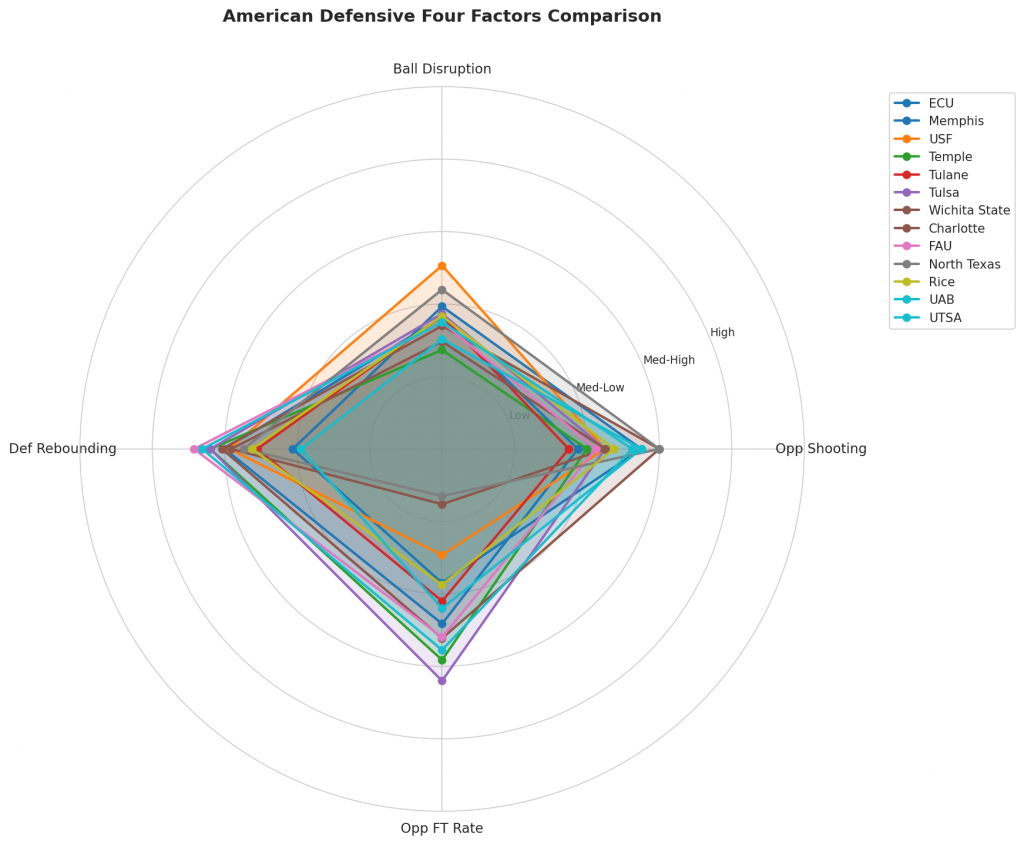
Figure 3: Defensive Four Factors comparison across American teams. The radar chart shows each team’s opponent shooting defense (Opp eFG%), ball disruption (forcing TOV%), defensive rebounding (DREB%), and opponent free throw prevention (Opp FT Rate).
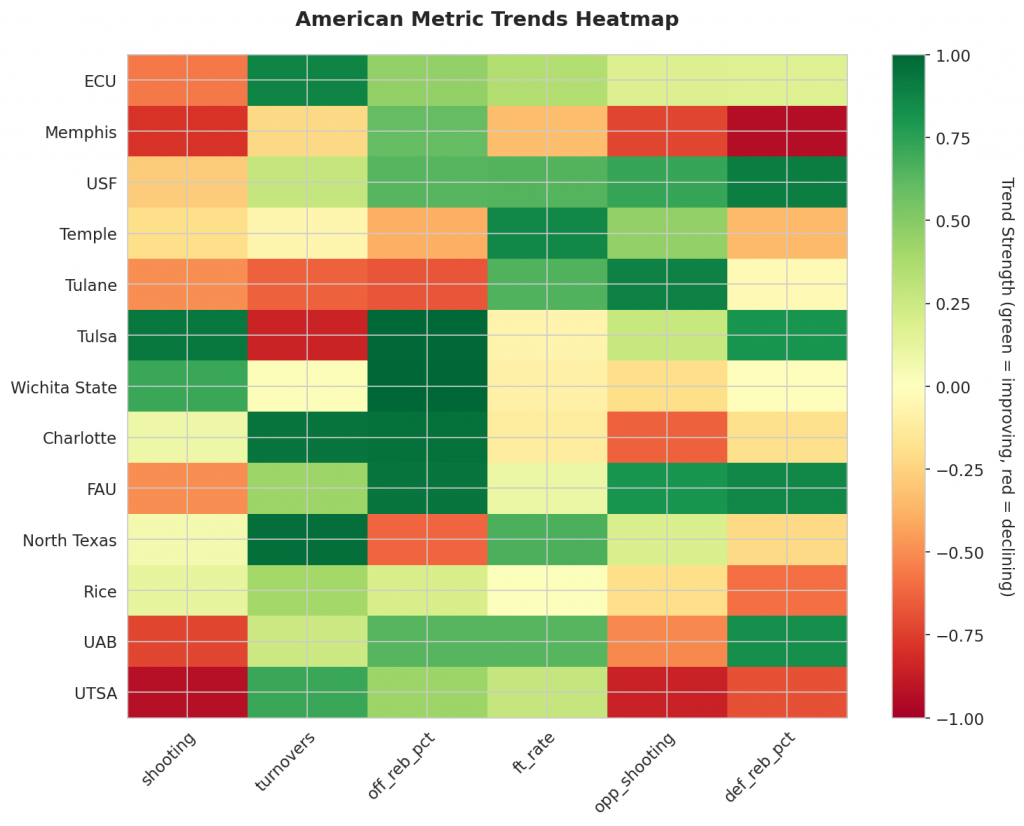
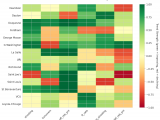
Figure 4: MACD trends heatmap showing which metrics are improving (green) or declining (red) for each team. Stronger colors indicate more pronounced trends.
Looking Ahead
As American teams continue their season, the MACD trending indicators will help identify which teams are genuinely improving versus those riding unsustainable momentum. Check back next week for updated analysis.
Metrics Glossary
Four Factors (Dean Oliver’s framework for basketball success):
- eFG% (Effective Field Goal %): Field goal percentage adjusted for 3-pointers being worth more (FGM + 0.5×3PM) / FGA. Higher is better offensively, lower is better defensively.
- TOV% (Turnover Rate): Turnovers per 100 possessions. Lower is better offensively (taking care of the ball), higher is better defensively (forcing turnovers).
- OREB% / DREB% (Offensive/Defensive Rebound Rate): Percentage of available rebounds grabbed. Offensive rebounds create second-chance points; defensive rebounds end opponent possessions.
- FTR (Free Throw Rate): Free throws made per field goal attempt (FTM/FGA). Measures ability to get to the line AND convert. Higher is better offensively, lower is better defensively.
Other Metrics:
- Elo Rating: Chess-style rating system that updates based on game results and opponent strength. Higher Elo indicates stronger team.
- Efficiency Margin: Point differential per 100 possessions (Offensive Efficiency – Defensive Efficiency). Accounts for pace of play.
- MACD (Moving Average Convergence Divergence): Trend indicator comparing 12-game and 26-game exponential moving averages. Positive MACD = improving trend, Negative MACD = declining trend.
Analysis powered by HoopSci’s advanced metrics and MACD trending indicators.