Ohio Valley Update: Week 7
December 23, 2025The Ohio Valley enters Week 7 with teams showing diverse trending patterns. This analysis examines each team’s performance trends using MACD (Moving Average Convergence Divergence) indicators to identify not just where teams stand, but where they’re headed.
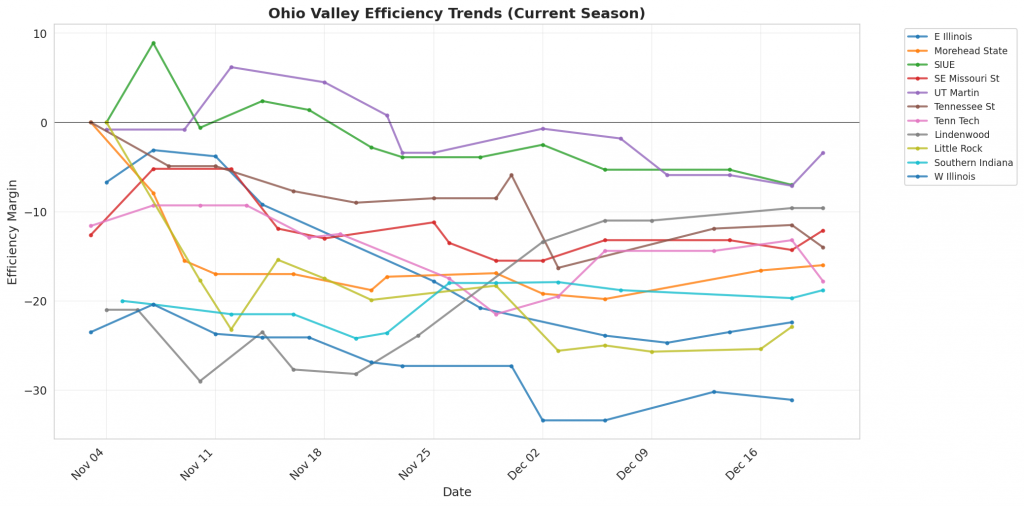
Figure 1: Efficiency margin trends for Ohio Valley teams throughout the season. Teams trending upward show improving performance, while downward trends indicate struggles.
Conference Snapshot
- Week Dates: December 15 – December 21, 2025
- Trending Up (Efficiency): E Illinois, SIUE, SE Missouri St, UT Martin, Tenn Tech
- Trending Down (Efficiency): Morehead State, Tennessee St, Little Rock, Southern Indiana, W Illinois
Team-by-Team Analysis
E Illinois
Record: 2-8 | Elo: 1377.9 (ranked 333 of 365) | Efficiency Margin: -22.39 (ranked 333 of 365)
Offensive Trends:
- FT Rate (FTA/FGA (%)): Currently ranked 256 of 365 in D1. Trending down strongly 🔴.
- FTA Per Poss (Free Throw Attempts Per Possession (%)): Currently ranked 296 of 365 in D1. Trending down strongly 🔴.
Defensive Trends:
- Def Reb Pct (Defensive Rebounding): Currently ranked 350 of 365 in D1. Trending down strongly 🔴.
- Opp FGM Per Poss (Opp FG Makes Per Possession (%)): Currently ranked 322 of 365 in D1. Trending up strongly 🔴.
Lindenwood
Record: 8-4 | Elo: 1445.4 (ranked 256 of 365) | Efficiency Margin: -9.61 (ranked 242 of 365)
Offensive Trends:
- Shooting (Shooting): Currently ranked 296 of 365 in D1. Trending up strongly 🟢.
- Off Reb Pct (Offensive Rebounding): Currently ranked 140 of 365 in D1. Trending up strongly 🟢.
Defensive Trends:
- Def Reb Pct (Defensive Rebounding): Currently ranked 159 of 365 in D1. Trending up strongly 🟢.
- Opp 2Pt Rate (Opp 2 Point Attempts/FGA (%)): Currently ranked 291 of 365 in D1. Trending up strongly 🔴.
Little Rock
Record: 3-9 | Elo: 1446.3 (ranked 255 of 365) | Efficiency Margin: -22.86 (ranked 334 of 365)
Offensive Trends:
- Off Reb Pct (Offensive Rebounding): Currently ranked 185 of 365 in D1. Trending down strongly 🔴.
- FGM Per Poss (Field Goal Makes Per Possession (%)): Currently ranked 291 of 365 in D1. Trending down strongly 🔴.
Defensive Trends:
- Opp Shooting (Opp Shooting): Currently ranked 358 of 365 in D1. Trending up strongly 🔴.
- Def Reb Pct (Defensive Rebounding): Currently ranked 325 of 365 in D1. Trending down strongly 🔴.
Morehead State
Record: 5-7 | Elo: 1454.0 (ranked 249 of 365) | Efficiency Margin: -16.00 (ranked 287 of 365)
Offensive Trends:
- 2Pt Rate (2 Point Attempts/FGA (%)): Currently ranked 39 of 365 in D1. Trending up strongly 🟢.
- 2PA Per Poss (2 Point Attempts Per Possession (%)): Currently ranked 40 of 365 in D1. Trending up strongly 🟢.
Defensive Trends:
- Def Reb Pct (Defensive Rebounding): Currently ranked 340 of 365 in D1. Trending down strongly 🔴.
- Opp FGM Per Poss (Opp FG Makes Per Possession (%)): Currently ranked 216 of 365 in D1. Trending down strongly 🟢.
SE Missouri St
Record: 6-7 | Elo: 1472.5 (ranked 226 of 365) | Efficiency Margin: -12.15 (ranked 262 of 365)
Offensive Trends:
- Turnovers (Turnovers): Currently ranked 248 of 365 in D1. Trending up strongly 🔴.
- Off Reb Pct (Offensive Rebounding): Currently ranked 190 of 365 in D1. Trending up strongly 🟢.
Defensive Trends:
- Opp Shooting (Opp Shooting): Currently ranked 319 of 365 in D1. Trending up strongly 🔴.
- Opp Turnovers (Opp Turnovers): Currently ranked 96 of 365 in D1. Trending down strongly 🟢.
SIUE
Record: 7-5 | Elo: 1499.3 (ranked 188 of 365) | Efficiency Margin: -7.04 (ranked 218 of 365)
Offensive Trends:
- Off Reb Pct (Offensive Rebounding): Currently ranked 222 of 365 in D1. Trending up strongly 🟢.
- FT Rate (FTA/FGA (%)): Currently ranked 289 of 365 in D1. Trending down strongly 🔴.
Defensive Trends:
- Opp Shooting (Opp Shooting): Currently ranked 88 of 365 in D1. Trending up strongly 🔴.
- Opp FG Pct (%) (Opp FGM/FGA (%)): Currently ranked 57 of 365 in D1. Trending up strongly 🔴.
Southern Indiana
Record: 3-9 | Elo: 1318.7 (ranked 362 of 365) | Efficiency Margin: -18.85 (ranked 316 of 365)
Offensive Trends:
- FGM Per Poss (Field Goal Makes Per Possession (%)): Currently ranked 332 of 365 in D1. Trending down strongly 🔴.
- FG Pct (Field Goal Percentage (FGM/FGA)): Currently ranked 354 of 365 in D1. Trending down strongly 🔴.
Defensive Trends:
- Opp 2Pt Rate (Opp 2 Point Attempts/FGA (%)): Currently ranked 361 of 365 in D1. Trending up strongly 🔴.
- Opp 3Pt Rate (Opp 3 Point Attempts/FGA (%)): Currently ranked 5 of 365 in D1. Trending down strongly 🟢.
Tenn Tech
Record: 6-7 | Elo: 1406.7 (ranked 304 of 365) | Efficiency Margin: -17.81 (ranked 308 of 365)
Offensive Trends:
- Off Reb Pct (Offensive Rebounding): Currently ranked 314 of 365 in D1. Trending up strongly 🟢.
- FT Rate (FTA/FGA (%)): Currently ranked 178 of 365 in D1. Trending up strongly 🟢.
Defensive Trends:
- Opp Shooting (Opp Shooting): Currently ranked 262 of 365 in D1. Trending up strongly 🔴.
- Def Reb Pct (Defensive Rebounding): Currently ranked 276 of 365 in D1. Trending down strongly 🔴.
Tennessee St
Record: 7-5 | Elo: 1485.6 (ranked 205 of 365) | Efficiency Margin: -14.03 (ranked 273 of 365)
Offensive Trends:
- Shooting (Shooting): Currently ranked 346 of 365 in D1. Trending down strongly 🔴.
- Turnovers (Turnovers): Currently ranked 269 of 365 in D1. Trending down strongly 🟢.
Defensive Trends:
- Opp Shooting (Opp Shooting): Currently ranked 270 of 365 in D1. Trending up strongly 🔴.
- Opp Turnovers (Opp Turnovers): Currently ranked 15 of 365 in D1. Trending up strongly 🔴.
UT Martin
Record: 9-4 | Elo: 1473.8 (ranked 225 of 365) | Efficiency Margin: -3.36 (ranked 193 of 365)
Offensive Trends:
- Off Reb Pct (Offensive Rebounding): Currently ranked 110 of 365 in D1. Trending up strongly 🟢.
- Adj Off Eff (Adjusted Offensive Efficiency): Currently ranked 204 of 365 in D1. Trending up strongly 🟢.
Defensive Trends:
- Opp 2Pt Rate (Opp 2 Point Attempts/FGA (%)): Currently ranked 210 of 365 in D1. Trending up strongly 🔴.
- Opp 2PM Per Poss (Opp 2 Point Makes Per Possession (%)): Currently ranked 202 of 365 in D1. Trending up strongly 🔴.
W Illinois
Record: 4-8 | Elo: 1382.0 (ranked 328 of 365) | Efficiency Margin: -31.14 (ranked 359 of 365)
Offensive Trends:
- Off Reb Pct (Offensive Rebounding): Currently ranked 240 of 365 in D1. Trending up strongly 🟢.
- 2Pt Rate (2 Point Attempts/FGA (%)): Currently ranked 19 of 365 in D1. Trending up strongly 🟢.
Defensive Trends:
- Opp Shooting (Opp Shooting): Currently ranked 311 of 365 in D1. Trending up strongly 🔴.
- Opp Turnovers (Opp Turnovers): Currently ranked 302 of 365 in D1. Trending up strongly 🔴.
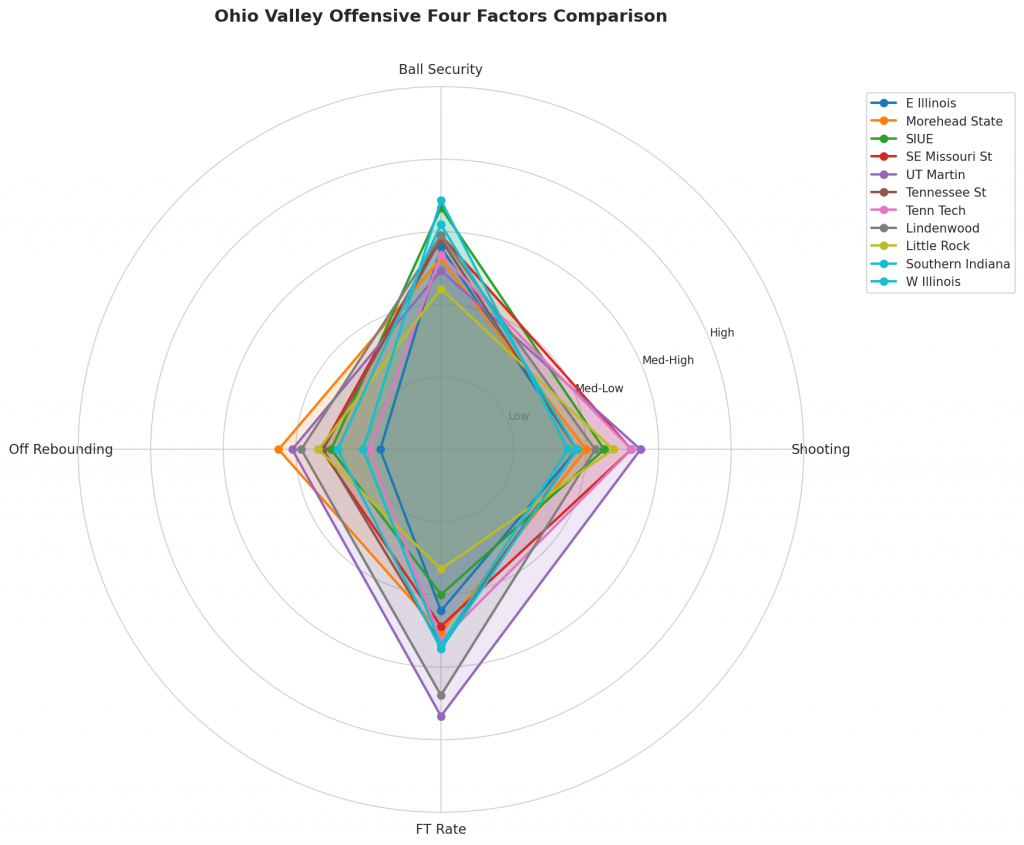
Figure 2: Offensive Four Factors comparison across Ohio Valley teams. The radar chart shows each team’s shooting efficiency (eFG%), ball security (TOV%), offensive rebounding (OREB%), and free throw generation (FT Rate).
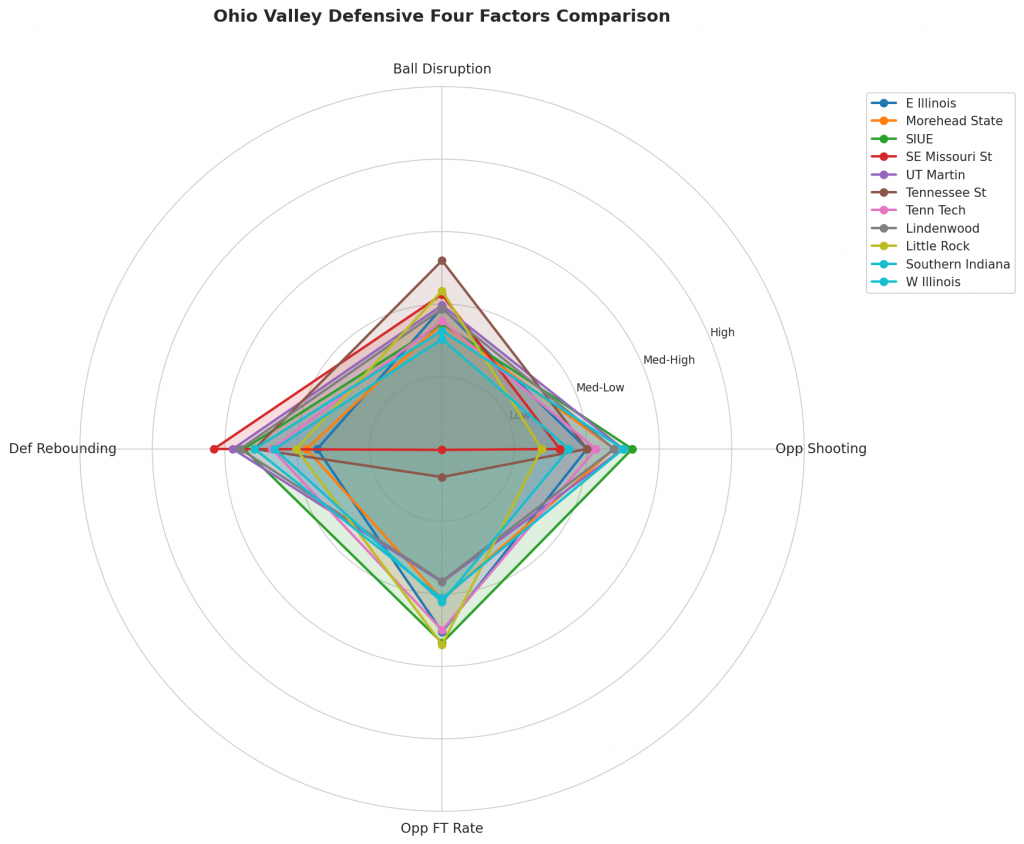
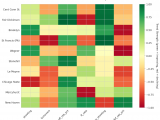
Figure 3: Defensive Four Factors comparison across Ohio Valley teams. The radar chart shows each team’s opponent shooting defense (Opp eFG%), ball disruption (forcing TOV%), defensive rebounding (DREB%), and opponent free throw prevention (Opp FT Rate).
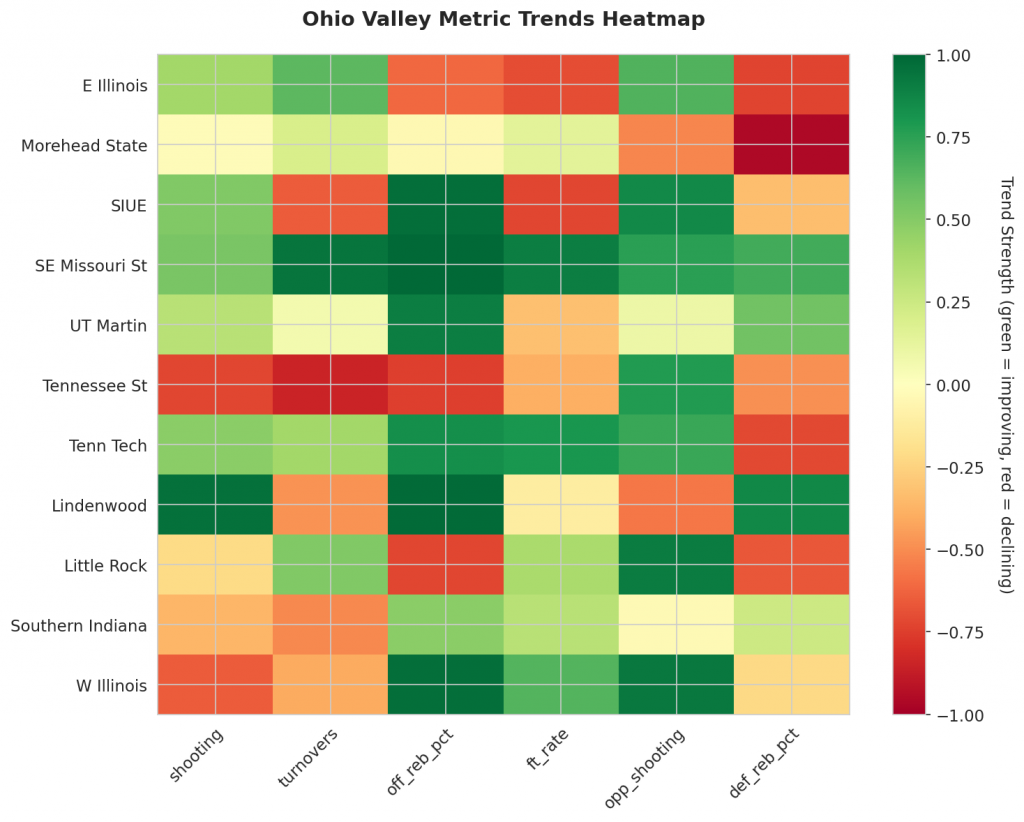
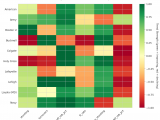
Figure 4: MACD trends heatmap showing which metrics are improving (green) or declining (red) for each team. Stronger colors indicate more pronounced trends.
Looking Ahead
As Ohio Valley teams continue their season, the MACD trending indicators will help identify which teams are genuinely improving versus those riding unsustainable momentum. Check back next week for updated analysis.
Metrics Glossary
Four Factors (Dean Oliver’s framework for basketball success):
- eFG% (Effective Field Goal %): Field goal percentage adjusted for 3-pointers being worth more (FGM + 0.5×3PM) / FGA. Higher is better offensively, lower is better defensively.
- TOV% (Turnover Rate): Turnovers per 100 possessions. Lower is better offensively (taking care of the ball), higher is better defensively (forcing turnovers).
- OREB% / DREB% (Offensive/Defensive Rebound Rate): Percentage of available rebounds grabbed. Offensive rebounds create second-chance points; defensive rebounds end opponent possessions.
- FTR (Free Throw Rate): Free throws made per field goal attempt (FTM/FGA). Measures ability to get to the line AND convert. Higher is better offensively, lower is better defensively.
Other Metrics:
- Elo Rating: Chess-style rating system that updates based on game results and opponent strength. Higher Elo indicates stronger team.
- Efficiency Margin: Point differential per 100 possessions (Offensive Efficiency – Defensive Efficiency). Accounts for pace of play.
- MACD (Moving Average Convergence Divergence): Trend indicator comparing 12-game and 26-game exponential moving averages. Positive MACD = improving trend, Negative MACD = declining trend.
Analysis powered by HoopSci’s advanced metrics and MACD trending indicators.