Missouri Valley Update: Week 10
January 12, 2026The Missouri Valley enters Week 10 with teams showing diverse trending patterns. This analysis examines each team’s performance trends using MACD (Moving Average Convergence Divergence) indicators to identify not just where teams stand, but where they’re headed.
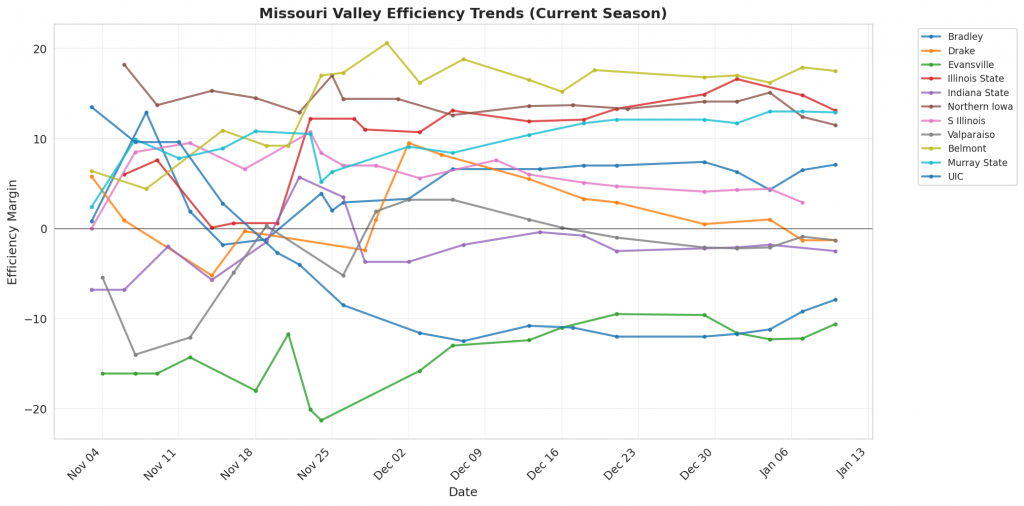
Figure 1: Efficiency margin trends for Missouri Valley teams throughout the season. Teams trending upward show improving performance, while downward trends indicate struggles.
Conference Snapshot
- Week Dates: January 05 – January 11, 2026
- Trending Up (Efficiency): Evansville, Valparaiso, Belmont, Murray State
- Trending Down (Efficiency): Bradley, Drake, Illinois State, Indiana State, Northern Iowa
Team-by-Team Analysis
Belmont
Record: 15-3 | Elo: 1651.3 (ranked 33 of 365) | Efficiency Margin: +17.53 (ranked 43 of 365)
Offensive Trends:
- FT Rate (FTA/FGA (%)): Currently ranked 220 of 365 in D1. Trending up strongly 🟢.
- Adj Off Eff (Adjusted Offensive Efficiency): Currently ranked 62 of 365 in D1. Trending up strongly 🟢.
Defensive Trends:
- Opp 2Pt Rate (Opp 2 Point Attempts/FGA (%)): Currently ranked 7 of 365 in D1. Trending down strongly 🟢.
- Opp 2PM Per Poss (Opp 2 Point Makes Per Possession (%)): Currently ranked 2 of 365 in D1. Trending down strongly 🟢.
Bradley
Record: 12-6 | Elo: 1632.3 (ranked 50 of 365) | Efficiency Margin: +7.05 (ranked 112 of 365)
Offensive Trends:
- Shooting (Shooting): Currently ranked 188 of 365 in D1. Trending down strongly 🔴.
- Turnovers (Turnovers): Currently ranked 19 of 365 in D1. Trending down strongly 🟢.
Defensive Trends:
- Opp 2PA Per Poss (Opp 2 Point Attempts Per Possession (%)): Currently ranked 45 of 365 in D1. Trending down strongly 🟢.
- Opp Off Tempo (Opp Offensive Possessions Per Game): Currently ranked 143 of 365 in D1. Trending up strongly 🔴.
Drake
Record: 6-9 | Elo: 1606.4 (ranked 63 of 365) | Efficiency Margin: -1.28 (ranked 171 of 365)
Offensive Trends:
- Turnovers (Turnovers): Currently ranked 46 of 365 in D1. Trending up strongly 🔴.
- Off Reb Pct (Offensive Rebounding): Currently ranked 322 of 365 in D1. Trending down strongly 🔴.
Defensive Trends:
- Opp Shooting (Opp Shooting): Currently ranked 222 of 365 in D1. Trending up strongly 🔴.
- Def Reb Pct (Defensive Rebounding): Currently ranked 207 of 365 in D1. Trending down strongly 🔴.
Evansville
Record: 5-13 | Elo: 1396.2 (ranked 308 of 365) | Efficiency Margin: -10.58 (ranked 253 of 365)
Offensive Trends:
- Turnovers (Turnovers): Currently ranked 331 of 365 in D1. Trending up strongly 🔴.
- Off Reb Pct (Offensive Rebounding): Currently ranked 336 of 365 in D1. Trending down strongly 🔴.
Defensive Trends:
- Def Reb Pct (Defensive Rebounding): Currently ranked 185 of 365 in D1. Trending up strongly 🟢.
- Opp 3PM Per Poss (Opp 3 Point Makes Per Possession (%)): Currently ranked 303 of 365 in D1. Trending down strongly 🟢.
Illinois State
Record: 12-5 | Elo: 1562.0 (ranked 104 of 365) | Efficiency Margin: +13.11 (ranked 72 of 365)
Offensive Trends:
- Shooting (Shooting): Currently ranked 68 of 365 in D1. Trending down strongly 🔴.
- FGM Per Poss (Field Goal Makes Per Possession (%)): Currently ranked 60 of 365 in D1. Trending down strongly 🔴.
Defensive Trends:
- Opp Shooting (Opp Shooting): Currently ranked 73 of 365 in D1. Trending down strongly 🟢.
- Opp Turnovers (Opp Turnovers): Currently ranked 153 of 365 in D1. Trending up strongly 🔴.
Indiana State
Record: 8-9 | Elo: 1499.5 (ranked 190 of 365) | Efficiency Margin: -2.55 (ranked 184 of 365)
Offensive Trends:
- Off Reb Pct (Offensive Rebounding): Currently ranked 351 of 365 in D1. Trending down strongly 🔴.
- Adj Off Eff (Adjusted Offensive Efficiency): Currently ranked 264 of 365 in D1. Trending down strongly 🔴.
Defensive Trends:
- Def Reb Pct (Defensive Rebounding): Currently ranked 221 of 365 in D1. Trending up strongly 🟢.
- Opp FT Rate (Opp FTA/FGA (%)): Currently ranked 14 of 365 in D1. Trending down strongly 🟢.
Murray State
Record: 15-3 | Elo: 1592.5 (ranked 76 of 365) | Efficiency Margin: +12.88 (ranked 76 of 365)
Offensive Trends:
- Shooting (Shooting): Currently ranked 34 of 365 in D1. Trending up strongly 🟢.
- Adj Off Eff (Adjusted Offensive Efficiency): Currently ranked 52 of 365 in D1. Trending up strongly 🟢.
Defensive Trends:
- Opp 2Pt Rate (Opp 2 Point Attempts/FGA (%)): Currently ranked 365 of 365 in D1. Trending up strongly 🔴.
- Opp 2PA Per Poss (Opp 2 Point Attempts Per Possession (%)): Currently ranked 365 of 365 in D1. Trending up strongly 🔴.
Northern Iowa
Record: 12-5 | Elo: 1584.1 (ranked 85 of 365) | Efficiency Margin: +11.47 (ranked 79 of 365)
Offensive Trends:
- FT Rate (FTA/FGA (%)): Currently ranked 331 of 365 in D1. Trending down strongly 🔴.
- FGA Per Poss (Field Goal Attempts Per Possession (%)): Currently ranked 147 of 365 in D1. Trending up strongly 🟢.
Defensive Trends:
- Opp Turnovers (Opp Turnovers): Currently ranked 134 of 365 in D1. Trending down strongly 🟢.
- Def Reb Pct (Defensive Rebounding): Currently ranked 20 of 365 in D1. Trending up strongly 🟢.
S Illinois
Record: 8-9 | Elo: 1500.8 (ranked 188 of 365) | Efficiency Margin: +2.90 (ranked 137 of 365)
Offensive Trends:
- Turnovers (Turnovers): Currently ranked 280 of 365 in D1. Trending up strongly 🔴.
- 3PM Per Poss (3 Point Makes Per Possession (%)): Currently ranked 364 of 365 in D1. Trending down strongly 🔴.
Defensive Trends:
- Opp 2Pt Rate (Opp 2 Point Attempts/FGA (%)): Currently ranked 171 of 365 in D1. Trending up strongly 🔴.
- Opp 2PA Per Poss (Opp 2 Point Attempts Per Possession (%)): Currently ranked 181 of 365 in D1. Trending up strongly 🔴.
UIC
Record: 7-10 | Elo: 1451.6 (ranked 249 of 365) | Efficiency Margin: -7.92 (ranked 226 of 365)
Offensive Trends:
- Shooting (Shooting): Currently ranked 315 of 365 in D1. Trending down strongly 🔴.
- Off Reb Pct (Offensive Rebounding): Currently ranked 39 of 365 in D1. Trending up strongly 🟢.
Defensive Trends:
- Opp Shooting (Opp Shooting): Currently ranked 126 of 365 in D1. Trending down strongly 🟢.
- Opp Turnovers (Opp Turnovers): Currently ranked 79 of 365 in D1. Trending up strongly 🔴.
Valparaiso
Record: 8-9 | Elo: 1442.1 (ranked 261 of 365) | Efficiency Margin: -1.26 (ranked 170 of 365)
Offensive Trends:
- Turnovers (Turnovers): Currently ranked 96 of 365 in D1. Trending up strongly 🔴.
- FT Rate (FTA/FGA (%)): Currently ranked 58 of 365 in D1. Trending up strongly 🟢.
Defensive Trends:
- Def Reb Pct (Defensive Rebounding): Currently ranked 197 of 365 in D1. Trending down strongly 🔴.
- Opp FTA Per Poss (Opp Free Throw Attempts Per Possession (%)): Currently ranked 307 of 365 in D1. Trending up strongly 🔴.
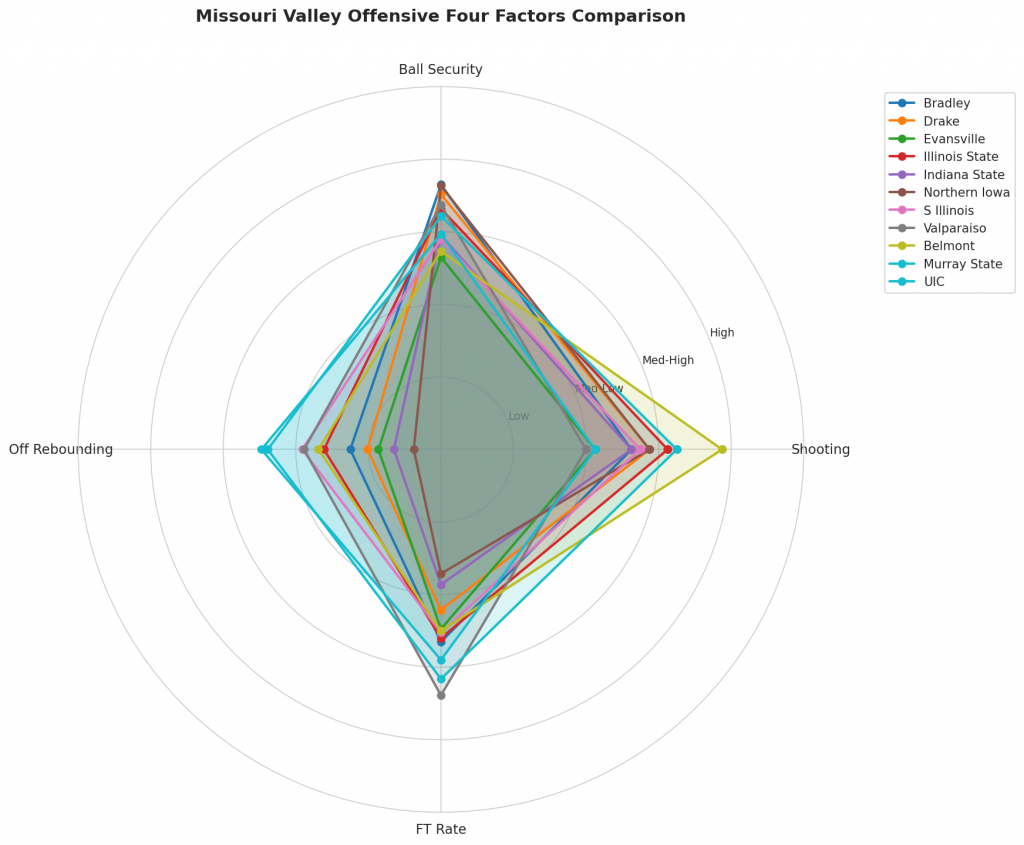
Figure 2: Offensive Four Factors comparison across Missouri Valley teams. The radar chart shows each team’s shooting efficiency (eFG%), ball security (TOV%), offensive rebounding (OREB%), and free throw generation (FT Rate).

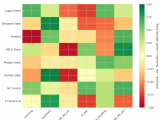
Figure 3: Defensive Four Factors comparison across Missouri Valley teams. The radar chart shows each team’s opponent shooting defense (Opp eFG%), ball disruption (forcing TOV%), defensive rebounding (DREB%), and opponent free throw prevention (Opp FT Rate).
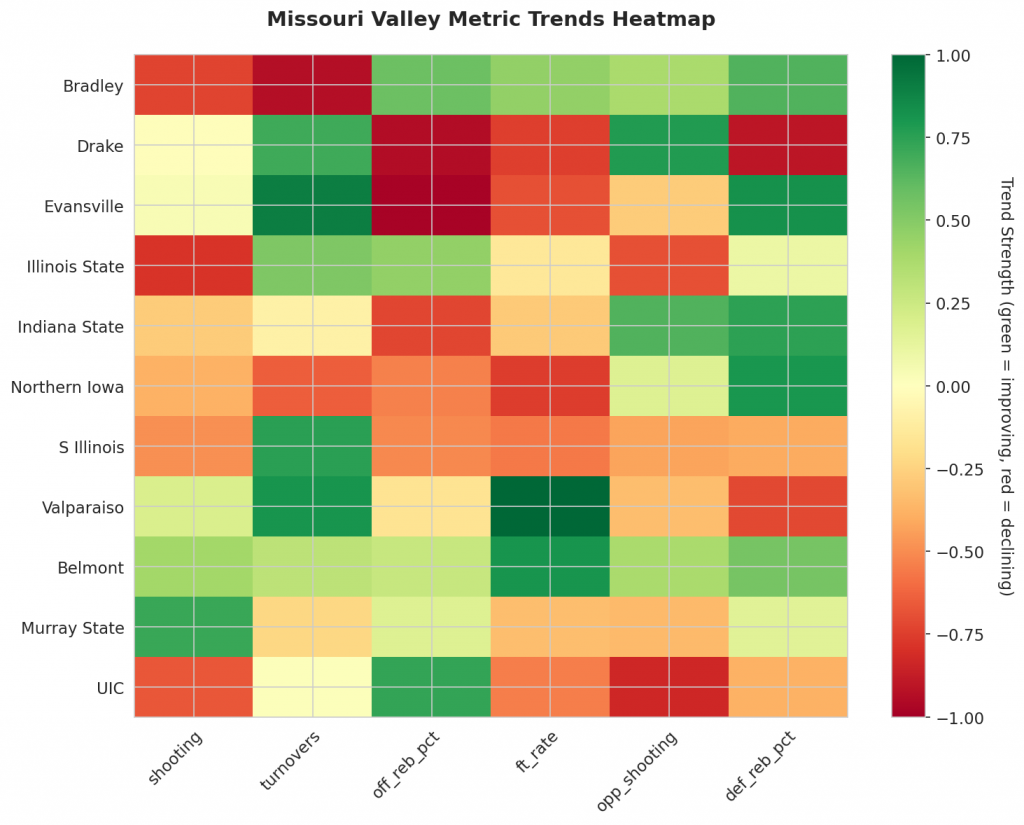
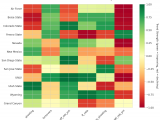
Figure 4: MACD trends heatmap showing which metrics are improving (green) or declining (red) for each team. Stronger colors indicate more pronounced trends.
Looking Ahead
As Missouri Valley teams continue their season, the MACD trending indicators will help identify which teams are genuinely improving versus those riding unsustainable momentum. Check back next week for updated analysis.
Metrics Glossary
Four Factors (Dean Oliver’s framework for basketball success):
- eFG% (Effective Field Goal %): Field goal percentage adjusted for 3-pointers being worth more (FGM + 0.5×3PM) / FGA. Higher is better offensively, lower is better defensively.
- TOV% (Turnover Rate): Turnovers per 100 possessions. Lower is better offensively (taking care of the ball), higher is better defensively (forcing turnovers).
- OREB% / DREB% (Offensive/Defensive Rebound Rate): Percentage of available rebounds grabbed. Offensive rebounds create second-chance points; defensive rebounds end opponent possessions.
- FTR (Free Throw Rate): Free throws made per field goal attempt (FTM/FGA). Measures ability to get to the line AND convert. Higher is better offensively, lower is better defensively.
Other Metrics:
- Elo Rating: Chess-style rating system that updates based on game results and opponent strength. Higher Elo indicates stronger team.
- Efficiency Margin: Point differential per 100 possessions (Offensive Efficiency – Defensive Efficiency). Accounts for pace of play.
- MACD (Moving Average Convergence Divergence): Trend indicator comparing 12-game and 26-game exponential moving averages. Positive MACD = improving trend, Negative MACD = declining trend.
Analysis powered by HoopSci’s advanced metrics and MACD trending indicators.