Summit League Update: Week 10
January 12, 2026The Summit League enters Week 10 with teams showing diverse trending patterns. This analysis examines each team’s performance trends using MACD (Moving Average Convergence Divergence) indicators to identify not just where teams stand, but where they’re headed.
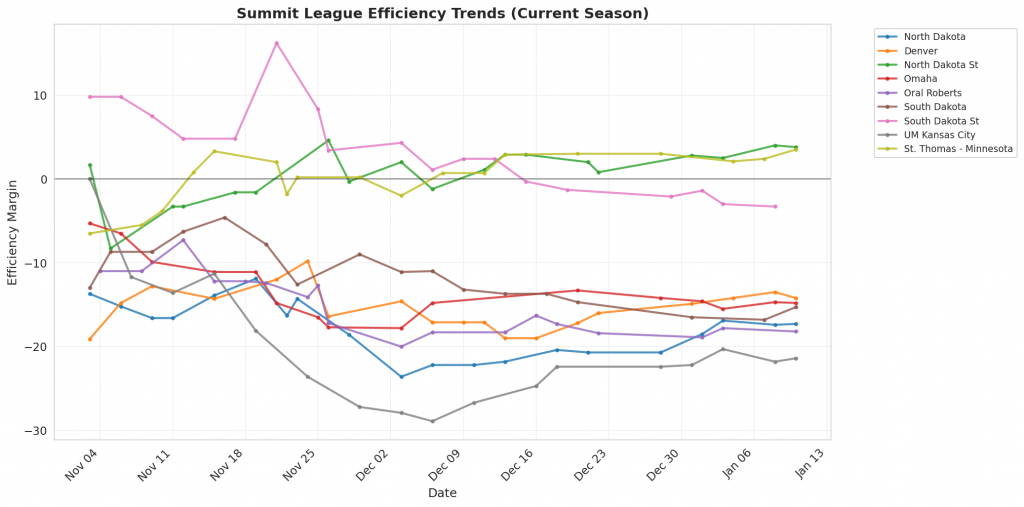
Figure 1: Efficiency margin trends for Summit League teams throughout the season. Teams trending upward show improving performance, while downward trends indicate struggles.
Conference Snapshot
- Week Dates: January 05 – January 11, 2026
- Trending Up (Efficiency): North Dakota, Denver, North Dakota St, Omaha, South Dakota
- Trending Down (Efficiency): Oral Roberts
Team-by-Team Analysis
Denver
Record: 8-11 | Elo: 1400.2 (ranked 304 of 365) | Efficiency Margin: -14.16 (ranked 274 of 365)
Offensive Trends:
- Turnovers (Turnovers): Currently ranked 56 of 365 in D1. Trending down strongly 🟢.
- Adj Off Eff (Adjusted Offensive Efficiency): Currently ranked 118 of 365 in D1. Trending up strongly 🟢.
Defensive Trends:
- Opp Turnovers (Opp Turnovers): Currently ranked 332 of 365 in D1. Trending down strongly 🟢.
- Opp FT Rate (Opp FTA/FGA (%)): Currently ranked 230 of 365 in D1. Trending down strongly 🟢.
North Dakota
Record: 9-11 | Elo: 1416.5 (ranked 290 of 365) | Efficiency Margin: -17.33 (ranked 302 of 365)
Offensive Trends:
- Turnovers (Turnovers): Currently ranked 84 of 365 in D1. Trending down strongly 🟢.
- Off Reb Pct (Offensive Rebounding): Currently ranked 251 of 365 in D1. Trending up strongly 🟢.
Defensive Trends:
- Opp Turnovers (Opp Turnovers): Currently ranked 30 of 365 in D1. Trending up strongly 🔴.
- Def Reb Pct (Defensive Rebounding): Currently ranked 262 of 365 in D1. Trending down strongly 🔴.
North Dakota St
Record: 14-5 | Elo: 1575.7 (ranked 91 of 365) | Efficiency Margin: +3.77 (ranked 130 of 365)
Offensive Trends:
- Off Reb Pct (Offensive Rebounding): Currently ranked 49 of 365 in D1. Trending up strongly 🟢.
- FGM Per Poss (Field Goal Makes Per Possession (%)): Currently ranked 72 of 365 in D1. Trending up strongly 🟢.
Defensive Trends:
- Opp Turnovers (Opp Turnovers): Currently ranked 36 of 365 in D1. Trending up strongly 🔴.
- Opp FGA Per Poss (Opp FG Attempts Per Possession (%)): Currently ranked 79 of 365 in D1. Trending down strongly 🟢.
Omaha
Record: 5-11 | Elo: 1463.0 (ranked 238 of 365) | Efficiency Margin: -14.76 (ranked 281 of 365)
Offensive Trends:
- Off Reb Pct (Offensive Rebounding): Currently ranked 339 of 365 in D1. Trending down strongly 🔴.
- FGA Per Poss (Field Goal Attempts Per Possession (%)): Currently ranked 313 of 365 in D1. Trending down strongly 🔴.
Defensive Trends:
- Opp Turnovers (Opp Turnovers): Currently ranked 333 of 365 in D1. Trending down strongly 🟢.
- Opp FGM Per Poss (Opp FG Makes Per Possession (%)): Currently ranked 305 of 365 in D1. Trending up strongly 🔴.
Oral Roberts
Record: 5-13 | Elo: 1342.4 (ranked 354 of 365) | Efficiency Margin: -18.24 (ranked 311 of 365)
Offensive Trends:
- 3Pt Pct (3 Point FGM/FGA (%)): Currently ranked 230 of 365 in D1. Trending down strongly 🔴.
- FT Pct (FTM/FTA (%)): Currently ranked 91 of 365 in D1. Trending down strongly 🔴.
Defensive Trends:
- Opp Shooting (Opp Shooting): Currently ranked 277 of 365 in D1. Trending down strongly 🟢.
- Def Reb Pct (Defensive Rebounding): Currently ranked 354 of 365 in D1. Trending down strongly 🔴.
South Dakota
Record: 8-9 | Elo: 1450.4 (ranked 250 of 365) | Efficiency Margin: -15.28 (ranked 285 of 365)
Offensive Trends:
- Shooting (Shooting): Currently ranked 248 of 365 in D1. Trending up strongly 🟢.
- Turnovers (Turnovers): Currently ranked 282 of 365 in D1. Trending up strongly 🔴.
Defensive Trends:
- Opp Shooting (Opp Shooting): Currently ranked 346 of 365 in D1. Trending up strongly 🔴.
- Opp FGM Per Poss (Opp FG Makes Per Possession (%)): Currently ranked 356 of 365 in D1. Trending up strongly 🔴.
South Dakota St
Record: 9-9 | Elo: 1518.1 (ranked 156 of 365) | Efficiency Margin: -3.29 (ranked 193 of 365)
Offensive Trends:
- Turnovers (Turnovers): Currently ranked 212 of 365 in D1. Trending down moderately 🟢.
- FGM Per Poss (Field Goal Makes Per Possession (%)): Currently ranked 142 of 365 in D1. Trending up moderately 🟢.
Defensive Trends:
- Def Reb Pct (Defensive Rebounding): Currently ranked 130 of 365 in D1. Trending down strongly 🔴.
- Opp FGM Per Poss (Opp FG Makes Per Possession (%)): Currently ranked 161 of 365 in D1. Trending up strongly 🔴.
St. Thomas – Minnesota
Record: 14-4 | Elo: 1584.4 (ranked 84 of 365) | Efficiency Margin: +3.49 (ranked 133 of 365)
Offensive Trends:
- Turnovers (Turnovers): Currently ranked 7 of 365 in D1. Trending down strongly 🟢.
- Off Reb Pct (Offensive Rebounding): Currently ranked 363 of 365 in D1. Trending up strongly 🟢.
Defensive Trends:
- Def Reb Pct (Defensive Rebounding): Currently ranked 61 of 365 in D1. Trending up moderately 🟢.
- Opp FT Rate (Opp FTA/FGA (%)): Currently ranked 97 of 365 in D1. Trending up moderately 🔴.
UM Kansas City
Record: 3-14 | Elo: 1344.7 (ranked 352 of 365) | Efficiency Margin: -21.44 (ranked 331 of 365)
Offensive Trends:
- Shooting (Shooting): Currently ranked 307 of 365 in D1. Trending up strongly 🟢.
- Off Reb Pct (Offensive Rebounding): Currently ranked 227 of 365 in D1. Trending up strongly 🟢.
Defensive Trends:
- Opp Shooting (Opp Shooting): Currently ranked 314 of 365 in D1. Trending up strongly 🔴.
- Opp Turnovers (Opp Turnovers): Currently ranked 179 of 365 in D1. Trending down strongly 🟢.
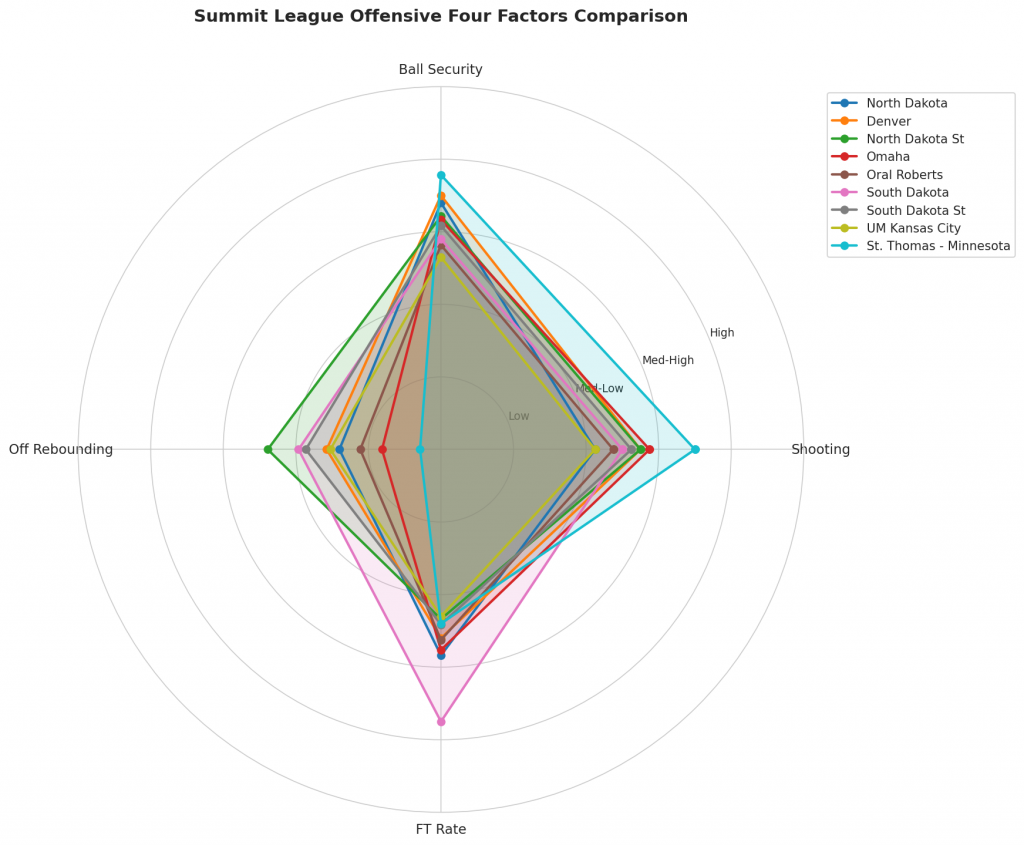
Figure 2: Offensive Four Factors comparison across Summit League teams. The radar chart shows each team’s shooting efficiency (eFG%), ball security (TOV%), offensive rebounding (OREB%), and free throw generation (FT Rate).
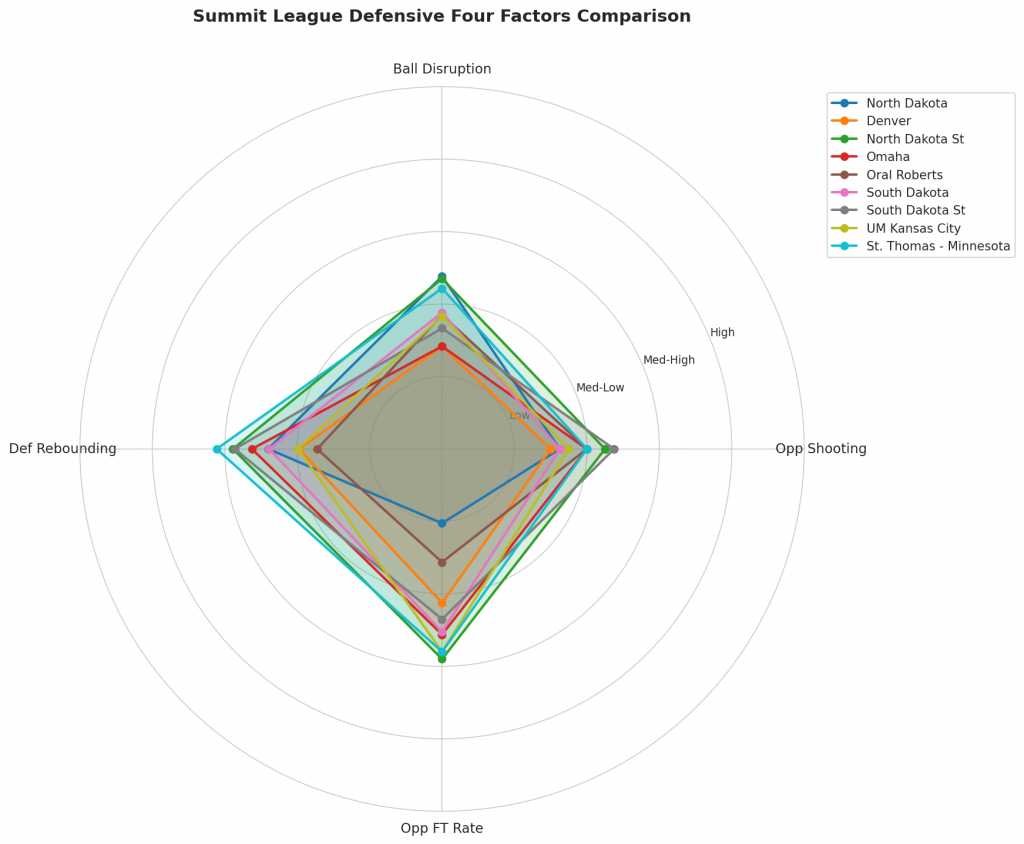
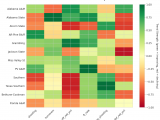
Figure 3: Defensive Four Factors comparison across Summit League teams. The radar chart shows each team’s opponent shooting defense (Opp eFG%), ball disruption (forcing TOV%), defensive rebounding (DREB%), and opponent free throw prevention (Opp FT Rate).
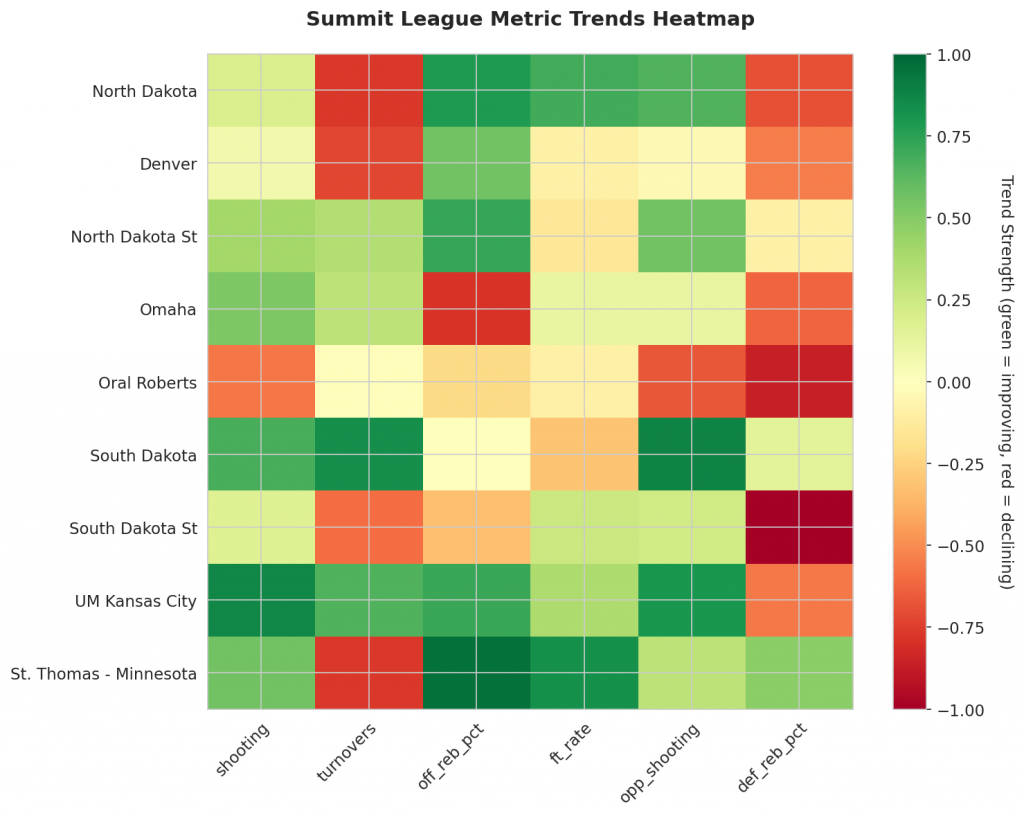
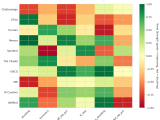
Figure 4: MACD trends heatmap showing which metrics are improving (green) or declining (red) for each team. Stronger colors indicate more pronounced trends.
Looking Ahead
As Summit League teams continue their season, the MACD trending indicators will help identify which teams are genuinely improving versus those riding unsustainable momentum. Check back next week for updated analysis.
Metrics Glossary
Four Factors (Dean Oliver’s framework for basketball success):
- eFG% (Effective Field Goal %): Field goal percentage adjusted for 3-pointers being worth more (FGM + 0.5×3PM) / FGA. Higher is better offensively, lower is better defensively.
- TOV% (Turnover Rate): Turnovers per 100 possessions. Lower is better offensively (taking care of the ball), higher is better defensively (forcing turnovers).
- OREB% / DREB% (Offensive/Defensive Rebound Rate): Percentage of available rebounds grabbed. Offensive rebounds create second-chance points; defensive rebounds end opponent possessions.
- FTR (Free Throw Rate): Free throws made per field goal attempt (FTM/FGA). Measures ability to get to the line AND convert. Higher is better offensively, lower is better defensively.
Other Metrics:
- Elo Rating: Chess-style rating system that updates based on game results and opponent strength. Higher Elo indicates stronger team.
- Efficiency Margin: Point differential per 100 possessions (Offensive Efficiency – Defensive Efficiency). Accounts for pace of play.
- MACD (Moving Average Convergence Divergence): Trend indicator comparing 12-game and 26-game exponential moving averages. Positive MACD = improving trend, Negative MACD = declining trend.
Analysis powered by HoopSci’s advanced metrics and MACD trending indicators.