Southern Update: Week 11
January 19, 2026The Southern enters Week 11 with teams showing diverse trending patterns. This analysis examines each team’s performance trends using MACD (Moving Average Convergence Divergence) indicators to identify not just where teams stand, but where they’re headed.
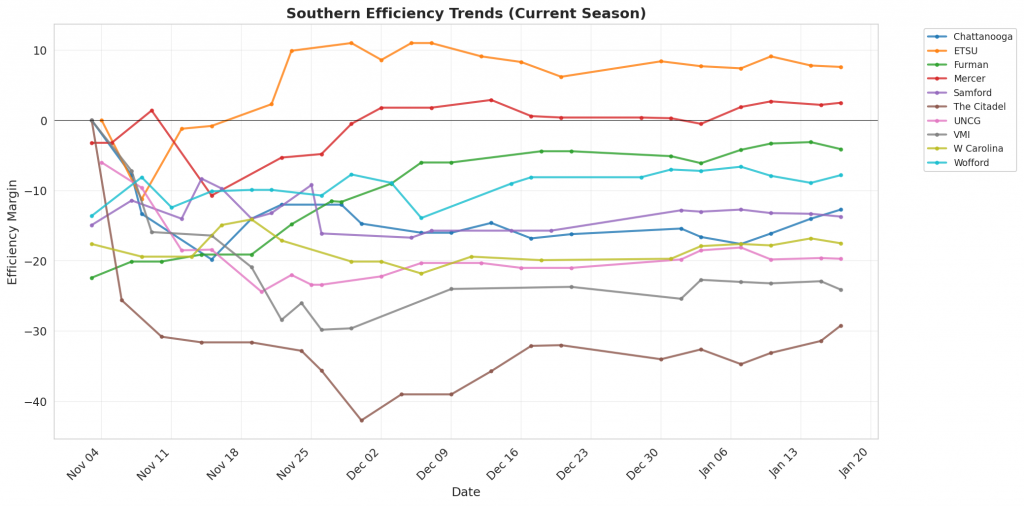
Figure 1: Efficiency margin trends for Southern teams throughout the season. Teams trending upward show improving performance, while downward trends indicate struggles.
Conference Snapshot
- Week Dates: January 12 – January 18, 2026
- Trending Up (Efficiency): Chattanooga, ETSU, Mercer, Samford, The Citadel
- Trending Down (Efficiency): Furman, VMI
Team-by-Team Analysis
Chattanooga
Record: 9-10 | Elo: 1572.6 (ranked 91 of 365) | Efficiency Margin: -12.73 (ranked 267 of 365)
Offensive Trends:
- Off Reb Pct (Offensive Rebounding): Currently ranked 362 of 365 in D1. Trending down strongly 🔴.
- 2PM Per Poss (2 Point Makes Per Possession (%)): Currently ranked 337 of 365 in D1. Trending down strongly 🔴.
Defensive Trends:
- Opp Turnovers (Opp Turnovers): Currently ranked 303 of 365 in D1. Trending down strongly 🟢.
- Opp FT Rate (Opp FTA/FGA (%)): Currently ranked 333 of 365 in D1. Trending up strongly 🔴.
ETSU
Record: 13-6 | Elo: 1546.7 (ranked 119 of 365) | Efficiency Margin: +7.62 (ranked 100 of 365)
Offensive Trends:
- Shooting (Shooting): Currently ranked 43 of 365 in D1. Trending up strongly 🟢.
- Turnovers (Turnovers): Currently ranked 97 of 365 in D1. Trending down strongly 🟢.
Defensive Trends:
- Opp 2Pt Rate (Opp 2 Point Attempts/FGA (%)): Currently ranked 15 of 365 in D1. Trending down strongly 🟢.
- Opp 3Pt Rate (Opp 3 Point Attempts/FGA (%)): Currently ranked 351 of 365 in D1. Trending up strongly 🔴.
Furman
Record: 13-6 | Elo: 1586.5 (ranked 80 of 365) | Efficiency Margin: -4.05 (ranked 194 of 365)
Offensive Trends:
- Assists per FGM (Assists/FGM (%)): Currently ranked 58 of 365 in D1. Trending down strongly 🔴.
- Shooting (Shooting): Currently ranked 84 of 365 in D1. Trending down moderately 🔴.
Defensive Trends:
- Opp Shooting (Opp Shooting): Currently ranked 118 of 365 in D1. Trending down moderately 🟢.
- Opp FT Rate (Opp FTA/FGA (%)): Currently ranked 11 of 365 in D1. Trending down moderately 🟢.
Mercer
Record: 12-7 | Elo: 1506.8 (ranked 172 of 365) | Efficiency Margin: +2.51 (ranked 145 of 365)
Offensive Trends:
- Shooting (Shooting): Currently ranked 69 of 365 in D1. Trending up strongly 🟢.
- Turnovers (Turnovers): Currently ranked 162 of 365 in D1. Trending up strongly 🔴.
Defensive Trends:
- Opp Shooting (Opp Shooting): Currently ranked 256 of 365 in D1. Trending up strongly 🔴.
- Opp 3PM Per Poss (Opp 3 Point Makes Per Possession (%)): Currently ranked 325 of 365 in D1. Trending up strongly 🔴.
Samford
Record: 9-10 | Elo: 1534.6 (ranked 133 of 365) | Efficiency Margin: -13.69 (ranked 275 of 365)
Offensive Trends:
- Turnovers (Turnovers): Currently ranked 3 of 365 in D1. Trending down strongly 🟢.
- Off Reb Pct (Offensive Rebounding): Currently ranked 345 of 365 in D1. Trending down strongly 🔴.
Defensive Trends:
- Opp Turnovers (Opp Turnovers): Currently ranked 357 of 365 in D1. Trending down strongly 🟢.
- Opp FT Rate (Opp FTA/FGA (%)): Currently ranked 89 of 365 in D1. Trending down strongly 🟢.
The Citadel
Record: 5-14 | Elo: 1271.4 (ranked 368 of 365) | Efficiency Margin: -29.23 (ranked 358 of 365)
Offensive Trends:
- FGA Per Poss (Field Goal Attempts Per Possession (%)): Currently ranked 58 of 365 in D1. Trending down strongly 🔴.
- 2PM Per Poss (2 Point Makes Per Possession (%)): Currently ranked 336 of 365 in D1. Trending down strongly 🔴.
Defensive Trends:
- Opp FT Rate (Opp FTA/FGA (%)): Currently ranked 218 of 365 in D1. Trending up moderately 🔴.
- Opp FGM Per Poss (Opp FG Makes Per Possession (%)): Currently ranked 354 of 365 in D1. Trending down moderately 🟢.
UNCG
Record: 7-12 | Elo: 1474.9 (ranked 228 of 365) | Efficiency Margin: -19.72 (ranked 323 of 365)
Offensive Trends:
- 2Pt Rate (2 Point Attempts/FGA (%)): Currently ranked 159 of 365 in D1. Trending up strongly 🟢.
- 2PM Per Poss (2 Point Makes Per Possession (%)): Currently ranked 212 of 365 in D1. Trending up strongly 🟢.
Defensive Trends:
- Opp Shooting (Opp Shooting): Currently ranked 341 of 365 in D1. Trending up strongly 🔴.
- Opp FGM Per Poss (Opp FG Makes Per Possession (%)): Currently ranked 350 of 365 in D1. Trending up strongly 🔴.
VMI
Record: 4-13 | Elo: 1341.8 (ranked 351 of 365) | Efficiency Margin: -24.12 (ranked 347 of 365)
Offensive Trends:
- 2PM Per Poss (2 Point Makes Per Possession (%)): Currently ranked 363 of 365 in D1. Trending down strongly 🔴.
- 2Pt Pct (2 Point FGM/FGA (%)): Currently ranked 334 of 365 in D1. Trending down strongly 🔴.
Defensive Trends:
- Def Reb Pct (Defensive Rebounding): Currently ranked 350 of 365 in D1. Trending down strongly 🔴.
- Opp FT Rate (Opp FTA/FGA (%)): Currently ranked 270 of 365 in D1. Trending up strongly 🔴.
W Carolina
Record: 6-11 | Elo: 1410.4 (ranked 296 of 365) | Efficiency Margin: -17.51 (ranked 311 of 365)
Offensive Trends:
- Turnovers (Turnovers): Currently ranked 246 of 365 in D1. Trending down strongly 🟢.
- Adj Off Eff (Adjusted Offensive Efficiency): Currently ranked 280 of 365 in D1. Trending up strongly 🟢.
Defensive Trends:
- Opp Shooting (Opp Shooting): Currently ranked 344 of 365 in D1. Trending up strongly 🔴.
- Opp 2PM Per Poss (Opp 2 Point Makes Per Possession (%)): Currently ranked 78 of 365 in D1. Trending down strongly 🟢.
Wofford
Record: 12-7 | Elo: 1546.8 (ranked 118 of 365) | Efficiency Margin: -7.79 (ranked 229 of 365)
Offensive Trends:
- Turnovers (Turnovers): Currently ranked 15 of 365 in D1. Trending down strongly 🟢.
- Assists per FGM (Assists/FGM (%)): Currently ranked 132 of 365 in D1. Trending down strongly 🔴.
Defensive Trends:
- Opp Shooting (Opp Shooting): Currently ranked 274 of 365 in D1. Trending up strongly 🔴.
- Opp FG Pct (%) (Opp FGM/FGA (%)): Currently ranked 283 of 365 in D1. Trending up strongly 🔴.
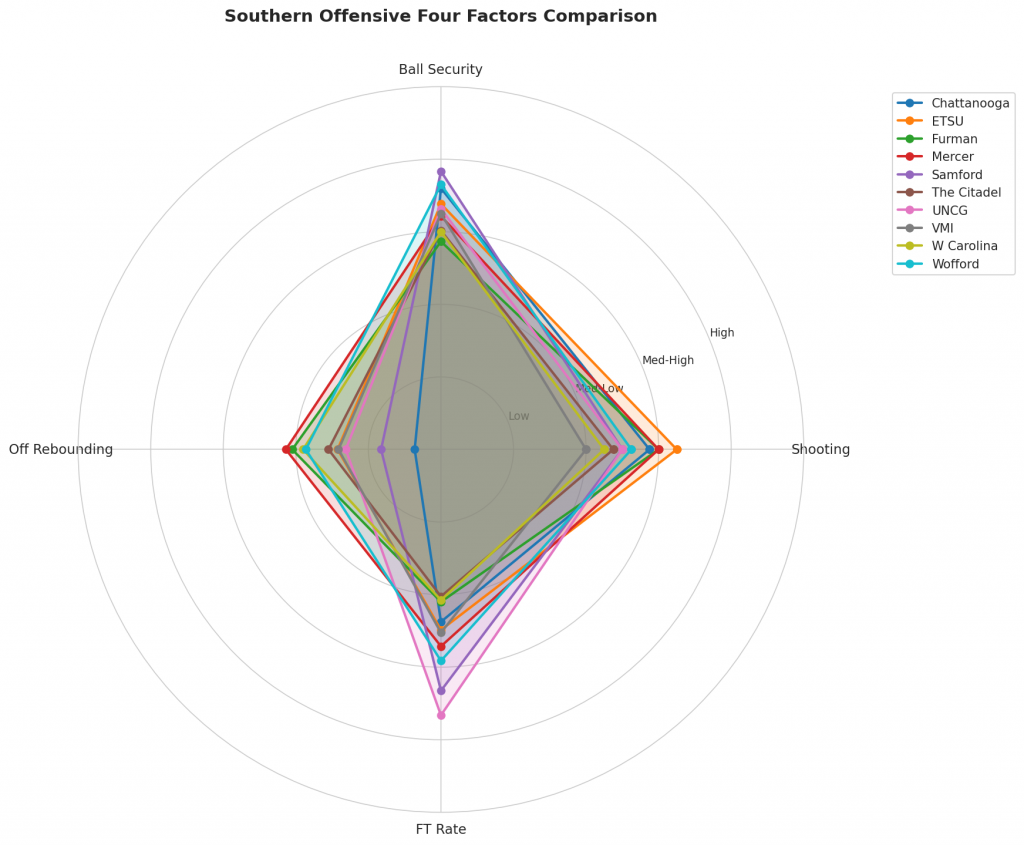
Figure 2: Offensive Four Factors comparison across Southern teams. The radar chart shows each team’s shooting efficiency (eFG%), ball security (TOV%), offensive rebounding (OREB%), and free throw generation (FT Rate).
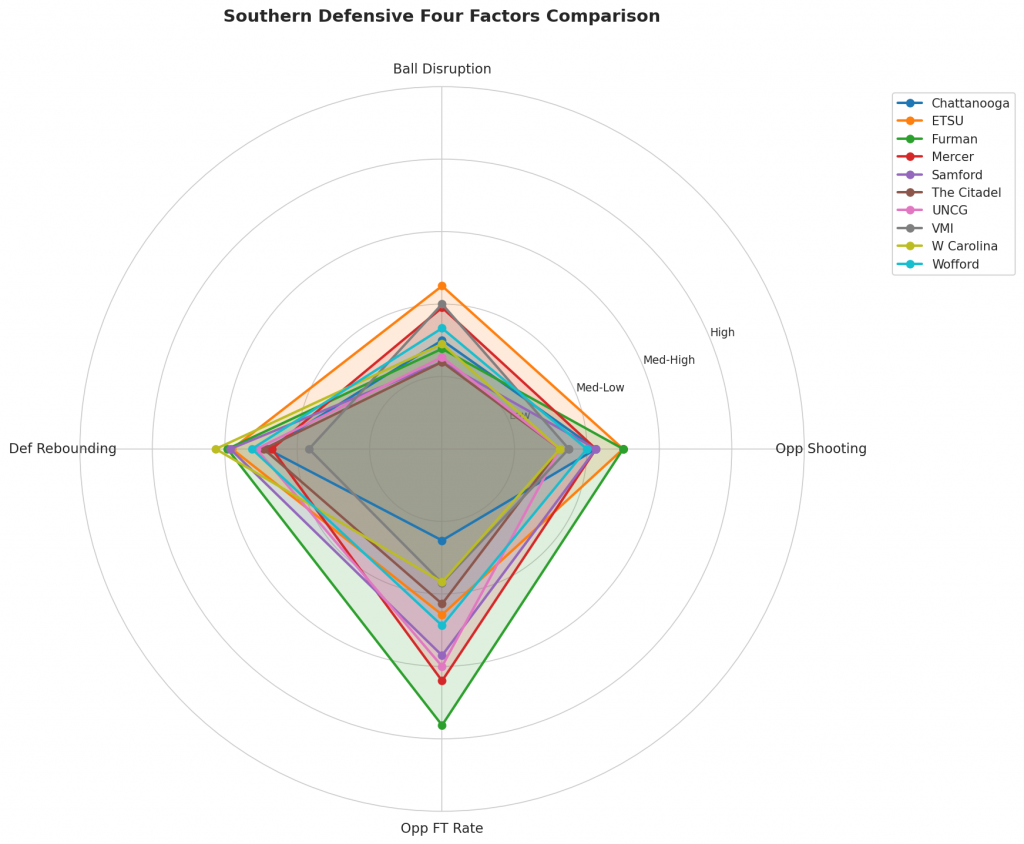
Figure 3: Defensive Four Factors comparison across Southern teams. The radar chart shows each team’s opponent shooting defense (Opp eFG%), ball disruption (forcing TOV%), defensive rebounding (DREB%), and opponent free throw prevention (Opp FT Rate).
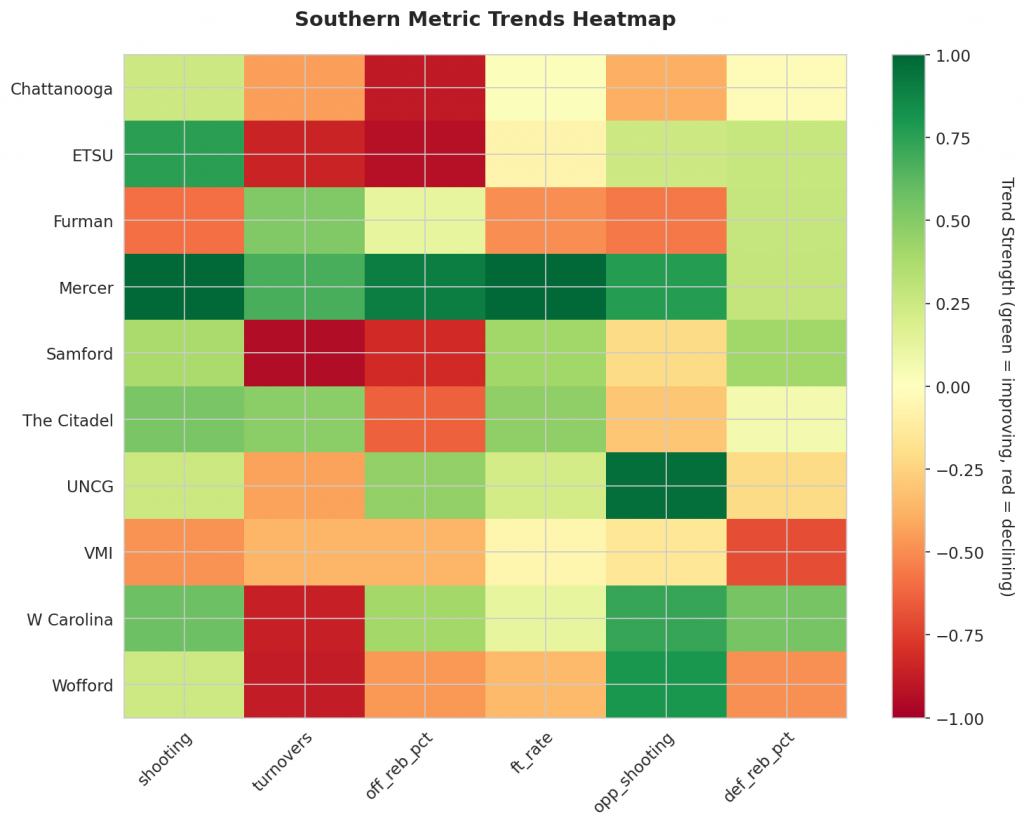
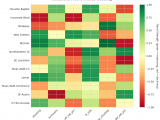
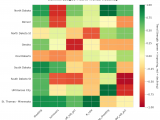
Figure 4: MACD trends heatmap showing which metrics are improving (green) or declining (red) for each team. Stronger colors indicate more pronounced trends.
Looking Ahead
As Southern teams continue their season, the MACD trending indicators will help identify which teams are genuinely improving versus those riding unsustainable momentum. Check back next week for updated analysis.
Metrics Glossary
Four Factors (Dean Oliver’s framework for basketball success):
- eFG% (Effective Field Goal %): Field goal percentage adjusted for 3-pointers being worth more (FGM + 0.5×3PM) / FGA. Higher is better offensively, lower is better defensively.
- TOV% (Turnover Rate): Turnovers per 100 possessions. Lower is better offensively (taking care of the ball), higher is better defensively (forcing turnovers).
- OREB% / DREB% (Offensive/Defensive Rebound Rate): Percentage of available rebounds grabbed. Offensive rebounds create second-chance points; defensive rebounds end opponent possessions.
- FTR (Free Throw Rate): Free throws made per field goal attempt (FTM/FGA). Measures ability to get to the line AND convert. Higher is better offensively, lower is better defensively.
Other Metrics:
- Elo Rating: Chess-style rating system that updates based on game results and opponent strength. Higher Elo indicates stronger team.
- Efficiency Margin: Point differential per 100 possessions (Offensive Efficiency – Defensive Efficiency). Accounts for pace of play.
- MACD (Moving Average Convergence Divergence): Trend indicator comparing 12-game and 26-game exponential moving averages. Positive MACD = improving trend, Negative MACD = declining trend.
Analysis powered by HoopSci’s advanced metrics and MACD trending indicators.