West Coast Update: Week 15
February 16, 2026Strongest Offensive Trends
West Coast Conference: Key Offensive Trends Emerge in Week 15
As the West Coast Conference enters its 15th week of competition, several teams are exhibiting notable trends that could impact their offense. Here are the top key takeaways from the data:
- Gonzaga’s Scoring Efficiency Improves: Gonzaga’s scoring efficiency has shown improvement versus weaker competition.
- Pepperdine’s Off Rebound Percentage is a Problem: This trend is a problem for Pepperdine, as it negatively affects their ability to capitalize on second-chance opportunities versus stronger competition.
- Portland’s Shooting Struggles Continue: Portland’s shooting struggles are a significant issue, making it challenging for them to score consistently against conference opponents.
- Loyola Mary’s Scoring Consistency is a Concern: Loyola Mary’s scoring consistency has been inconsistent versus weaker competition.
Strongest Defensive Trends
- Gonzaga’s Opponent Shooting is collapsing versus stronger competition, indicating a struggle to slow down opponents and may be vulnerable on defense.
- Loyola Mary’s Opponent Shooting is also worsening versus stronger competition, suggesting that they are having trouble containing their opponents’ scoring.
- Pacific’s Opponent Turnovers are worsening versus stronger competition, meaning that they are allowing more turnovers from their opponents, which could be a cause for concern in terms of defensive performance.
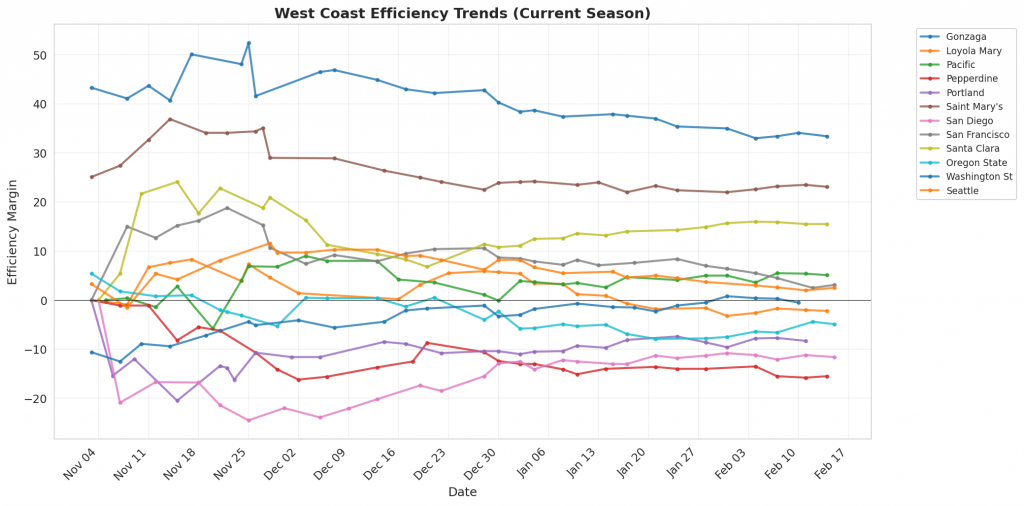
Figure 1: Efficiency margin trends for West Coast teams throughout the season. Teams trending upward show improving performance, while downward trends indicate struggles.
Conference Snapshot
- Week Dates: February 09 – February 15, 2026
- Trending Up (Efficiency): Loyola Mary, Pacific, Pepperdine, Saint Mary’s, San Diego
- Trending Down (Efficiency): Gonzaga, Portland, San Francisco, Oregon State, Seattle
Team-by-Team Analysis
Gonzaga
Record: 25-2 | Elo: 1778.2 (ranked 4 of 365) | Efficiency Margin: +33.44 (ranked 7 of 365)
Offensive Trends:
- Shooting (Shooting): Currently ranked 22 of 365 in D1. Trending down moderately 🔴.
- Turnovers (Turnovers): Currently ranked 27 of 365 in D1. Trending down moderately 🟢.
Defensive Trends:
- Opp Shooting (Opp Shooting): Currently ranked 22 of 365 in D1. Trending up strongly 🔴.
- Def Reb Pct (Defensive Rebounding): Currently ranked 4 of 365 in D1. Trending up strongly 🟢.
Loyola Mary
Record: 13-15 | Elo: 1455.6 (ranked 243 of 365) | Efficiency Margin: -2.19 (ranked 181 of 365)
Offensive Trends:
- Shooting (Shooting): Currently ranked 158 of 365 in D1. Trending up moderately 🟢.
- Turnovers (Turnovers): Currently ranked 225 of 365 in D1. Trending down weakly 🟢.
Defensive Trends:
- Opp Shooting (Opp Shooting): Currently ranked 59 of 365 in D1. Trending up strongly 🔴.
- Opp Turnovers (Opp Turnovers): Currently ranked 190 of 365 in D1. Trending down moderately 🔴.
Oregon State
Record: 14-14 | Elo: 1506.9 (ranked 172 of 365) | Efficiency Margin: -4.88 (ranked 206 of 365)
Offensive Trends:
- Turnovers (Turnovers): Currently ranked 250 of 365 in D1. Trending down moderately 🟢.
- Off Reb Pct (Offensive Rebounding): Currently ranked 326 of 365 in D1. Trending down moderately 🔴.
Defensive Trends:
- Opp Shooting (Opp Shooting): Currently ranked 111 of 365 in D1. Trending down moderately 🟢.
- Def Reb Pct (Defensive Rebounding): Currently ranked 313 of 365 in D1. Trending down moderately 🔴.
Pacific
Record: 17-11 | Elo: 1446.8 (ranked 255 of 365) | Efficiency Margin: +5.06 (ranked 114 of 365)
Offensive Trends:
- Off Reb Pct (Offensive Rebounding): Currently ranked 86 of 365 in D1. Trending down moderately 🔴.
- Shooting (Shooting): Currently ranked 83 of 365 in D1. Trending up weakly 🟢.
Defensive Trends:
- Opp Shooting (Opp Shooting): Currently ranked 75 of 365 in D1. Trending down strongly 🟢.
- Opp Turnovers (Opp Turnovers): Currently ranked 268 of 365 in D1. Trending down strongly 🔴.
Pepperdine
Record: 7-20 | Elo: 1346.3 (ranked 345 of 365) | Efficiency Margin: -15.51 (ranked 294 of 365)
Offensive Trends:
- Off Reb Pct (Offensive Rebounding): Currently ranked 314 of 365 in D1. Trending down strongly 🔴.
- Shooting (Shooting): Currently ranked 335 of 365 in D1. Trending up weakly 🟢.
Defensive Trends:
- Opp Shooting (Opp Shooting): Currently ranked 289 of 365 in D1. Trending up strongly 🔴.
- Def Reb Pct (Defensive Rebounding): Currently ranked 329 of 365 in D1. Trending down moderately 🔴.
Portland
Record: 12-15 | Elo: 1429.3 (ranked 277 of 365) | Efficiency Margin: -8.28 (ranked 239 of 365)
Offensive Trends:
- Shooting (Shooting): Currently ranked 210 of 365 in D1. Trending down strongly 🔴.
- Turnovers (Turnovers): Currently ranked 331 of 365 in D1. Trending up moderately 🔴.
Defensive Trends:
- Opp Turnovers (Opp Turnovers): Currently ranked 121 of 365 in D1. Trending up moderately 🟢.
- Opp Shooting (Opp Shooting): Currently ranked 236 of 365 in D1. Trending down weakly 🟢.
Saint Mary’s
Record: 23-4 | Elo: 1739.2 (ranked 11 of 365) | Efficiency Margin: +23.09 (ranked 31 of 365)
Offensive Trends:
- Turnovers (Turnovers): Currently ranked 150 of 365 in D1. Trending down moderately 🟢.
- Off Reb Pct (Offensive Rebounding): Currently ranked 20 of 365 in D1. Trending down moderately 🔴.
Defensive Trends:
- Opp Shooting (Opp Shooting): Currently ranked 14 of 365 in D1. Trending down moderately 🟢.
- Opp Turnovers (Opp Turnovers): Currently ranked 290 of 365 in D1. Trending up moderately 🟢.
San Diego
Record: 11-17 | Elo: 1371.2 (ranked 331 of 365) | Efficiency Margin: -11.58 (ranked 266 of 365)
Offensive Trends:
- Shooting (Shooting): Currently ranked 196 of 365 in D1. Trending up moderately 🟢.
- Turnovers (Turnovers): Currently ranked 254 of 365 in D1. Trending down moderately 🟢.
Defensive Trends:
- Def Reb Pct (Defensive Rebounding): Currently ranked 350 of 365 in D1. Trending up strongly 🟢.
- Opp Shooting (Opp Shooting): Currently ranked 308 of 365 in D1. Trending up moderately 🔴.
San Francisco
Record: 15-13 | Elo: 1562.7 (ranked 101 of 365) | Efficiency Margin: +3.10 (ranked 128 of 365)
Offensive Trends:
- Shooting (Shooting): Currently ranked 178 of 365 in D1. Trending down moderately 🔴.
- Turnovers (Turnovers): Currently ranked 131 of 365 in D1. Trending down moderately 🟢.
Defensive Trends:
- Opp Shooting (Opp Shooting): Currently ranked 148 of 365 in D1. Trending up strongly 🔴.
- Opp Turnovers (Opp Turnovers): Currently ranked 346 of 365 in D1. Trending down moderately 🔴.
Santa Clara
Record: 22-6 | Elo: 1652.3 (ranked 44 of 365) | Efficiency Margin: +15.46 (ranked 53 of 365)
Offensive Trends:
- Turnovers (Turnovers): Currently ranked 112 of 365 in D1. Trending down strongly 🟢.
- Off Reb Pct (Offensive Rebounding): Currently ranked 26 of 365 in D1. Trending down strongly 🔴.
Defensive Trends:
- Opp Shooting (Opp Shooting): Currently ranked 154 of 365 in D1. Trending up moderately 🔴.
- Opp Turnovers (Opp Turnovers): Currently ranked 16 of 365 in D1. Trending down weakly 🔴.
Seattle
Record: 16-11 | Elo: 1516.6 (ranked 157 of 365) | Efficiency Margin: +2.53 (ranked 138 of 365)
Offensive Trends:
- Off Reb Pct (Offensive Rebounding): Currently ranked 336 of 365 in D1. Trending down strongly 🔴.
- Shooting (Shooting): Currently ranked 236 of 365 in D1. Trending down moderately 🔴.
Defensive Trends:
- Opp Turnovers (Opp Turnovers): Currently ranked 18 of 365 in D1. Trending down strongly 🔴.
- Def Reb Pct (Defensive Rebounding): Currently ranked 212 of 365 in D1. Trending up strongly 🟢.
Washington St
Record: 10-16 | Elo: 1491.3 (ranked 193 of 365) | Efficiency Margin: -0.52 (ranked 167 of 365)
Offensive Trends:
- Turnovers (Turnovers): Currently ranked 326 of 365 in D1. Trending up moderately 🔴.
- Shooting (Shooting): Currently ranked 56 of 365 in D1. Trending up weakly 🟢.
Defensive Trends:
- Opp Turnovers (Opp Turnovers): Currently ranked 328 of 365 in D1. Trending down moderately 🔴.
- Def Reb Pct (Defensive Rebounding): Currently ranked 31 of 365 in D1. Trending down moderately 🔴.
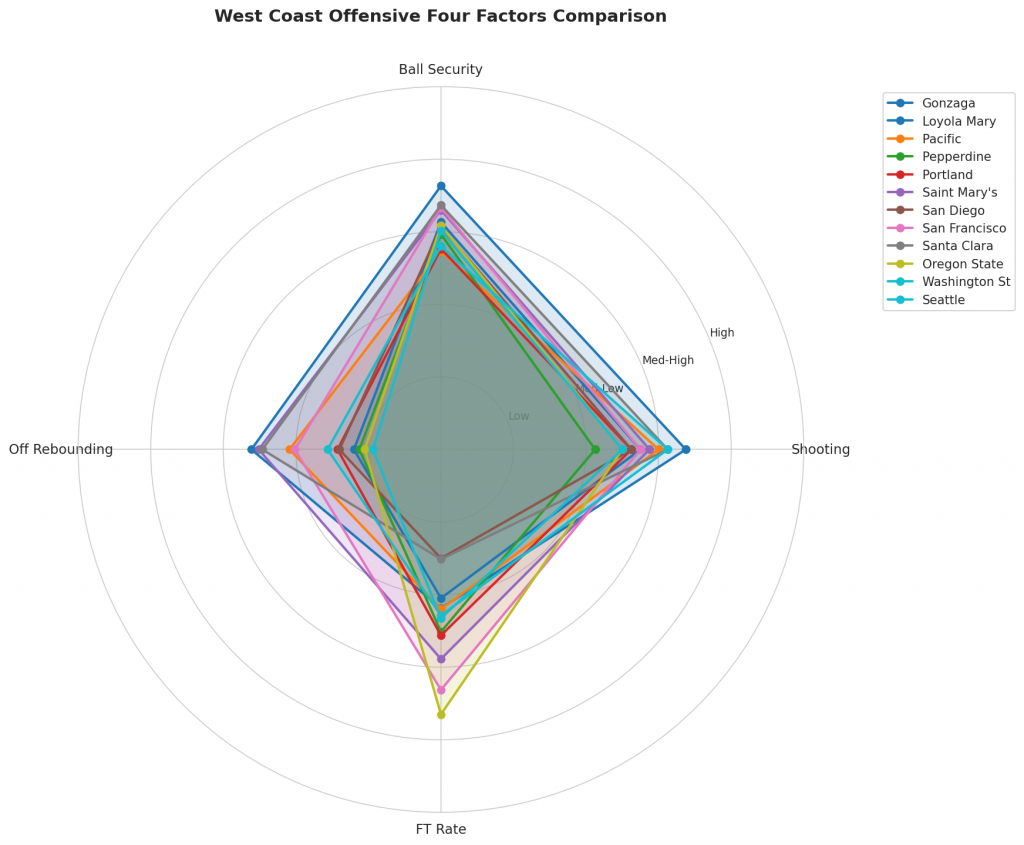
Figure 2: Offensive Four Factors comparison across West Coast teams. The radar chart shows each team’s shooting efficiency (eFG%), ball security (TOV%), offensive rebounding (OREB%), and free throw generation (FT Rate).
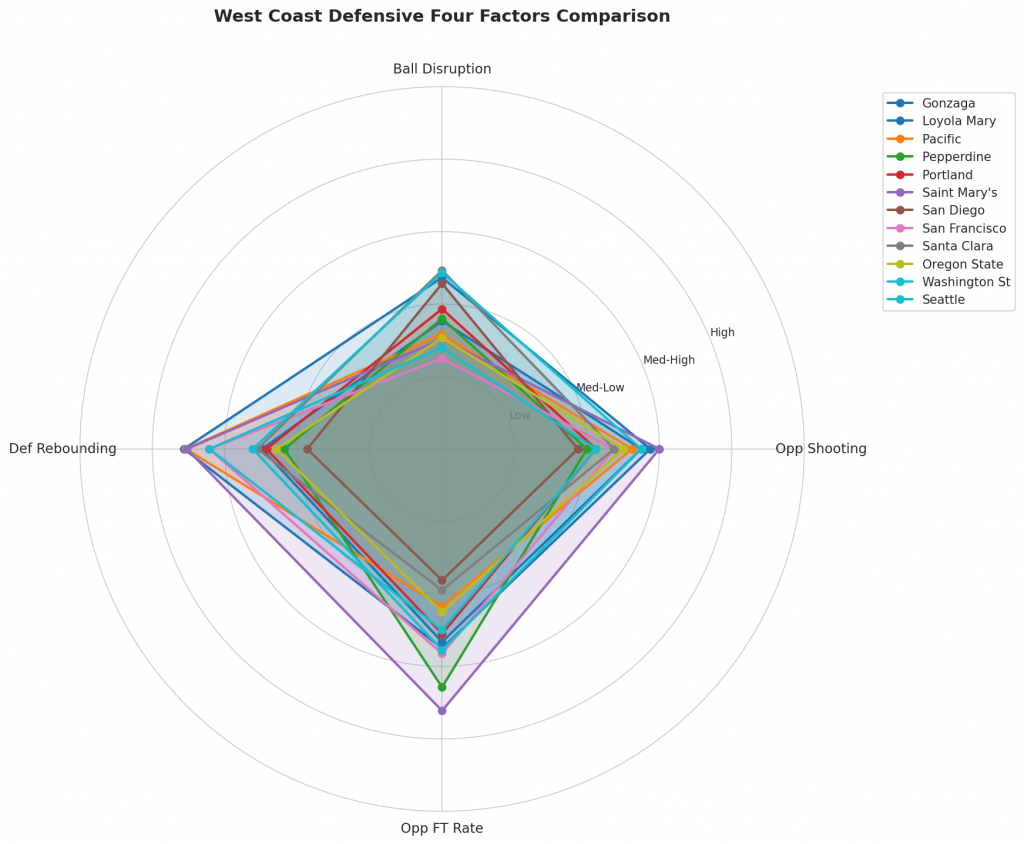
Figure 3: Defensive Four Factors comparison across West Coast teams. The radar chart shows each team’s opponent shooting defense (Opp eFG%), ball disruption (forcing TOV%), defensive rebounding (DREB%), and opponent free throw prevention (Opp FT Rate).
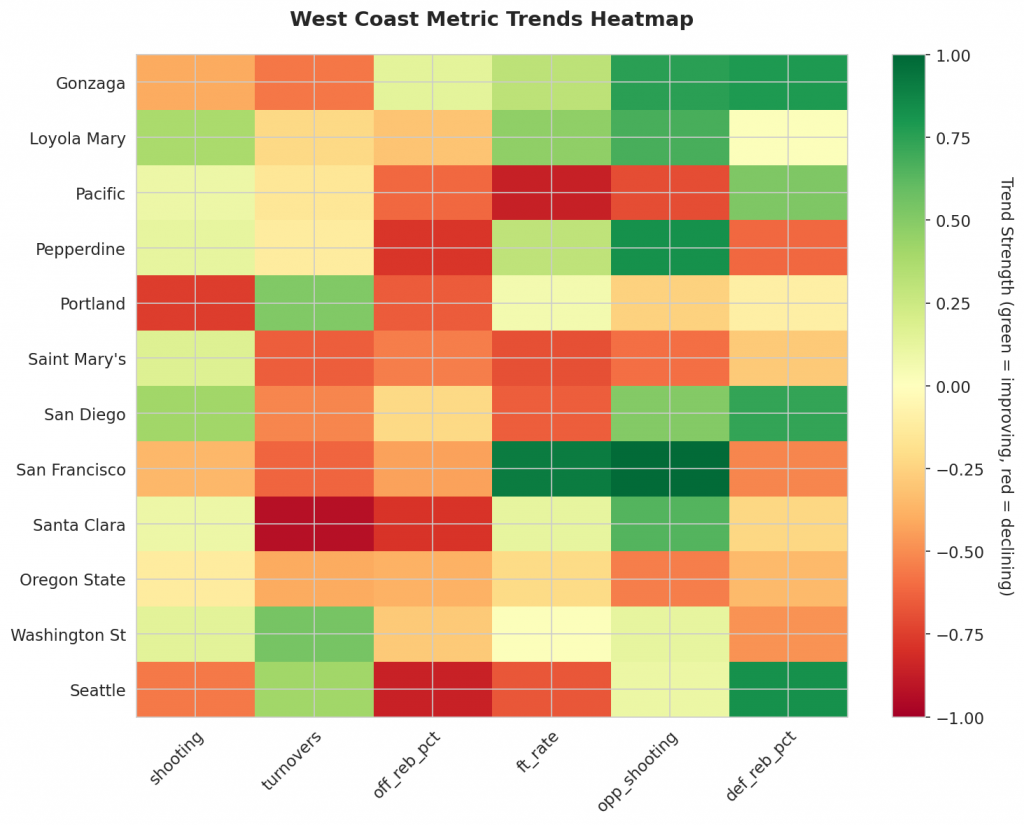
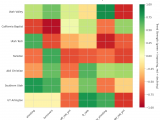
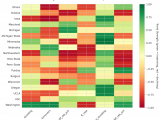
Figure 4: MACD trends heatmap showing which metrics are improving (green) or declining (red) for each team. Stronger colors indicate more pronounced trends.
Looking Ahead
West Coast Teams’ Performance in Week 15: A Data-Driven Analysis
As the college basketball season reaches its mid-point, teams on the West Coast continue to showcase their strengths and weaknesses. By examining key offensive and defensive trends, we can identify which teams are genuinely improving versus those struggling with performance.
Offensive Trends to Highlight:
- Santa Clara’s lack of improvement in Off Rebound Percentage is concerning, with their Season Avg at 0.34.
- Portland’s Shooting percentage is trending down strongly (Season Avg: 0.51), indicating a struggle on the offense.
Defensive Trends to Highlight:
- Gonzaga and Loyola Mary’s Opponent Shooting percentage are both trending up strongly versus weaker competition (Season Avg: 0.50), indicating a problem on the defensive end.
- Pacific’s Opponent Shooting percentage is trending down strongly, showing signs of a solid defense against stronger competition (Season Avg: 0.47).
- Gonzaga and Loyola Mary have seen an increase in Defensive Rebound Percentage versus weaker competition (Season Avg: 0.78).
These trends provide valuable insights into the performance of West Coast teams. As we move forward, it will be essential to monitor these metrics and adjust our analysis accordingly, taking into account performances versus stronger or weaker competition as necessary.
Metrics Glossary
Four Factors (Dean Oliver’s framework for basketball success):
- eFG% (Effective Field Goal %): Field goal percentage adjusted for 3-pointers being worth more (FGM + 0.5×3PM) / FGA. Higher is better offensively, lower is better defensively.
- TOV% (Turnover Rate): Turnovers per 100 possessions. Lower is better offensively (taking care of the ball), higher is better defensively (forcing turnovers).
- OREB% / DREB% (Offensive/Defensive Rebound Rate): Percentage of available rebounds grabbed. Offensive rebounds create second-chance points; defensive rebounds end opponent possessions.
- FTR (Free Throw Rate): Free throws made per field goal attempt (FTM/FGA). Measures ability to get to the line AND convert. Higher is better offensively, lower is better defensively.
Other Metrics:
- Elo Rating: Chess-style rating system that updates based on game results and opponent strength. Higher Elo indicates stronger team.
- Efficiency Margin: Point differential per 100 possessions (Offensive Efficiency – Defensive Efficiency). Accounts for pace of play.
- MACD (Moving Average Convergence Divergence): Trend indicator comparing 12-game and 26-game exponential moving averages. Positive MACD = improving trend, Negative MACD = declining trend.
Analysis powered by HoopSci’s advanced metrics and MACD trending indicators.