Big South Update: Week 1
November 9, 2026Strongest Offensive Trends
- Gardner-Webb, Off Reb Pct, Down, Trend Strength: -0.035 – Gardner-Webb faces a growing struggle on the boards, as their performance in rebounding is declining while this early season period has already begun to shape their defensive outlook.
- Charleston So, Off Reb Pct, Down, Trend Strength: -0.032 – Charleston So is facing a challenge as its ability to secure rebounds on offense shows signs of declining, which hinders their capacity to maintain possession and drive their scoring efforts.
- Gardner-Webb, Shooting, Down, Trend Strength: -0.022 – As the season gets underway for Gardner-Webb, a concerning decline in shooting accuracy is emerging as a significant hurdle that threatens to undermine the team’s overall offensive potential.
- USC Upstate, Turnovers, Up, Trend Strength: 0.011 – For USC Upstate, a concerning rise in turnovers has emerged as a troubling liability early in the season, hampering their ability to control possessions and sustain momentum on the court.
- Gardner-Webb, Turnovers, Up, Trend Strength: 0.009 – Gardner-Webb faces mounting trouble as their turnover rate climbs, creating a significant struggle for the offense early in the season.
Strongest Defensive Trends
- Charleston So, Def Reb Pct, Down, Trend Strength: -0.015 – Charleston So’s Def Reb Pct is trending down, a worsening trend (allowing more offensive boards).
- UNC Asheville, Opp Shooting, Up, Trend Strength: 0.013 – The Blue Foxes have begun to struggle as their defense allows opposing shooters to get open more often.
- High Point, Opp Shooting, Down, Trend Strength: -0.011 – High Point is demonstrating an encouraging upward trajectory in its ability to generate efficient scoring opportunities against opposing defenses.
- Presbyterian, Opp Turnovers, Down, Trend Strength: -0.01 – Presbyterian is showing a troubling decline in its ability to force turnovers from opposing teams.
- Longwood, Opp Turnovers, Down, Trend Strength: -0.009 – The program’s ability to generate opponent turnovers has declined, signaling a troubling struggle in disrupting opposing offensive rhythm at key moments.
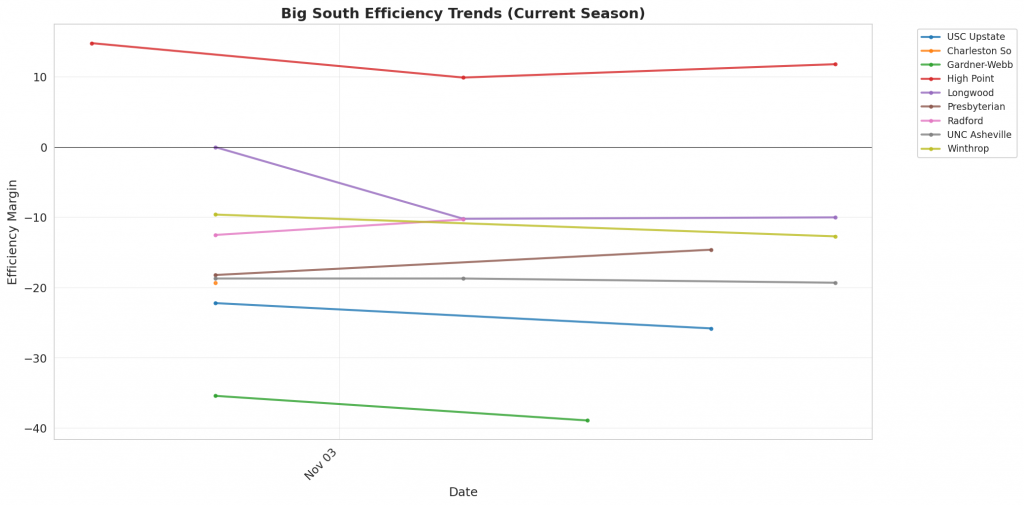
Figure 1: Efficiency margin trends for Big South teams throughout the season. Teams trending upward show improving performance, while downward trends indicate struggles.
Conference Snapshot
- Week Dates: November 02 – November 08, 2026
- Trending Up (Efficiency): Charleston So, Longwood, Presbyterian, UNC Asheville, Winthrop
- Trending Down (Efficiency): USC Upstate, Gardner-Webb, High Point, Radford
Team-by-Team Analysis
Charleston So
Record: 0-1 | Elo: 1422.7 (ranked 303 of 365) | Efficiency Margin: -19.30 (ranked 311 of 365)
Offensive Trends:
- Off Reb Pct (Offensive Rebounding): Currently ranked 196 of 365 in D1. Trending down strongly 🔴.
- Shooting (Shooting): Currently ranked 220 of 365 in D1. Trending up weakly 🟢.
Defensive Trends:
- Def Reb Pct (Defensive Rebounding): Currently ranked 198 of 365 in D1. Trending down strongly 🔴.
- Opp Shooting (Opp Shooting): Currently ranked 201 of 365 in D1. Trending down weakly 🟢.
Gardner-Webb
Record: 0-2 | Elo: 1347.5 (ranked 360 of 365) | Efficiency Margin: -38.93 (ranked 360 of 365)
Offensive Trends:
- Shooting (Shooting): Currently ranked 365 of 365 in D1. Trending down strongly 🔴.
- Turnovers (Turnovers): Currently ranked 362 of 365 in D1. Trending up strongly 🔴.
Defensive Trends:
- Opp Turnovers (Opp Turnovers): Currently ranked 293 of 365 in D1. Trending up moderately 🟢.
- Opp Shooting (Opp Shooting): Currently ranked 354 of 365 in D1. Trending up weakly 🔴.
High Point
Record: 3-0 | Elo: 1662.2 (ranked 22 of 365) | Efficiency Margin: +11.78 (ranked 96 of 365)
Offensive Trends:
- Turnovers (Turnovers): Currently ranked 250 of 365 in D1. Trending up strongly 🔴.
- Off Reb Pct (Offensive Rebounding): Currently ranked 221 of 365 in D1. Trending down strongly 🔴.
Defensive Trends:
- Opp Shooting (Opp Shooting): Currently ranked 49 of 365 in D1. Trending down strongly 🟢.
- Opp Turnovers (Opp Turnovers): Currently ranked 51 of 365 in D1. Trending down moderately 🔴.
Longwood
Record: 2-1 | Elo: 1471.2 (ranked 236 of 365) | Efficiency Margin: -9.96 (ranked 230 of 365)
Offensive Trends:
- Turnovers (Turnovers): Currently ranked 235 of 365 in D1. Trending down moderately 🟢.
- Off Reb Pct (Offensive Rebounding): Currently ranked 229 of 365 in D1. Trending up moderately 🟢.
Defensive Trends:
- Opp Turnovers (Opp Turnovers): Currently ranked 270 of 365 in D1. Trending down strongly 🔴.
- Opp Shooting (Opp Shooting): Currently ranked 131 of 365 in D1. Trending down moderately 🟢.
Presbyterian
Record: 0-2 | Elo: 1424.8 (ranked 299 of 365) | Efficiency Margin: -14.60 (ranked 275 of 365)
Offensive Trends:
- Off Reb Pct (Offensive Rebounding): Currently ranked 116 of 365 in D1. Trending down strongly 🔴.
- Shooting (Shooting): Currently ranked 138 of 365 in D1. Trending up weakly 🟢.
Defensive Trends:
- Opp Turnovers (Opp Turnovers): Currently ranked 357 of 365 in D1. Trending down strongly 🔴.
- Opp Shooting (Opp Shooting): Currently ranked 347 of 365 in D1. Trending up moderately 🔴.
Radford
Record: 0-2 | Elo: 1464.7 (ranked 245 of 365) | Efficiency Margin: -10.26 (ranked 234 of 365)
Offensive Trends:
- Shooting (Shooting): Currently ranked 215 of 365 in D1. Trending down strongly 🔴.
- Off Reb Pct (Offensive Rebounding): Currently ranked 252 of 365 in D1. Trending down strongly 🔴.
Defensive Trends:
- Opp Shooting (Opp Shooting): Currently ranked 302 of 365 in D1. Trending up moderately 🔴.
- Opp Turnovers (Opp Turnovers): Currently ranked 216 of 365 in D1. Trending up weakly 🟢.
UNC Asheville
Record: 1-2 | Elo: 1472.3 (ranked 234 of 365) | Efficiency Margin: -19.30 (ranked 310 of 365)
Offensive Trends:
- Turnovers (Turnovers): Currently ranked 286 of 365 in D1. Trending up strongly 🔴.
- Off Reb Pct (Offensive Rebounding): Currently ranked 105 of 365 in D1. Trending up strongly 🟢.
Defensive Trends:
- Opp Shooting (Opp Shooting): Currently ranked 346 of 365 in D1. Trending up strongly 🔴.
- Opp Turnovers (Opp Turnovers): Currently ranked 262 of 365 in D1. Trending down weakly 🔴.
USC Upstate
Record: 0-2 | Elo: 1370.2 (ranked 352 of 365) | Efficiency Margin: -25.83 (ranked 341 of 365)
Offensive Trends:
- Turnovers (Turnovers): Currently ranked 323 of 365 in D1. Trending up strongly 🔴.
- Shooting (Shooting): Currently ranked 220 of 365 in D1. Trending down moderately 🔴.
Defensive Trends:
- Opp Shooting (Opp Shooting): Currently ranked 140 of 365 in D1. Trending down moderately 🟢.
- Opp Turnovers (Opp Turnovers): Currently ranked 338 of 365 in D1. Trending down weakly 🔴.
Winthrop
Record: 0-2 | Elo: 1538.7 (ranked 123 of 365) | Efficiency Margin: -12.67 (ranked 251 of 365)
Offensive Trends:
- Off Reb Pct (Offensive Rebounding): Currently ranked 72 of 365 in D1. Trending down moderately 🔴.
- Shooting (Shooting): Currently ranked 19 of 365 in D1. Trending up weakly 🟢.
Defensive Trends:
- Opp Turnovers (Opp Turnovers): Currently ranked 306 of 365 in D1. Trending down strongly 🔴.
- Opp Shooting (Opp Shooting): Currently ranked 285 of 365 in D1. Trending up moderately 🔴.
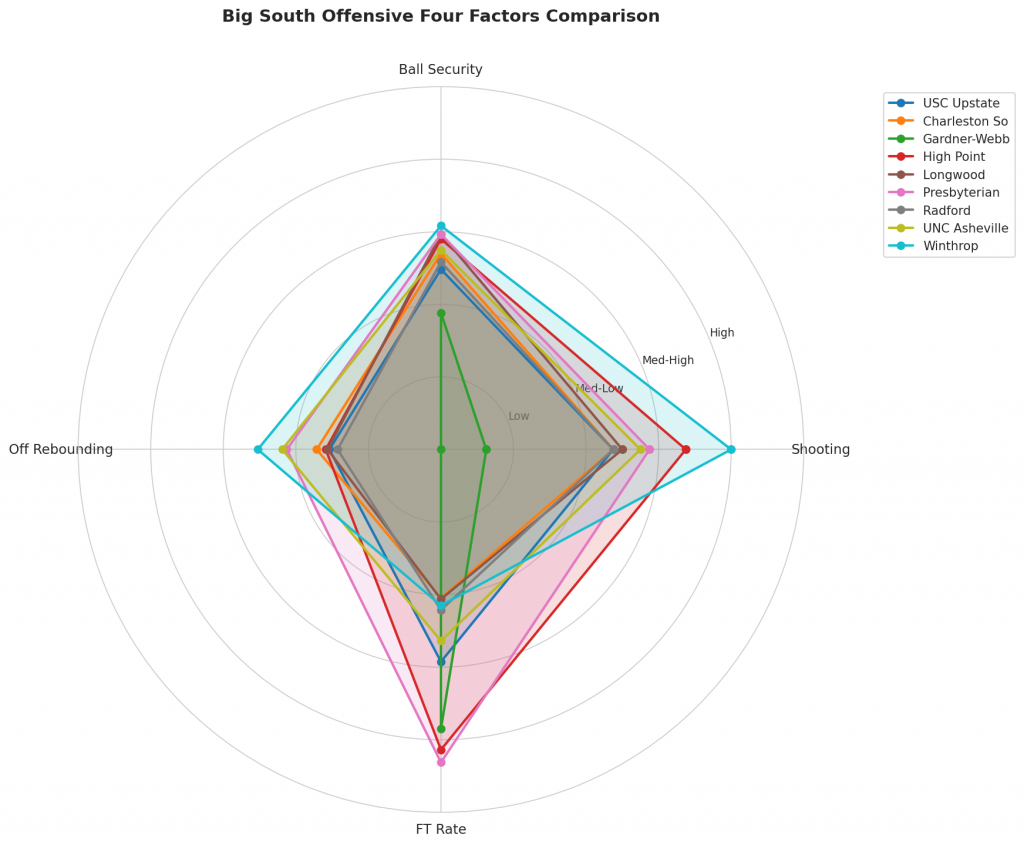
Figure 2: Offensive Four Factors comparison across Big South teams. The radar chart shows each team’s shooting efficiency (eFG%), ball security (TOV%), offensive rebounding (OREB%), and free throw generation (FT Rate).
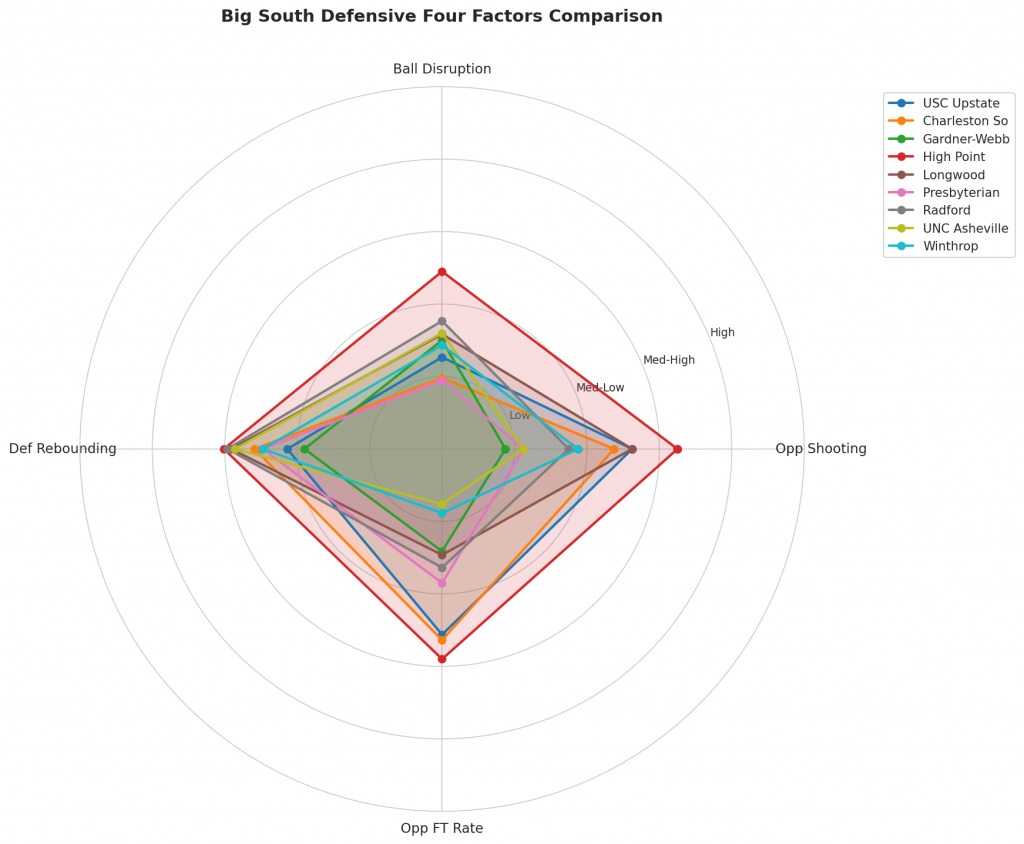
Figure 3: Defensive Four Factors comparison across Big South teams. The radar chart shows each team’s opponent shooting defense (Opp eFG%), ball disruption (forcing TOV%), defensive rebounding (DREB%), and opponent free throw prevention (Opp FT Rate).
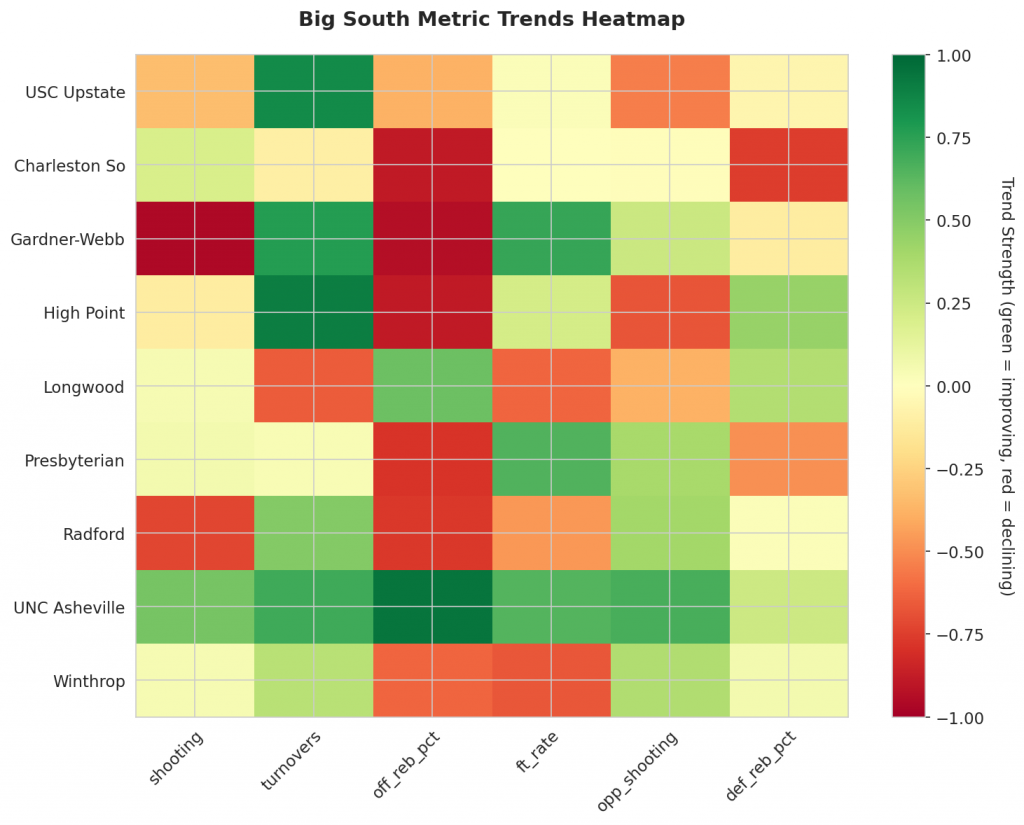
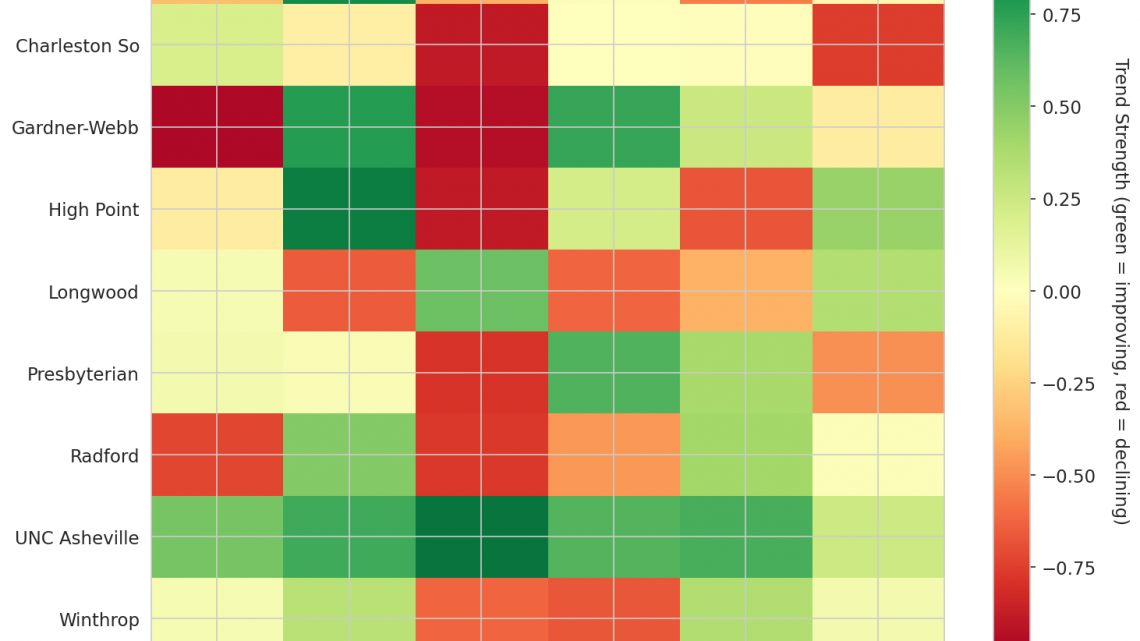
Figure 4: MACD trends heatmap showing which metrics are improving (green) or declining (red) for each team. Stronger colors indicate more pronounced trends.
Looking Ahead
Evaluating team performance in the early season requires looking beyond simple results to understand underlying momentum shifts through Moving Average Convergence Divergence trending indicators. These metrics distinguish between teams establishing a genuine foundation and those operating on unsustainable trends, covering each squad’s games so far. Several programs present distinct challenges in offensive execution based on current readings. USC Upstate faces significant ball security concerns; the team is trending strongly upward in turnovers, a metric where an increasing value indicates worsening performance that hinders sustained offense. Meanwhile, Charleston So shows instability on the glass, with offensive rebounding percentage trending strongly downward, signaling a declining ability to capitalize on second-chance opportunities.
For Gardner-Webb, data points to dual issues affecting scoring potential. The program is trending strongly downward in shooting efficiency, suggesting their primary mode of offense is becoming less effective relative to their season average of 0.35. Compounding this issue, Gardner-Webb is also trending strongly upward in turnovers, creating a scenario where they are struggling to generate points while simultaneously protecting possession poorly alongside their season average of 0.237.
On the defensive end, indicators reveal how well each squad disrupts opposing flows or secures rebounds. Charleston So displays a strong downward trend in defensive rebounding percentage; since this metric represents the ability to stop opponents from grabbing extra boards, a decreasing value signifies that they are allowing more offensive boards than expected against their season average of 0.707. Conversely, High Point stands out as a positive anomaly on defense, with opponent shooting percentage trending strongly downward. This improvement is vital, as a lower value for opponent shooting directly correlates with an improved ability to clog lanes and contest shots effectively.
However, both Longwood and Presbyterian are facing notable declines in forcing opponent mistakes. Longwood’s ability to induce turnovers from opponents is trending strongly downward, while Presbyterian shows the same trend in the forcing of fewer turnovers. For both programs, a declining value in these metrics indicates a worsening defensive identity regarding ball pressure and disruption, potentially leaving them vulnerable. Additionally, Radford, UNC Asheville, Winthrop, and other squads in the conference continue to be monitored for their specific trajectory in these critical categories. Continued monitoring of these specific metrics will be essential to determine which teams are building consistent advantages and which are riding short-term fluctuations that may not sustain through the full season.
Metrics Glossary
Four Factors (Dean Oliver’s framework for basketball success):
- eFG% (Effective Field Goal %): Field goal percentage adjusted for 3-pointers being worth more (FGM + 0.5×3PM) / FGA. Higher is better offensively, lower is better defensively.
- TOV% (Turnover Rate): Turnovers per 100 possessions. Lower is better offensively (taking care of the ball), higher is better defensively (forcing turnovers).
- OREB% / DREB% (Offensive/Defensive Rebound Rate): Percentage of available rebounds grabbed. Offensive rebounds create second-chance points; defensive rebounds end opponent possessions.
- FTR (Free Throw Rate): Free throws made per field goal attempt (FTM/FGA). Measures ability to get to the line AND convert. Higher is better offensively, lower is better defensively.
Other Metrics:
- Elo Rating: Chess-style rating system that updates based on game results and opponent strength. Higher Elo indicates stronger team.
- Efficiency Margin: Point differential per 100 possessions (Offensive Efficiency – Defensive Efficiency). Accounts for pace of play.
- MACD (Moving Average Convergence Divergence): Trend indicator comparing 12-game and 26-game exponential moving averages. Positive MACD = improving trend, Negative MACD = declining trend.
Analysis powered by HoopSci’s advanced metrics and MACD trending indicators.