Conference USA Update: Week 1
November 9, 2026Strongest Offensive Trends
- FIU, Off Reb Pct, Up, Trend Strength: 0.043 – FIU’s improved performance in securing loose balls off opponents has positively influenced their overall team dynamics early in the season.
- Mid Tennessee, Off Reb Pct, Up, Trend Strength: 0.037 – Mid Tennessee’s improved ability to grab offensive rebounds after their own misses is fueling a noticeable uptick in overall possession control.
- W Kentucky, Off Reb Pct, Up, Trend Strength: 0.028 – The improvement in W Kentucky’s off rebounding percentage signals a growing ability to secure loose balls after misses, which is directly contributing to enhanced possession opportunities.
- Jacksonville St, Off Reb Pct, Up, Trend Strength: 0.02 – The marked improvement in Jacksonville St’s rebounding percentage is enhancing their overall possession opportunities, contributing positively to their early-season performance trajectory.
- Liberty, Shooting, Down, Trend Strength: -0.014 – Liberty faces an early-season hurdle as a decline in their shooting output has hampered their offensive execution throughout the start of the season.
Strongest Defensive Trends
- Mid Tennessee, Opp Shooting, Up, Trend Strength: 0.017 – Mid Tennessee’s defensive performance has become a troubling struggle as opponents find it increasingly simple to score against them, signaling a worrying drop in their ability to contain attackers throughout this early season stretch.
- Mid Tennessee, Def Reb Pct, Down, Trend Strength: -0.015 – Mid Tennessee faces a troubling defensive struggle as their rebounding efforts falter, allowing too many second-chance opportunities to opposing squads and stifling their own potential for crucial possessions.
- Jacksonville St, Def Reb Pct, Up, Trend Strength: 0.014 – Jacksonville St is showing a promising upward trend in its ability to secure defensive rebounds, effectively limiting opponents’ opportunities to extend possessions through improved glassing efforts.
- New Mexico St, Opp Shooting, Up, Trend Strength: 0.012 – New Mexico St is facing a concerning decline in its ability to limit opponent scoring as the season unfolds, indicating that allowing more points than desired has become an emerging issue for the team.
- W Kentucky, Opp Shooting, Up, Trend Strength: 0.011 – W Kentucky is encountering increasing trouble defending against opponent shooting efforts, indicating a growing vulnerability in their defensive scheme.
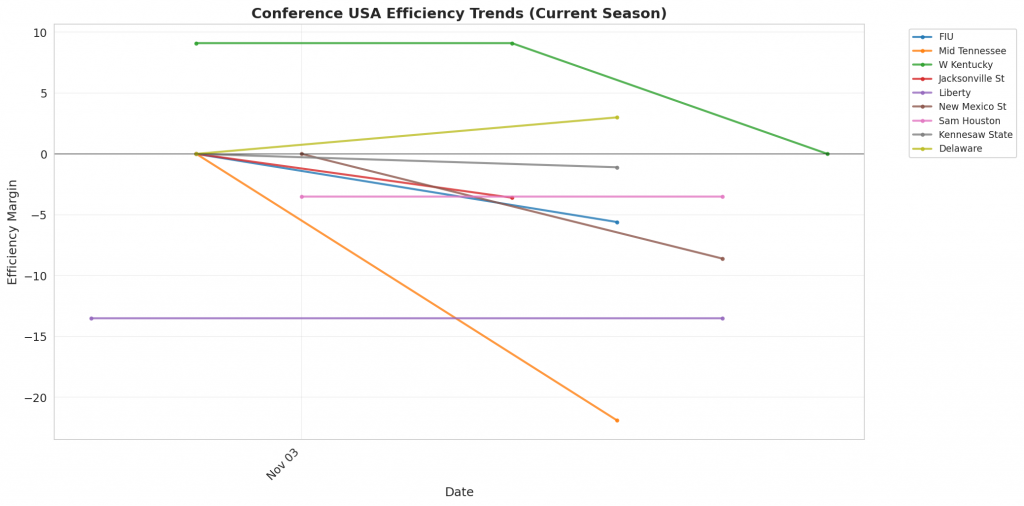
Figure 1: Efficiency margin trends for Conference USA teams throughout the season. Teams trending upward show improving performance, while downward trends indicate struggles.
Conference Snapshot
- Week Dates: November 02 – November 08, 2026
- Trending Up (Efficiency): FIU, W Kentucky, Jacksonville St, Missouri State
- Trending Down (Efficiency): Mid Tennessee, Liberty, New Mexico St, Sam Houston, Kennesaw State
Team-by-Team Analysis
Delaware
Record: 1-1 | Elo: 1442.8 (ranked 274 of 365) | Efficiency Margin: +2.98 (ranked 136 of 365)
Offensive Trends:
- Off Reb Pct (Offensive Rebounding): Currently ranked 357 of 365 in D1. Trending up strongly 🟢.
- Shooting (Shooting): Currently ranked 209 of 365 in D1. Trending down weakly 🔴.
Defensive Trends:
- Def Reb Pct (Defensive Rebounding): Currently ranked 159 of 365 in D1. Trending down strongly 🔴.
- Opp Shooting (Opp Shooting): Currently ranked 151 of 365 in D1. Trending up moderately 🔴.
FIU
Record: 2-0 | Elo: 1448.5 (ranked 270 of 365) | Efficiency Margin: -5.56 (ranked 195 of 365)
Offensive Trends:
- Off Reb Pct (Offensive Rebounding): Currently ranked 143 of 365 in D1. Trending up strongly 🟢.
- Shooting (Shooting): Currently ranked 206 of 365 in D1. Trending up weakly 🟢.
Defensive Trends:
- Opp Shooting (Opp Shooting): Currently ranked 60 of 365 in D1. Trending down moderately 🟢.
- Opp Turnovers (Opp Turnovers): Currently ranked 179 of 365 in D1. Trending down weakly 🔴.
Jacksonville St
Record: 1-1 | Elo: 1481.6 (ranked 225 of 365) | Efficiency Margin: -3.64 (ranked 182 of 365)
Offensive Trends:
- Off Reb Pct (Offensive Rebounding): Currently ranked 275 of 365 in D1. Trending up strongly 🟢.
- Shooting (Shooting): Currently ranked 152 of 365 in D1. Trending up moderately 🟢.
Defensive Trends:
- Def Reb Pct (Defensive Rebounding): Currently ranked 34 of 365 in D1. Trending up strongly 🟢.
- Opp Turnovers (Opp Turnovers): Currently ranked 336 of 365 in D1. Trending down moderately 🔴.
Kennesaw State
Record: 2-0 | Elo: 1542.5 (ranked 114 of 365) | Efficiency Margin: -1.07 (ranked 168 of 365)
Offensive Trends:
- Off Reb Pct (Offensive Rebounding): Currently ranked 70 of 365 in D1. Trending up strongly 🟢.
- Turnovers (Turnovers): Currently ranked 309 of 365 in D1. Trending up moderately 🔴.
Defensive Trends:
- Opp Shooting (Opp Shooting): Currently ranked 66 of 365 in D1. Trending down strongly 🟢.
- Def Reb Pct (Defensive Rebounding): Currently ranked 22 of 365 in D1. Trending down strongly 🔴.
Liberty
Record: 1-1 | Elo: 1612.7 (ranked 47 of 365) | Efficiency Margin: -13.46 (ranked 258 of 365)
Offensive Trends:
- Shooting (Shooting): Currently ranked 188 of 365 in D1. Trending down strongly 🔴.
- Off Reb Pct (Offensive Rebounding): Currently ranked 361 of 365 in D1. Trending up strongly 🟢.
Defensive Trends:
- Opp Shooting (Opp Shooting): Currently ranked 247 of 365 in D1. Trending up moderately 🔴.
- Opp Turnovers (Opp Turnovers): Currently ranked 191 of 365 in D1. Trending down moderately 🔴.
Mid Tennessee
Record: 1-1 | Elo: 1518.6 (ranked 153 of 365) | Efficiency Margin: -21.94 (ranked 325 of 365)
Offensive Trends:
- Off Reb Pct (Offensive Rebounding): Currently ranked 214 of 365 in D1. Trending up strongly 🟢.
- Shooting (Shooting): Currently ranked 335 of 365 in D1. Trending down moderately 🔴.
Defensive Trends:
- Opp Shooting (Opp Shooting): Currently ranked 341 of 365 in D1. Trending up strongly 🔴.
- Def Reb Pct (Defensive Rebounding): Currently ranked 246 of 365 in D1. Trending down strongly 🔴.
Missouri State
Record: 2-0 | Elo: 1430.3 (ranked 265 of 365) | Efficiency Margin: -7.01 (ranked 231 of 365)
Offensive Trends:
- Shooting (Shooting): Currently ranked 85 of 365 in D1. Trending up strongly 🟢.
- Off Reb Pct (Offensive Rebounding): Currently ranked 1 of 365 in D1. Trending up strongly 🟢.
Defensive Trends:
- Opp Turnovers (Opp Turnovers): Currently ranked 231 of 365 in D1. Trending down strongly 🔴.
- Def Reb Pct (Defensive Rebounding): Currently ranked 208 of 365 in D1. Trending down strongly 🔴.
New Mexico St
Record: 1-1 | Elo: 1486.0 (ranked 214 of 365) | Efficiency Margin: -8.64 (ranked 222 of 365)
Offensive Trends:
- Turnovers (Turnovers): Currently ranked 302 of 365 in D1. Trending up strongly 🔴.
- Off Reb Pct (Offensive Rebounding): Currently ranked 112 of 365 in D1. Trending up strongly 🟢.
Defensive Trends:
- Opp Shooting (Opp Shooting): Currently ranked 343 of 365 in D1. Trending up strongly 🔴.
- Def Reb Pct (Defensive Rebounding): Currently ranked 213 of 365 in D1. Trending down strongly 🔴.
Sam Houston
Record: 1-1 | Elo: 1545.2 (ranked 110 of 365) | Efficiency Margin: -3.51 (ranked 180 of 365)
Offensive Trends:
- Turnovers (Turnovers): Currently ranked 348 of 365 in D1. Trending up strongly 🔴.
- Off Reb Pct (Offensive Rebounding): Currently ranked 130 of 365 in D1. Trending up strongly 🟢.
Defensive Trends:
- Opp Shooting (Opp Shooting): Currently ranked 231 of 365 in D1. Trending up strongly 🔴.
- Opp Turnovers (Opp Turnovers): Currently ranked 300 of 365 in D1. Trending down moderately 🔴.
W Kentucky
Record: 2-1 | Elo: 1508.7 (ranked 171 of 365) | Efficiency Margin: -0.03 (ranked 162 of 365)
Offensive Trends:
- Off Reb Pct (Offensive Rebounding): Currently ranked 215 of 365 in D1. Trending up strongly 🟢.
- Shooting (Shooting): Currently ranked 191 of 365 in D1. Trending up moderately 🟢.
Defensive Trends:
- Opp Shooting (Opp Shooting): Currently ranked 205 of 365 in D1. Trending up strongly 🔴.
- Opp Turnovers (Opp Turnovers): Currently ranked 116 of 365 in D1. Trending up weakly 🟢.
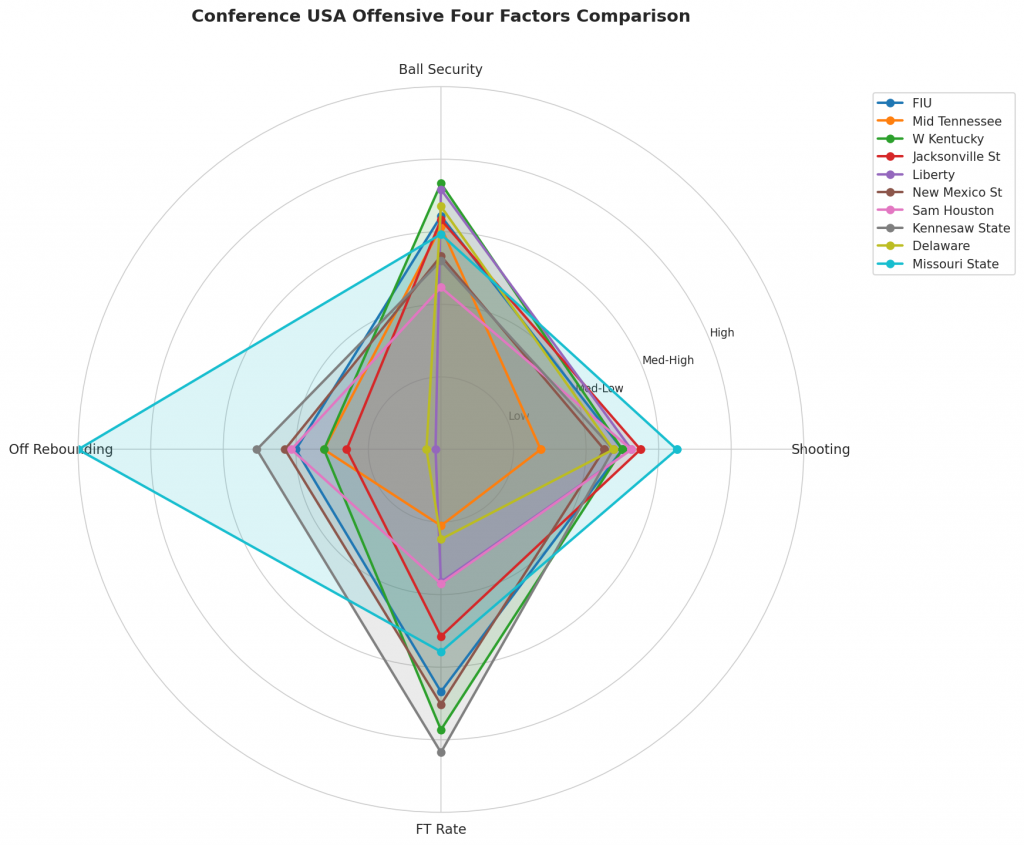
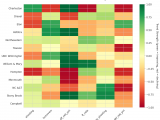
Figure 2: Offensive Four Factors comparison across Conference USA teams. The radar chart shows each team’s shooting efficiency (eFG%), ball security (TOV%), offensive rebounding (OREB%), and free throw generation (FT Rate).
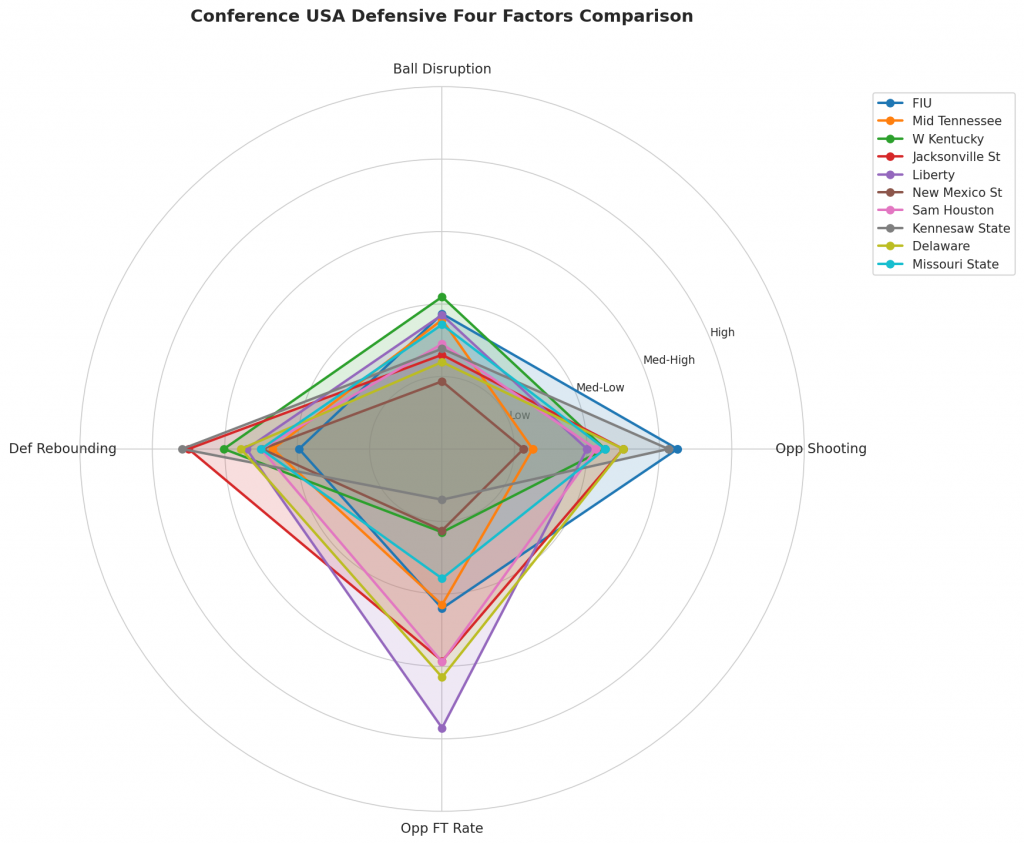
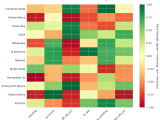
Figure 3: Defensive Four Factors comparison across Conference USA teams. The radar chart shows each team’s opponent shooting defense (Opp eFG%), ball disruption (forcing TOV%), defensive rebounding (DREB%), and opponent free throw prevention (Opp FT Rate).
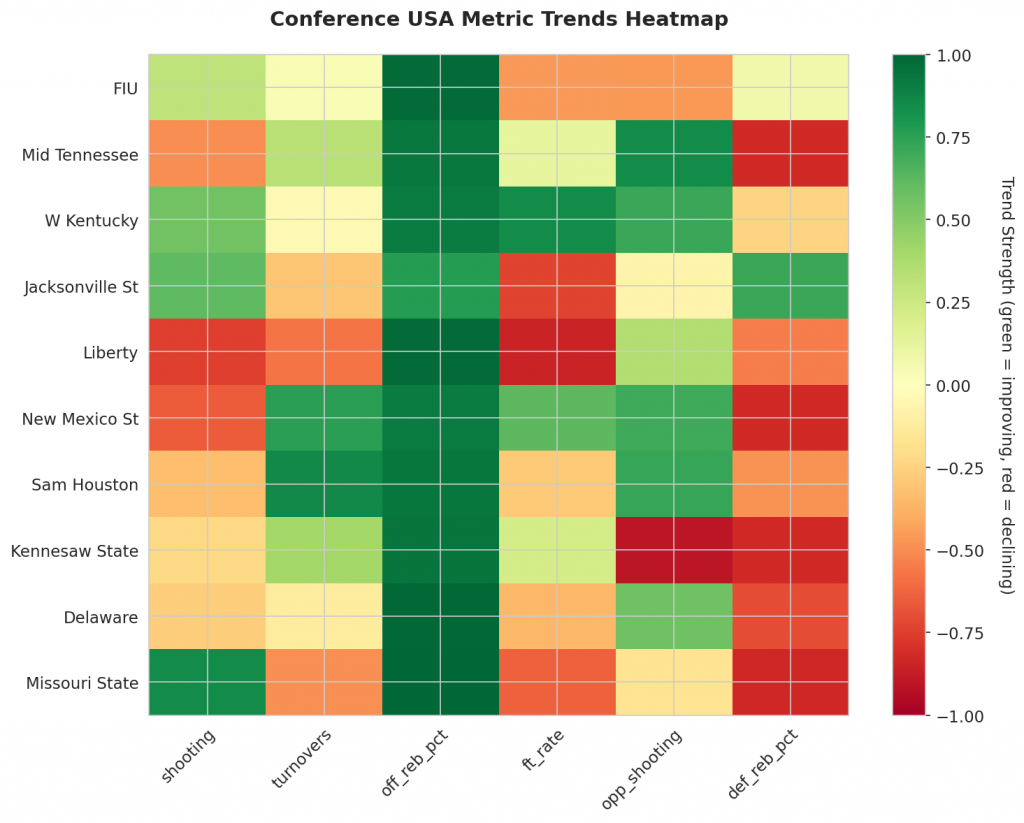
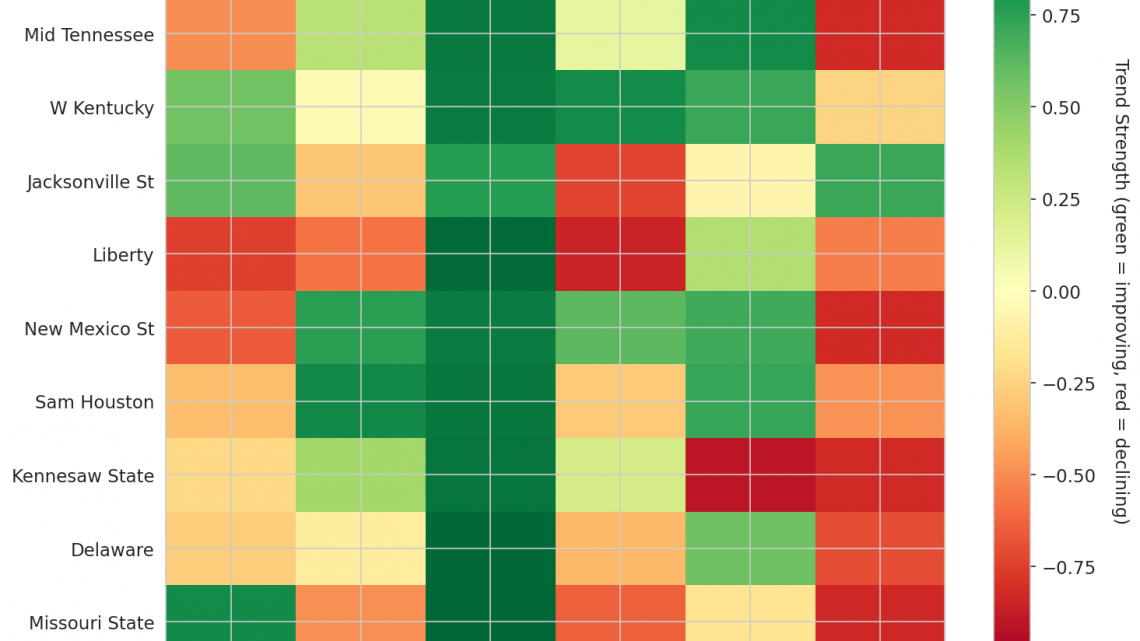
Figure 4: MACD trends heatmap showing which metrics are improving (green) or declining (red) for each team. Stronger colors indicate more pronounced trends.
Looking Ahead
Moving Average Convergence Divergence trending indicators serve as the primary lens for distinguishing genuine improvement from fleeting bursts of activity across the league. Currently, actionable insights are available specifically within four teams possessing sufficient data points: FIU, Mid Tennessee, W Kentucky, and Jacksonville St. Other squads such as Liberty, New Mexico St, Sam Houston, Kennesaw State, Delaware, and Missouri State will be evaluated as more games accumulate and further data becomes available.
On the offensive front, FIU stands out with an Offensive Rebound Percentage season average of 0.31, displaying a strongly upward trend that signals a genuine enhancement in extending possessions and creating additional scoring opportunities. Similarly, Mid Tennessee has secured an Offensive Rebound Percentage average near 0.279 while exhibiting a strongly upward trajectory, indicating enhanced execution on the glass. W Kentucky mirrors this improvement with a season average of approximately 0.279 and a matching strongly upward trend in Offensive Rebound Percentage, suggesting a robust capacity to impact the shot clock through offensive glass activity. Completing this group of improving value is Jacksonville St, which starts with an Offensive Rebound Percentage average of 0.254 but exhibits a strongly upward trend that marks significant improvement in capturing offensive boards. Collectively, these programs demonstrate consistent growth in their ability to convert defensive stops into additional possessions.
The defensive landscape presents a more complex dichotomy where early success is occasionally undermined by concerning degradations in opponent shooting and rebound control. Mid Tennessee offers the most volatile profile; while they improved offensive rebounding, their performance against opponents is worsening. Their Opponent Shooting average sits at 0.60 with a trend that is strongly up, which signifies deterioration as the team allows opponents to shoot at higher percentages. Compounding this struggle is their Defensive Rebound Percentage, which averages 0.687 but is trending strongly down. This decline means they are allowing more offensive boards against them, directly correlating to a deterioration in their overall defensive stance. W Kentucky faces similar defensive scrutiny despite its offensive rebounding gains; with an opponent shooting percentage average of 0.52, the team is seeing a trend that is strongly up, indicating a clear deterioration in defensive stopping power as they increasingly allow higher efficiency from opposing field goals. Conversely, Jacksonville St manages to avoid this trap by showing a strongly upward trend in Defensive Rebound Percentage with a season average of 0.78, effectively grabbing more defensive boards and improving their overall defensive stance while their opponent shooting remains unflagged in this dataset. This divergence highlights a critical reality: only Jacksonville St among these four shows improvement across both rebounding categories within the current metrics, whereas Mid Tennessee and W Kentucky must address significant defensive leaks before they can sustain momentum.
Metrics Glossary
Four Factors (Dean Oliver’s framework for basketball success):
- eFG% (Effective Field Goal %): Field goal percentage adjusted for 3-pointers being worth more (FGM + 0.5×3PM) / FGA. Higher is better offensively, lower is better defensively.
- TOV% (Turnover Rate): Turnovers per 100 possessions. Lower is better offensively (taking care of the ball), higher is better defensively (forcing turnovers).
- OREB% / DREB% (Offensive/Defensive Rebound Rate): Percentage of available rebounds grabbed. Offensive rebounds create second-chance points; defensive rebounds end opponent possessions.
- FTR (Free Throw Rate): Free throws made per field goal attempt (FTM/FGA). Measures ability to get to the line AND convert. Higher is better offensively, lower is better defensively.
Other Metrics:
- Elo Rating: Chess-style rating system that updates based on game results and opponent strength. Higher Elo indicates stronger team.
- Efficiency Margin: Point differential per 100 possessions (Offensive Efficiency – Defensive Efficiency). Accounts for pace of play.
- MACD (Moving Average Convergence Divergence): Trend indicator comparing 12-game and 26-game exponential moving averages. Positive MACD = improving trend, Negative MACD = declining trend.
Analysis powered by HoopSci’s advanced metrics and MACD trending indicators.