Pac-12 Conference Update: Week 1
November 9, 2026Strongest Offensive Trends
- Boise State, Off Reb Pct, Up, Trend Strength: 0.054 – Boise State is showing marked improvement in its rebounding performance, with a positive trend in the percentage of rebounds secured that indicates stronger effort on both ends of the court.
- Fresno State, Off Reb Pct, Up, Trend Strength: 0.048 – Fresno State is demonstrating a marked improvement in securing rebounds on every possession, a developing strength that supports their overall court presence during this early stage of the season.
- Colorado State, Off Reb Pct, Down, Trend Strength: -0.018 – Colorado State is facing a growing challenge with its off rebounds per possession rate, which indicates a troubling inability to secure second chances on loose balls.
- Colorado State, Shooting, Down, Trend Strength: -0.013 – A decline in shooting accuracy presents a growing challenge for Colorado State’s offense this season.
- Boise State, Shooting, Up, Trend Strength: 0.012 – Boise State has shown marked improvement in its shooting metrics, contributing significantly to a stronger offensive performance early in the season.
Strongest Defensive Trends
- Utah State, Opp Shooting, Down, Trend Strength: -0.021 – Utah State is showing signs of growth by successfully stifling their opponents, indicating a marked improvement in how they limit shot attempts generated by opposing players.
- Gonzaga, Def Reb Pct, Down, Trend Strength: -0.015 – The decline in Gonzaga’s defensive rebounding percentage signals a troubling shift toward conceding more second-chance opportunities to opposing offenses.
- San Diego State, Opp Turnovers, Down, Trend Strength: -0.013 – San Diego State is facing an analytical concern as its ability to force turnovers from opponents declines, suggesting the Aztecs are struggling to disrupt offensive rhythm early in the season.
- Fresno State, Opp Turnovers, Down, Trend Strength: -0.013 – Fresno State is struggling to generate opponent turnovers, indicating a concerning inability to disrupt the opposing offense effectively early in the season.
- Boise State, Opp Turnovers, Down, Trend Strength: -0.008 – As the campaign advances, Boise State finds itself grappling with a noticeable struggle to disrupt opposing ball movements and secure pivotal takeaways throughout their current slate of contests.
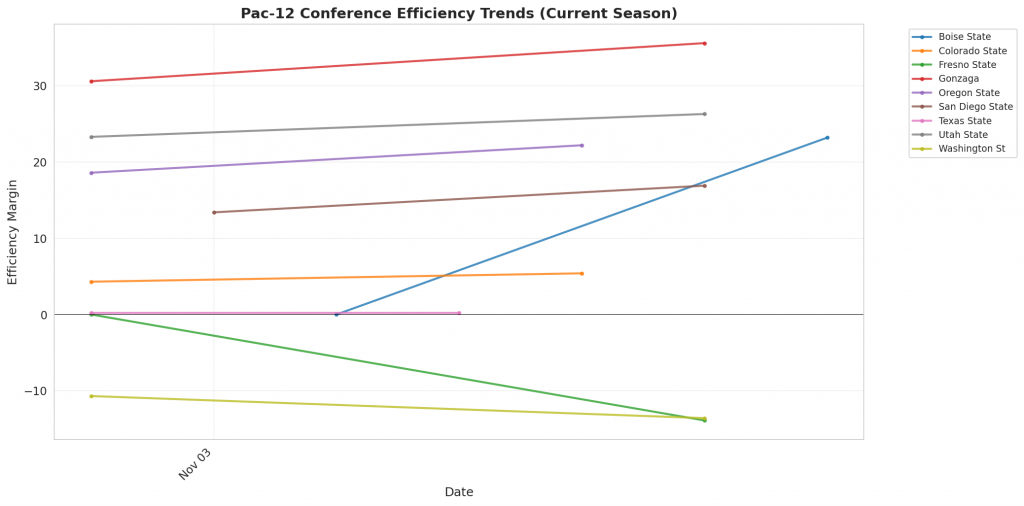
Figure 1: Efficiency margin trends for Pac-12 Conference teams throughout the season. Teams trending upward show improving performance, while downward trends indicate struggles.
Conference Snapshot
- Week Dates: November 02 – November 08, 2026
- Trending Up (Efficiency): Boise State, Fresno State, Oregon State, Texas State
- Trending Down (Efficiency): Colorado State, Gonzaga, San Diego State, Utah State, Washington St
Team-by-Team Analysis
Boise State
Record: 2-0 | Elo: 1615.1 (ranked 45 of 365) | Efficiency Margin: +23.18 (ranked 37 of 365)
Offensive Trends:
- Shooting (Shooting): Currently ranked 118 of 365 in D1. Trending up strongly 🟢.
- Off Reb Pct (Offensive Rebounding): Currently ranked 129 of 365 in D1. Trending up strongly 🟢.
Defensive Trends:
- Opp Turnovers (Opp Turnovers): Currently ranked 230 of 365 in D1. Trending down strongly 🔴.
- Opp Shooting (Opp Shooting): Currently ranked 127 of 365 in D1. Trending down moderately 🟢.
Colorado State
Record: 2-0 | Elo: 1601.0 (ranked 54 of 365) | Efficiency Margin: +5.37 (ranked 125 of 365)
Offensive Trends:
- Shooting (Shooting): Currently ranked 49 of 365 in D1. Trending down strongly 🔴.
- Off Reb Pct (Offensive Rebounding): Currently ranked 266 of 365 in D1. Trending down strongly 🔴.
Defensive Trends:
- Opp Shooting (Opp Shooting): Currently ranked 122 of 365 in D1. Trending down moderately 🟢.
- Opp Turnovers (Opp Turnovers): Currently ranked 252 of 365 in D1. Trending up moderately 🟢.
Fresno State
Record: 1-1 | Elo: 1429.1 (ranked 295 of 365) | Efficiency Margin: -13.86 (ranked 267 of 365)
Offensive Trends:
- Off Reb Pct (Offensive Rebounding): Currently ranked 164 of 365 in D1. Trending up strongly 🟢.
- Shooting (Shooting): Currently ranked 243 of 365 in D1. Trending up weakly 🟢.
Defensive Trends:
- Opp Turnovers (Opp Turnovers): Currently ranked 302 of 365 in D1. Trending down strongly 🔴.
- Opp Shooting (Opp Shooting): Currently ranked 272 of 365 in D1. Trending up weakly 🔴.
Gonzaga
Record: 2-0 | Elo: 1723.1 (ranked 7 of 365) | Efficiency Margin: +35.64 (ranked 9 of 365)
Offensive Trends:
- Turnovers (Turnovers): Currently ranked 11 of 365 in D1. Trending down moderately 🟢.
- Off Reb Pct (Offensive Rebounding): Currently ranked 147 of 365 in D1. Trending down moderately 🔴.
Defensive Trends:
- Def Reb Pct (Defensive Rebounding): Currently ranked 101 of 365 in D1. Trending down strongly 🔴.
- Opp Turnovers (Opp Turnovers): Currently ranked 71 of 365 in D1. Trending down moderately 🔴.
Oregon State
Record: 2-0 | Elo: 1529.5 (ranked 137 of 365) | Efficiency Margin: +22.20 (ranked 42 of 365)
Offensive Trends:
- Shooting (Shooting): Currently ranked 29 of 365 in D1. Trending up strongly 🟢.
- Off Reb Pct (Offensive Rebounding): Currently ranked 95 of 365 in D1. Trending up strongly 🟢.
Defensive Trends:
- Opp Shooting (Opp Shooting): Currently ranked 53 of 365 in D1. Trending down moderately 🟢.
- Def Reb Pct (Defensive Rebounding): Currently ranked 115 of 365 in D1. Trending up moderately 🟢.
San Diego State
Record: 2-0 | Elo: 1640.1 (ranked 33 of 365) | Efficiency Margin: +16.89 (ranked 65 of 365)
Offensive Trends:
- Turnovers (Turnovers): Currently ranked 321 of 365 in D1. Trending up strongly 🔴.
- Shooting (Shooting): Currently ranked 85 of 365 in D1. Trending down weakly 🔴.
Defensive Trends:
- Opp Turnovers (Opp Turnovers): Currently ranked 213 of 365 in D1. Trending down strongly 🔴.
- Def Reb Pct (Defensive Rebounding): Currently ranked 73 of 365 in D1. Trending up moderately 🟢.
Texas State
Record: 2-0 | Elo: 1515.8 (ranked 156 of 365) | Efficiency Margin: +0.17 (ranked 150 of 365)
Offensive Trends:
- Shooting (Shooting): Currently ranked 165 of 365 in D1. Trending up strongly 🟢.
- Off Reb Pct (Offensive Rebounding): Currently ranked 122 of 365 in D1. Trending up strongly 🟢.
Defensive Trends:
- Opp Shooting (Opp Shooting): Currently ranked 116 of 365 in D1. Trending down weakly 🟢.
- Opp Turnovers (Opp Turnovers): Currently ranked 68 of 365 in D1. Trending up weakly 🟢.
Utah State
Record: 2-0 | Elo: 1687.3 (ranked 11 of 365) | Efficiency Margin: +26.25 (ranked 29 of 365)
Offensive Trends:
- Turnovers (Turnovers): Currently ranked 150 of 365 in D1. Trending down moderately 🟢.
- Off Reb Pct (Offensive Rebounding): Currently ranked 110 of 365 in D1. Trending down moderately 🔴.
Defensive Trends:
- Opp Shooting (Opp Shooting): Currently ranked 8 of 365 in D1. Trending down strongly 🟢.
- Opp Turnovers (Opp Turnovers): Currently ranked 74 of 365 in D1. Trending down weakly 🔴.
Washington St
Record: 0-2 | Elo: 1457.7 (ranked 250 of 365) | Efficiency Margin: -13.61 (ranked 261 of 365)
Offensive Trends:
- Shooting (Shooting): Currently ranked 247 of 365 in D1. Trending down strongly 🔴.
- Turnovers (Turnovers): Currently ranked 257 of 365 in D1. Trending down moderately 🟢.
Defensive Trends:
- Opp Shooting (Opp Shooting): Currently ranked 362 of 365 in D1. Trending up strongly 🔴.
- Opp Turnovers (Opp Turnovers): Currently ranked 112 of 365 in D1. Trending up moderately 🟢.
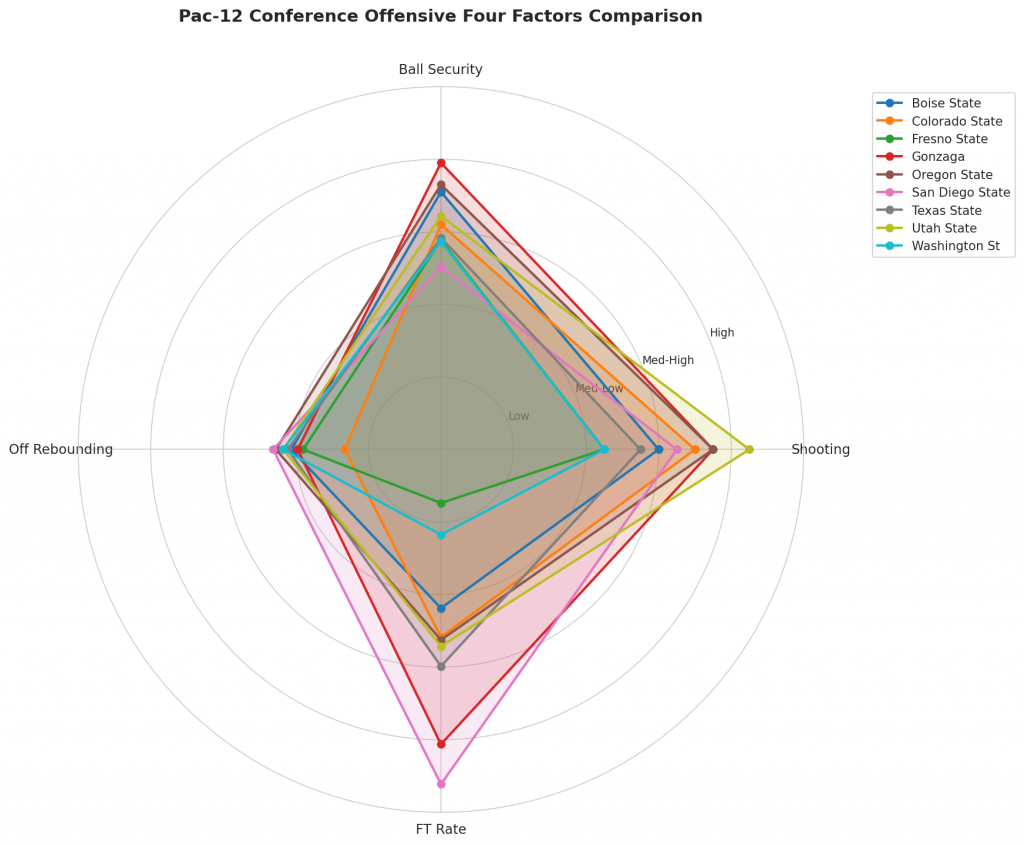
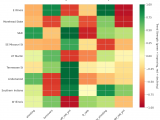
Figure 2: Offensive Four Factors comparison across Pac-12 Conference teams. The radar chart shows each team’s shooting efficiency (eFG%), ball security (TOV%), offensive rebounding (OREB%), and free throw generation (FT Rate).
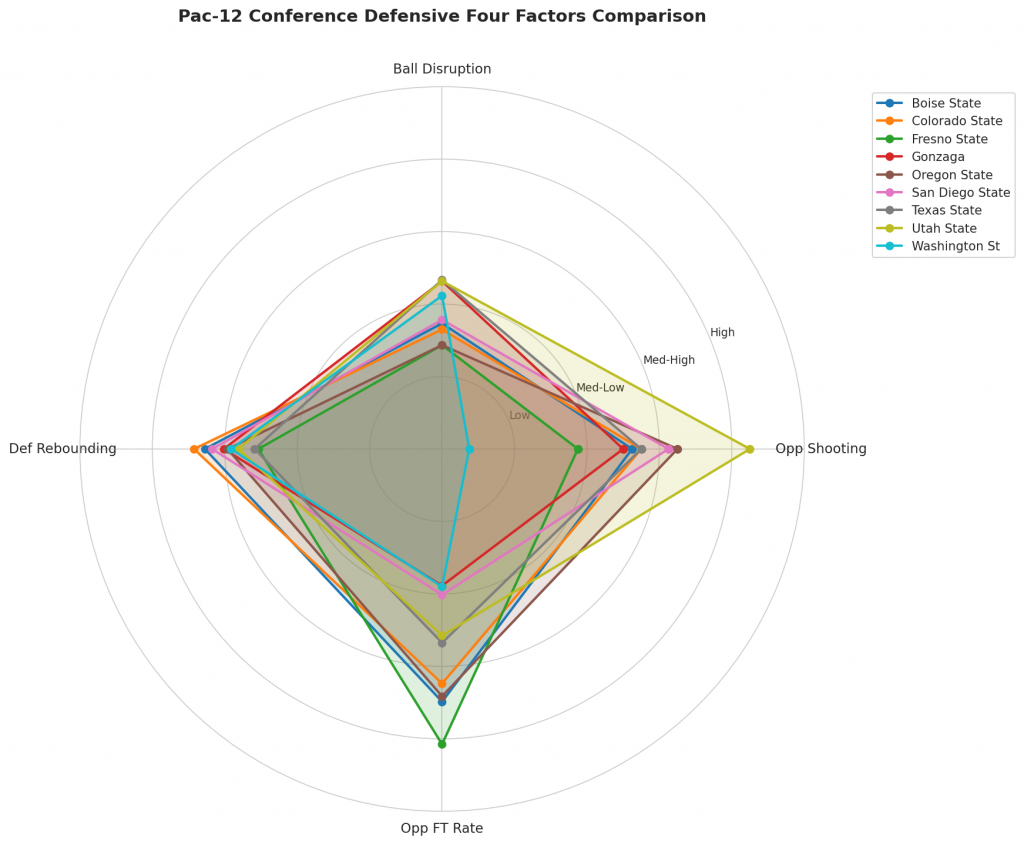
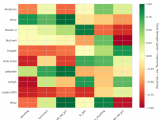
Figure 3: Defensive Four Factors comparison across Pac-12 Conference teams. The radar chart shows each team’s opponent shooting defense (Opp eFG%), ball disruption (forcing TOV%), defensive rebounding (DREB%), and opponent free throw prevention (Opp FT Rate).
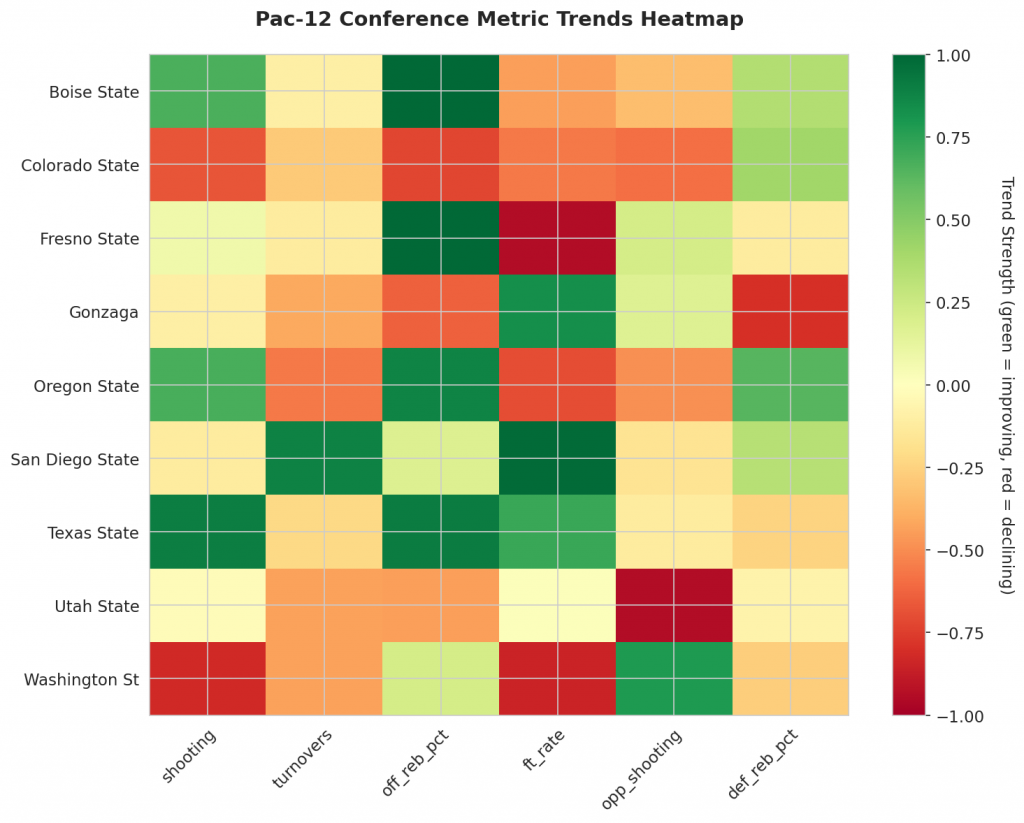
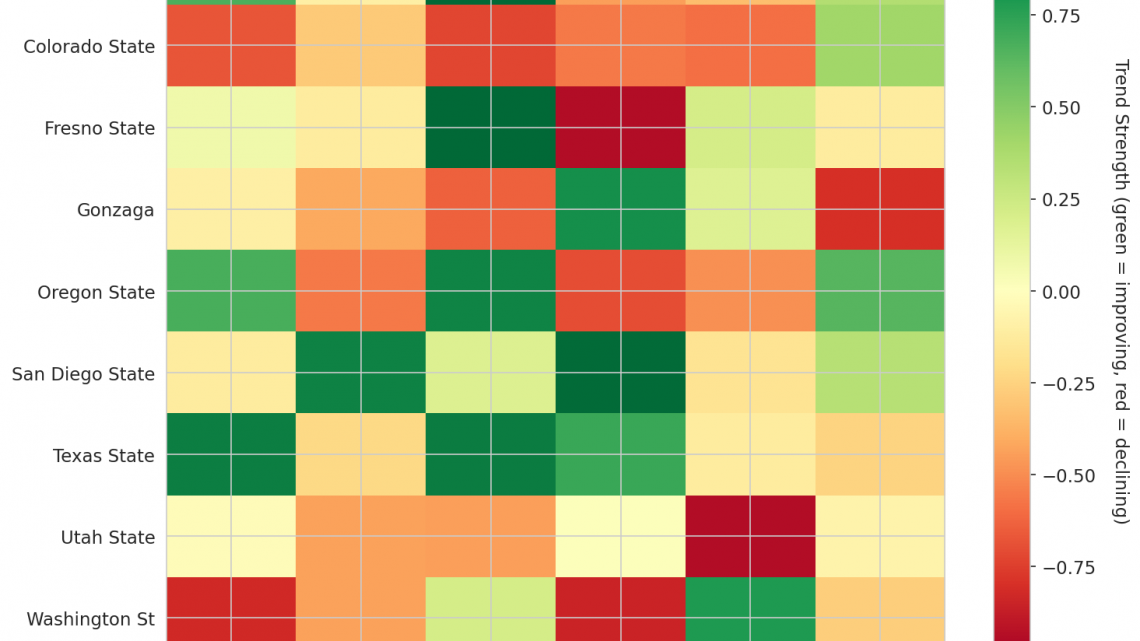
Figure 4: MACD trends heatmap showing which metrics are improving (green) or declining (red) for each team. Stronger colors indicate more pronounced trends.
Looking Ahead
This Week 1 analysis examines key momentum indicators across teams, distinguishing between programs achieving genuine improvement and those facing early challenges. Offensively, Boise State stands out as the team with the most significant positive trajectory. The Bulldogs have demonstrated strong upward trends in both shooting efficiency (Season Avg: 0.54) and offensive rebounding percentage (Season Avg: 0.315). Both metrics are trending up strongly, indicating a consistent increase in value that suggests sustainable improvement. Conversely, Colorado State presents a divergent picture; despite a high season average for shooting (0.58), the trend is moving down strongly, signaling a worsening offensive output. Similarly, their offensive rebounding percentage (Season Avg: 0.256) is trending down strongly, compounding concerns regarding scoring sustainability.
On the defensive end of the floor, momentum shifts appear less favorable for several programs in this initial stretch. Boise State and San Diego State are both experiencing strong downward trends in opposing turnovers (Boise State Season Avg: 0.154; San Diego State Season Avg: 0.157). In these instances, a “Down” trend with the interpretation of forcing FEWER turnovers indicates a decline in defensive pressure. Fresno State follows this pattern, showing a strong downward trend in opponent turnovers (Season Avg: 0.136), suggesting an inability to generate steals as effectively as previously expected. Additionally, Gonzaga’s defensive rebounding percentage (Season Avg: 0.741) is trending down strongly, which translates directly to allowing more offensive boards for opponents, a critical vulnerability for any elite-level program. As the schedule progresses, these trends offer a clear diagnostic tool to determine if early struggles or gains solidify into season-long realities.
Metrics Glossary
Four Factors (Dean Oliver’s framework for basketball success):
- eFG% (Effective Field Goal %): Field goal percentage adjusted for 3-pointers being worth more (FGM + 0.5×3PM) / FGA. Higher is better offensively, lower is better defensively.
- TOV% (Turnover Rate): Turnovers per 100 possessions. Lower is better offensively (taking care of the ball), higher is better defensively (forcing turnovers).
- OREB% / DREB% (Offensive/Defensive Rebound Rate): Percentage of available rebounds grabbed. Offensive rebounds create second-chance points; defensive rebounds end opponent possessions.
- FTR (Free Throw Rate): Free throws made per field goal attempt (FTM/FGA). Measures ability to get to the line AND convert. Higher is better offensively, lower is better defensively.
Other Metrics:
- Elo Rating: Chess-style rating system that updates based on game results and opponent strength. Higher Elo indicates stronger team.
- Efficiency Margin: Point differential per 100 possessions (Offensive Efficiency – Defensive Efficiency). Accounts for pace of play.
- MACD (Moving Average Convergence Divergence): Trend indicator comparing 12-game and 26-game exponential moving averages. Positive MACD = improving trend, Negative MACD = declining trend.
Analysis powered by HoopSci’s advanced metrics and MACD trending indicators.