Mountain West Update: Week 2
November 16, 2026Strongest Offensive Trends
- Air Force, Off Reb Pct, Up, Trend Strength: 0.054 – The steady upward movement of Air Force’s rebounding percentage suggests an improving ability to secure second chances on both ends of the floor, a development that should positively influence overall possession control throughout the season.
- San Jose State, Shooting, Up, Trend Strength: 0.031 – San Jose State has shown marked improvement in its shooting performance throughout the current season, helping to enhance overall offensive efficiency.
- Air Force, Turnovers, Down, Trend Strength: -0.02 – The reduction in turnovers for Air Force has begun to enhance their overall offensive execution.
- Nevada, Off Reb Pct, Up, Trend Strength: 0.015 – The Wolf Pack’s defense has found momentum on the glass, as improved possession of missed field goals helps stem opponent second-chance chances.
- New Mexico, Turnovers, Down, Trend Strength: -0.012 – New Mexico’s reduction in turnovers is reflecting positively on their play by minimizing wasted possessions, which directly supports a more efficient offensive performance throughout the current season.
Strongest Defensive Trends
- Air Force, Def Reb Pct, Down, Trend Strength: -0.021 – Air Force faces a troubling decline in their defensive rebounding efforts, where granting opponents too many chances to grab offensive boards hampers their ability to dominate the glass and stifle the opposing team’s scoring opportunities.
- Wyoming, Opp Shooting, Down, Trend Strength: -0.02 – As Wyoming moves deeper into the season, the noticeable uptick in opponents’ shooting accuracy reveals a defensive vulnerability that is allowing easy scoring opportunities and undermining their overall stability.
- Wyoming, Def Reb Pct, Down, Trend Strength: -0.012 – Wyoming faces a significant hurdle as the Laramie Bullpups struggle to secure defensive boards, leaving them vulnerable to opponent second chances throughout this week’s slate of games.
- Grand Canyon, Def Reb Pct, Up, Trend Strength: 0.012 – Grand Canyon is showing marked improvement in its ability to secure defensive rebounds, indicating a growing capacity to limit second-chance opportunities for opponents.
- Nevada, Opp Turnovers, Up, Trend Strength: 0.008 – Nevada has demonstrated a significant uptick in disrupting opposing ball flow, an evolution that suggests their defensive cohesion is increasingly translating into scoring opportunities.
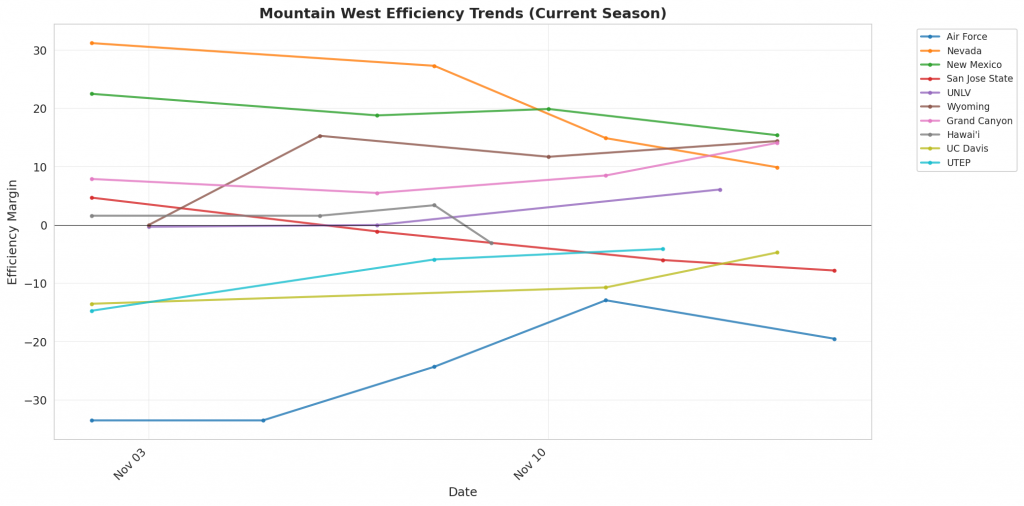
Figure 1: Efficiency margin trends for Mountain West teams throughout the season. Teams trending upward show improving performance, while downward trends indicate struggles.
Conference Snapshot
- Week Dates: November 09 – November 15, 2026
- Trending Up (Efficiency):New Mexico, San Jose State, UNLV, Wyoming, Grand Canyon
- Trending Down (Efficiency):Air Force, Nevada, Hawai’i, UC Davis
Team-by-Team Analysis
Air Force
Record: 3-2 | Elo: 1326.8 (ranked 366 of 365) | Efficiency Margin: -19.46 (ranked 308 of 365)
Offensive Trends:
- Turnovers (Turnovers): Currently ranked 92 of 365 in D1. Trending down strongly 🟢.
- Off Reb Pct (Offensive Rebounding): Currently ranked 137 of 365 in D1. Trending up strongly 🟢.
Defensive Trends:
- Def Reb Pct (Defensive Rebounding): Currently ranked 332 of 365 in D1. Trending down strongly 🔴.
- Opp Turnovers (Opp Turnovers): Currently ranked 204 of 365 in D1. Trending up moderately 🟢.
Grand Canyon
Record: 4-0 | Elo: 1608.1 (ranked 51 of 365) | Efficiency Margin: +14.14 (ranked 77 of 365)
Offensive Trends:
- Shooting (Shooting): Currently ranked 33 of 365 in D1. Trending up strongly 🟢.
- Turnovers (Turnovers): Currently ranked 41 of 365 in D1. Trending down strongly 🟢.
Defensive Trends:
- Def Reb Pct (Defensive Rebounding): Currently ranked 23 of 365 in D1. Trending up strongly 🟢.
- Opp Shooting (Opp Shooting): Currently ranked 77 of 365 in D1. Trending down moderately 🟢.
Hawai’i
Record: 3-1 | Elo: 1547.1 (ranked 110 of 365) | Efficiency Margin: -3.08 (ranked 174 of 365)
Offensive Trends:
- Shooting (Shooting): Currently ranked 267 of 365 in D1. Trending down strongly 🔴.
- Turnovers (Turnovers): Currently ranked 80 of 365 in D1. Trending down strongly 🟢.
Defensive Trends:
- Opp Shooting (Opp Shooting): Currently ranked 264 of 365 in D1. Trending up strongly 🔴.
- Opp Turnovers (Opp Turnovers): Currently ranked 33 of 365 in D1. Trending up strongly 🟢.
Nevada
Record: 2-2 | Elo: 1582.5 (ranked 67 of 365) | Efficiency Margin: +9.90 (ranked 96 of 365)
Offensive Trends:
- Off Reb Pct (Offensive Rebounding): Currently ranked 78 of 365 in D1. Trending up strongly 🟢.
- Shooting (Shooting): Currently ranked 231 of 365 in D1. Trending down moderately 🔴.
Defensive Trends:
- Opp Turnovers (Opp Turnovers): Currently ranked 53 of 365 in D1. Trending up strongly 🟢.
- Opp Shooting (Opp Shooting): Currently ranked 89 of 365 in D1. Trending down moderately 🟢.
New Mexico
Record: 3-1 | Elo: 1628.9 (ranked 38 of 365) | Efficiency Margin: +15.37 (ranked 66 of 365)
Offensive Trends:
- Turnovers (Turnovers): Currently ranked 1 of 365 in D1. Trending down strongly 🟢.
- Shooting (Shooting): Currently ranked 49 of 365 in D1. Trending up weakly 🟢.
Defensive Trends:
- Opp Turnovers (Opp Turnovers): Currently ranked 62 of 365 in D1. Trending up moderately 🟢.
- Opp Shooting (Opp Shooting): Currently ranked 160 of 365 in D1. Trending up weakly 🔴.
San Jose State
Record: 2-2 | Elo: 1416.8 (ranked 310 of 365) | Efficiency Margin: -7.80 (ranked 214 of 365)
Offensive Trends:
- Shooting (Shooting): Currently ranked 13 of 365 in D1. Trending up strongly 🟢.
- Turnovers (Turnovers): Currently ranked 298 of 365 in D1. Trending up strongly 🔴.
Defensive Trends:
- Opp Shooting (Opp Shooting): Currently ranked 328 of 365 in D1. Trending up moderately 🔴.
- Def Reb Pct (Defensive Rebounding): Currently ranked 166 of 365 in D1. Trending up moderately 🟢.
UC Davis
Record: 2-1 | Elo: 1505.2 (ranked 180 of 365) | Efficiency Margin: -4.69 (ranked 190 of 365)
Offensive Trends:
- Turnovers (Turnovers): Currently ranked 344 of 365 in D1. Trending up strongly 🔴.
- Off Reb Pct (Offensive Rebounding): Currently ranked 295 of 365 in D1. Trending down strongly 🔴.
Defensive Trends:
- Opp Shooting (Opp Shooting): Currently ranked 42 of 365 in D1. Trending down strongly 🟢.
- Def Reb Pct (Defensive Rebounding): Currently ranked 79 of 365 in D1. Trending up moderately 🟢.
UNLV
Record: 3-0 | Elo: 1575.6 (ranked 73 of 365) | Efficiency Margin: +6.10 (ranked 118 of 365)
Offensive Trends:
- Shooting (Shooting): Currently ranked 43 of 365 in D1. Trending up strongly 🟢.
- Turnovers (Turnovers): Currently ranked 223 of 365 in D1. Trending up strongly 🔴.
Defensive Trends:
- Opp Shooting (Opp Shooting): Currently ranked 246 of 365 in D1. Trending down moderately 🟢.
- Def Reb Pct (Defensive Rebounding): Currently ranked 119 of 365 in D1. Trending down moderately 🔴.
UTEP
Record: 2-1 | Elo: 1452.7 (ranked 257 of 365) | Efficiency Margin: -4.11 (ranked 186 of 365)
Offensive Trends:
- Shooting (Shooting): Currently ranked 189 of 365 in D1. Trending up weakly 🟢.
- Turnovers (Turnovers): Currently ranked 114 of 365 in D1. Trending up weakly 🔴.
Defensive Trends:
- Opp Turnovers (Opp Turnovers): Currently ranked 23 of 365 in D1. Trending up strongly 🟢.
- Opp Shooting (Opp Shooting): Currently ranked 168 of 365 in D1. Trending down moderately 🟢.
Wyoming
Record: 3-1 | Elo: 1512.2 (ranked 168 of 365) | Efficiency Margin: +14.43 (ranked 73 of 365)
Offensive Trends:
- Off Reb Pct (Offensive Rebounding): Currently ranked 2 of 365 in D1. Trending up strongly 🟢.
- Shooting (Shooting): Currently ranked 172 of 365 in D1. Trending up weakly 🟢.
Defensive Trends:
- Opp Shooting (Opp Shooting): Currently ranked 46 of 365 in D1. Trending down strongly 🟢.
- Def Reb Pct (Defensive Rebounding): Currently ranked 104 of 365 in D1. Trending down strongly 🔴.
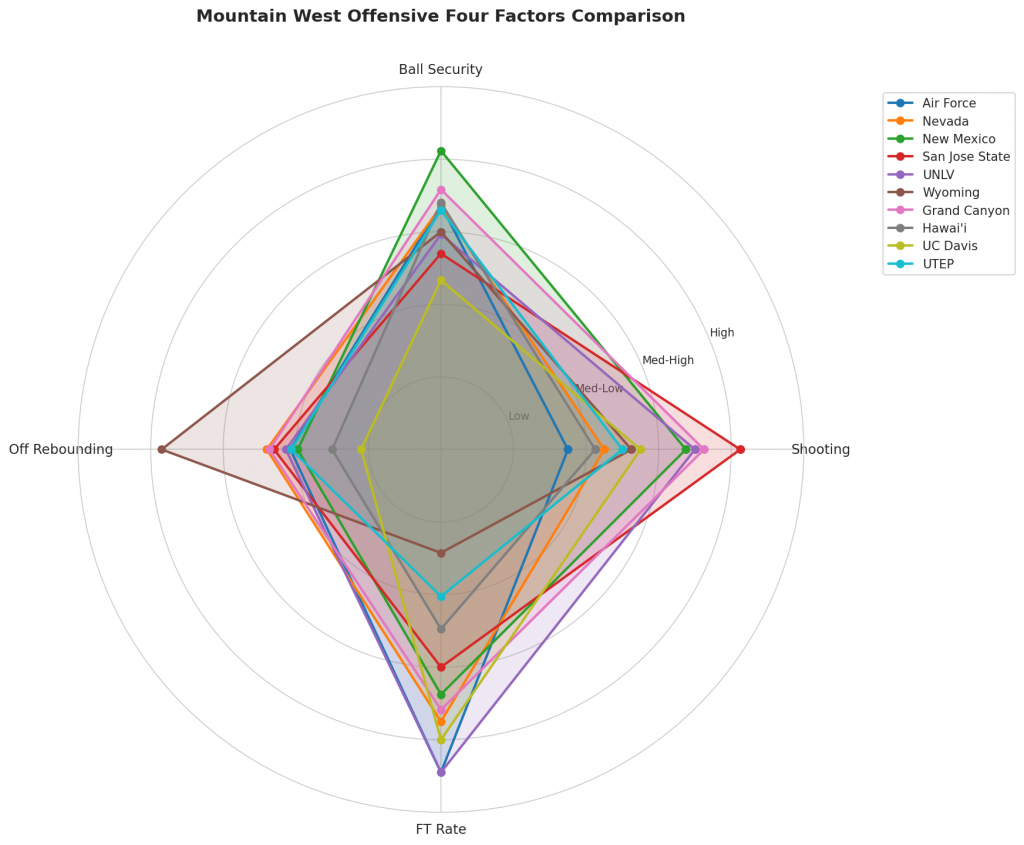
Figure 2: Offensive Four Factors comparison across Mountain West teams. The radar chart shows each team’s shooting efficiency (eFG%), ball security (TOV%), offensive rebounding (OREB%), and free throw generation (FT Rate).
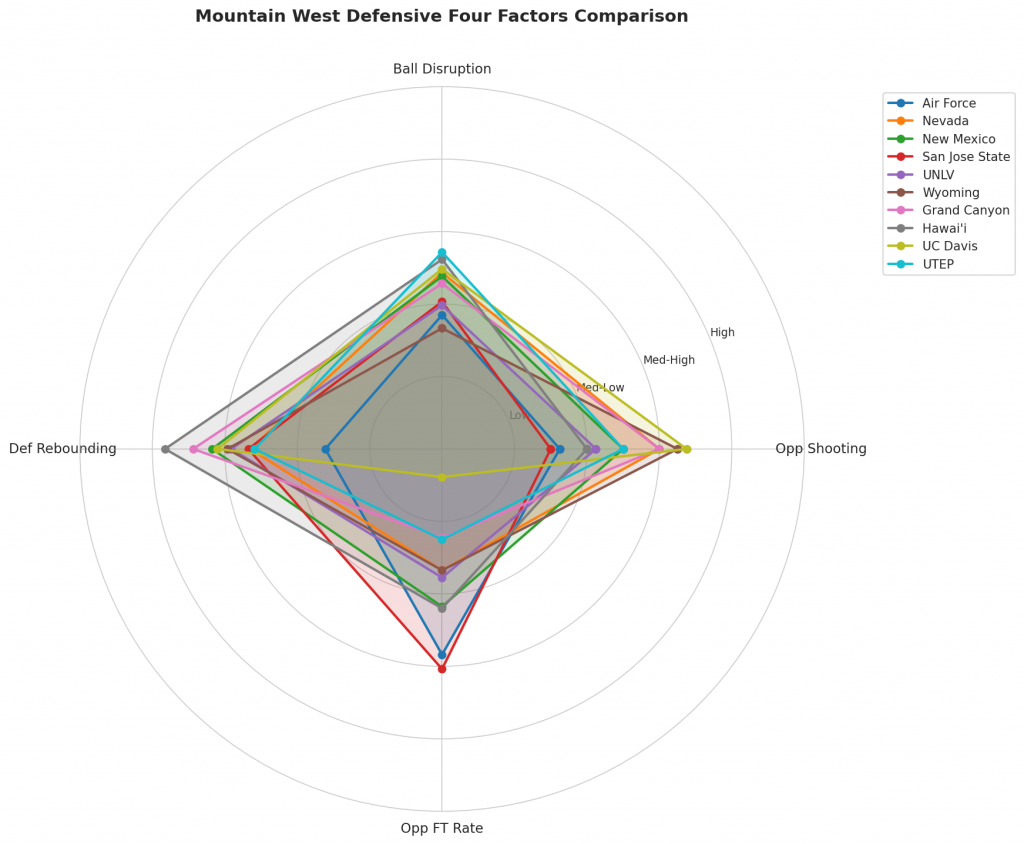
Figure 3: Defensive Four Factors comparison across Mountain West teams. The radar chart shows each team’s opponent shooting defense (Opp eFG%), ball disruption (forcing TOV%), defensive rebounding (DREB%), and opponent free throw prevention (Opp FT Rate).
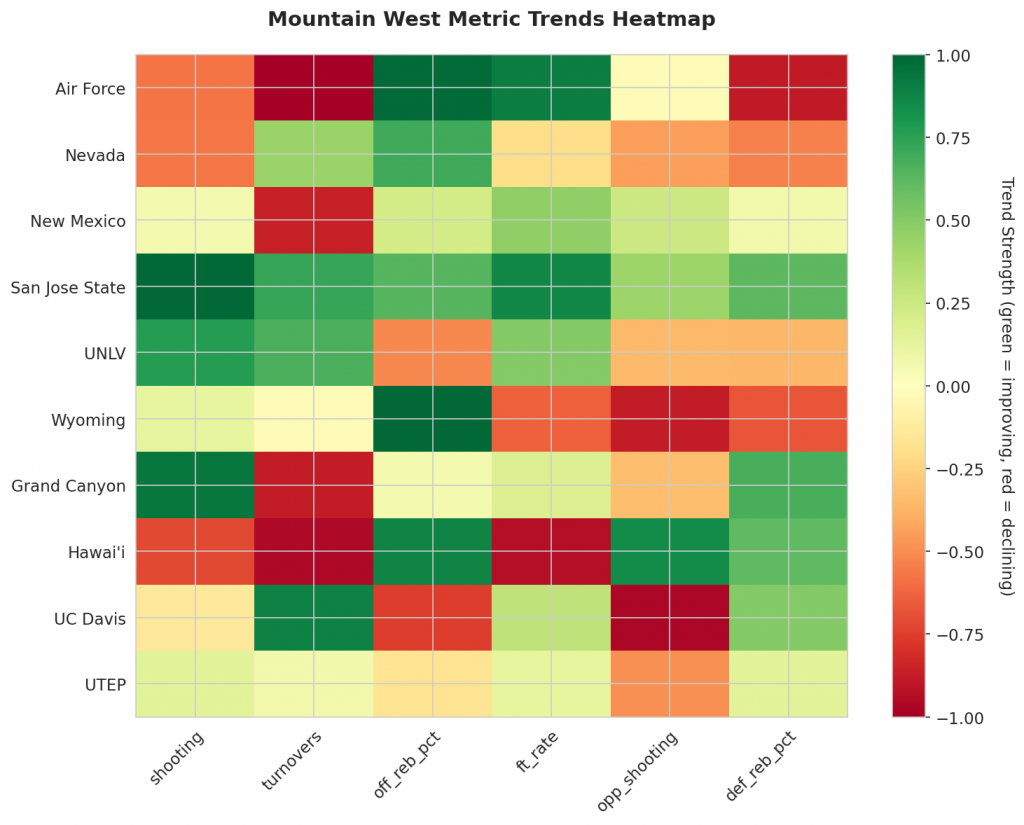
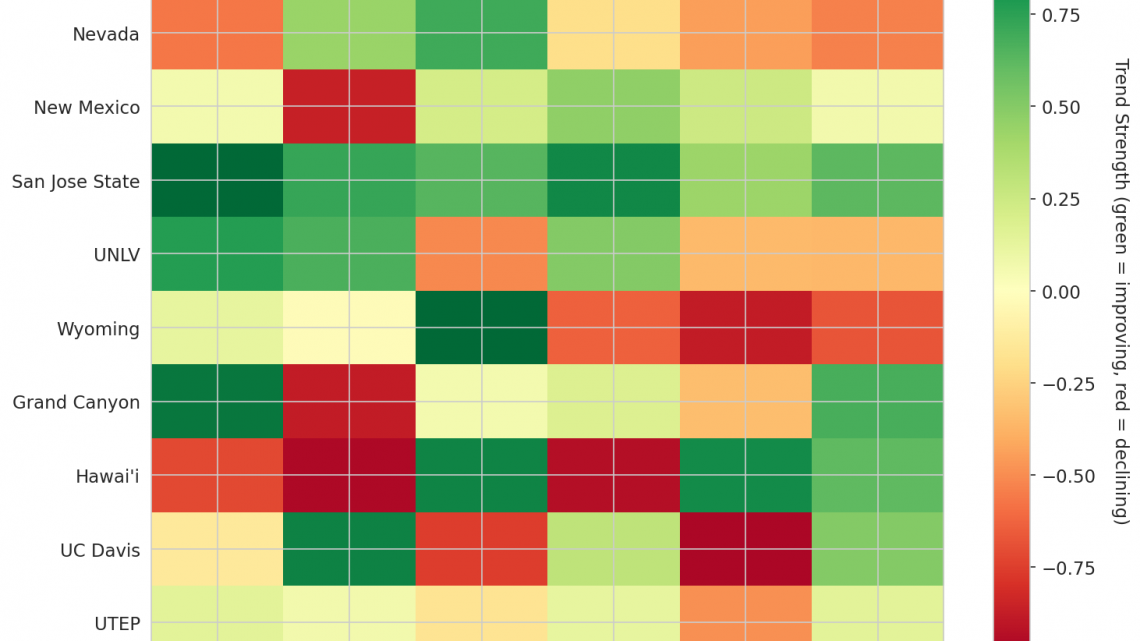
Figure 4: MACD trends heatmap showing which metrics are improving (green) or declining (red) for each team. Stronger colors indicate more pronounced trends.
Looking Ahead
Air Force has displayed dual signs of stabilization on the scoreboard, trending strongly down in turnovers with a season average of 0.148 to indicate better ball security. Simultaneously, the team is trending strongly up in offensive rebound percentage, currently sitting at 0.316, which signals an enhanced ability to secure second-chance points.
Nevada presents a similar picture of offensive evolution, trending strongly up in offensive rebound percentage with a season average of 0.342. This upward trend reflects a growing proficiency in extending possessions and maintaining pressure on the defensive glass. New Mexico has focused heavily on ball security, trending strongly down in turnovers with a season average of 0.103. The decreasing value demonstrates significant progress in minimizing live-ball mistakes.
On the defensive end, Air Force faces a notable struggle regarding rebounding. Their defensive rebound percentage is trending strongly down at a season average of 0.629, indicating a worsening trend where they are allowing more offensive boards to opponents. Nevada, however, shows marked improvement in forcing opponent errors, trending strongly up in opponent turnovers with a season average of 0.196. An increasing value for this metric signifies a defense that is successfully inducing mistakes from opposing teams.
Wyoming offers a mixed defensive report card. The unit is performing well against shooting efficiency, trending strongly down in opponent shooting at a season average of 0.44. This decreasing value confirms the defense is holding opponents to lower scoring percentages. However, this success comes at the cost of rebounding consistency; Wyoming’s defensive rebound percentage is trending strongly down at a season average of 0.737, indicating a decline in securing their own boards and allowing more second-chance opportunities to others. These metrics provide a granular view of where each Mountain West team stands immediately following Week 2. Updated analysis will follow next week as the season continues.
Metrics Glossary
Four Factors (Dean Oliver’s framework for basketball success):
- eFG% (Effective Field Goal %): Field goal percentage adjusted for 3-pointers being worth more (FGM + 0.5×3PM) / FGA. Higher is better offensively, lower is better defensively.
- TOV% (Turnover Rate): Turnovers per 100 possessions. Lower is better offensively (taking care of the ball), higher is better defensively (forcing turnovers).
- OREB% / DREB% (Offensive/Defensive Rebound Rate): Percentage of available rebounds grabbed. Offensive rebounds create second-chance points; defensive rebounds end opponent possessions.
- FTR (Free Throw Rate): Free throws made per field goal attempt (FTM/FGA). Measures ability to get to the line AND convert. Higher is better offensively, lower is better defensively.
Other Metrics:
- Elo Rating: Chess-style rating system that updates based on game results and opponent strength. Higher Elo indicates stronger team.
- Efficiency Margin: Point differential per 100 possessions (Offensive Efficiency – Defensive Efficiency). Accounts for pace of play.
- MACD (Moving Average Convergence Divergence): Trend indicator comparing 12-game and 26-game exponential moving averages. Positive MACD = improving trend, Negative MACD = declining trend.
Analysis powered by HoopSci’s advanced metrics and MACD trending indicators.