Summit League Update: Week 2
November 16, 2026Strongest Offensive Trends
- Omaha, Off Reb Pct, Up, Trend Strength: 0.058 – Omaha shows marked improvement in its rebounding percentage, a positive shift that suggests stronger board control is helping to support their overall game flow.
- Omaha, Shooting, Down, Trend Strength: -0.036 – Omaha’s offensive performance has deteriorated as inconsistent shooting continues to hinder their overall team results.
- North Dakota, Off Reb Pct, Down, Trend Strength: -0.03 – The declining percentage of rebounds secured by North Dakota has become a growing concern for the team’s overall performance.
- North Dakota St, Shooting, Down, Trend Strength: -0.023 – The offensive struggle North Dakota St has encountered early in the campaign stems from a persistent inability to convert shot attempts into points, hindering their overall production for the season’s first weeks.
- Oral Roberts, Shooting, Up, Trend Strength: 0.013 – Oral Roberts is exhibiting an upward trajectory in shooting efficiency that serves to enhance its overall offensive production.
Strongest Defensive Trends
- South Dakota St, Opp Shooting, Down, Trend Strength: -0.02 – South Dakota St has demonstrated progress in limiting shooting efficiency for their opposition during this season’s opening week.
- North Dakota St, Opp Shooting, Up, Trend Strength: 0.019 – North Dakota St is struggling to contain opposing scoring as their defensive efficiency declines throughout this early season stretch.
- North Dakota, Def Reb Pct, Down, Trend Strength: -0.019 – North Dakota is facing a growing concern as its ability to secure defensive rebounds declines, resulting in opponents gaining more opportunities on the offensive glass throughout the season.
- South Dakota, Def Reb Pct, Up, Trend Strength: 0.014 – South Dakota has established a significant strength in securing defensive stops, effectively stifling opponents from gaining crucial second-chance possessions throughout their games this season.
- Oral Roberts, Opp Shooting, Down, Trend Strength: -0.013 – Oral Roberts is showing encouraging signs of progress by limiting its opponents to fewer shots from beyond the arc as the season unfolds.
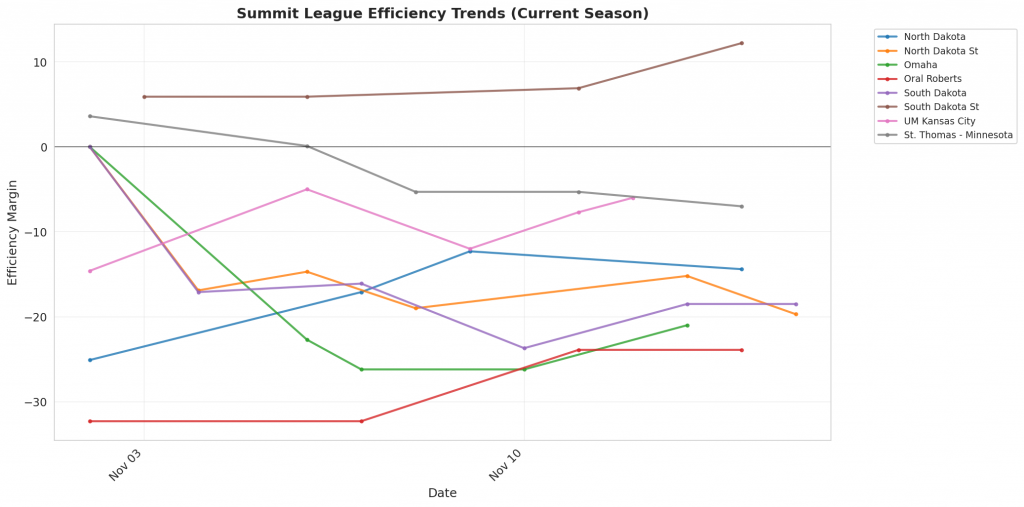
Figure 1: Efficiency margin trends for Summit League teams throughout the season. Teams trending upward show improving performance, while downward trends indicate struggles.
Conference Snapshot
- Week Dates: November 09 – November 15, 2026
- Trending Up (Efficiency):Oral Roberts, South Dakota, UM Kansas City
- Trending Down (Efficiency):North Dakota, North Dakota St, Omaha, South Dakota St, St. Thomas – Minnesota
Team-by-Team Analysis
North Dakota
Record: 1-3 | Elo: 1467.3 (ranked 240 of 365) | Efficiency Margin: -14.37 (ranked 277 of 365)
Offensive Trends:
- Off Reb Pct (Offensive Rebounding): Currently ranked 259 of 365 in D1. Trending down strongly 🔴.
- Shooting (Shooting): Currently ranked 286 of 365 in D1. Trending down moderately 🔴.
Defensive Trends:
- Def Reb Pct (Defensive Rebounding): Currently ranked 301 of 365 in D1. Trending down strongly 🔴.
- Opp Shooting (Opp Shooting): Currently ranked 357 of 365 in D1. Trending up moderately 🔴.
North Dakota St
Record: 2-4 | Elo: 1556.7 (ranked 96 of 365) | Efficiency Margin: -19.65 (ranked 311 of 365)
Offensive Trends:
- Shooting (Shooting): Currently ranked 260 of 365 in D1. Trending down strongly 🔴.
- Turnovers (Turnovers): Currently ranked 94 of 365 in D1. Trending up weakly 🔴.
Defensive Trends:
- Opp Shooting (Opp Shooting): Currently ranked 363 of 365 in D1. Trending up strongly 🔴.
- Def Reb Pct (Defensive Rebounding): Currently ranked 88 of 365 in D1. Trending down moderately 🔴.
Omaha
Record: 3-2 | Elo: 1488.1 (ranked 210 of 365) | Efficiency Margin: -21.03 (ranked 319 of 365)
Offensive Trends:
- Shooting (Shooting): Currently ranked 345 of 365 in D1. Trending down strongly 🔴.
- Off Reb Pct (Offensive Rebounding): Currently ranked 293 of 365 in D1. Trending up strongly 🟢.
Defensive Trends:
- Opp Turnovers (Opp Turnovers): Currently ranked 225 of 365 in D1. Trending up moderately 🟢.
- Def Reb Pct (Defensive Rebounding): Currently ranked 187 of 365 in D1. Trending down moderately 🔴.
Oral Roberts
Record: 2-2 | Elo: 1372.1 (ranked 349 of 365) | Efficiency Margin: -23.85 (ranked 337 of 365)
Offensive Trends:
- Shooting (Shooting): Currently ranked 347 of 365 in D1. Trending up strongly 🟢.
- Off Reb Pct (Offensive Rebounding): Currently ranked 100 of 365 in D1. Trending up strongly 🟢.
Defensive Trends:
- Opp Shooting (Opp Shooting): Currently ranked 264 of 365 in D1. Trending down strongly 🟢.
- Opp Turnovers (Opp Turnovers): Currently ranked 121 of 365 in D1. Trending up moderately 🟢.
South Dakota
Record: 2-4 | Elo: 1417.8 (ranked 309 of 365) | Efficiency Margin: -18.52 (ranked 305 of 365)
Offensive Trends:
- Shooting (Shooting): Currently ranked 69 of 365 in D1. Trending up strongly 🟢.
- Turnovers (Turnovers): Currently ranked 321 of 365 in D1. Trending up strongly 🔴.
Defensive Trends:
- Def Reb Pct (Defensive Rebounding): Currently ranked 49 of 365 in D1. Trending up strongly 🟢.
- Opp Turnovers (Opp Turnovers): Currently ranked 272 of 365 in D1. Trending down moderately 🔴.
South Dakota St
Record: 4-0 | Elo: 1510.9 (ranked 170 of 365) | Efficiency Margin: +12.25 (ranked 88 of 365)
Offensive Trends:
- Off Reb Pct (Offensive Rebounding): Currently ranked 213 of 365 in D1. Trending up strongly 🟢.
- Shooting (Shooting): Currently ranked 198 of 365 in D1. Trending down moderately 🔴.
Defensive Trends:
- Opp Shooting (Opp Shooting): Currently ranked 17 of 365 in D1. Trending down strongly 🟢.
- Opp Turnovers (Opp Turnovers): Currently ranked 205 of 365 in D1. Trending up moderately 🟢.
St. Thomas – Minnesota
Record: 2-3 | Elo: 1533.0 (ranked 132 of 365) | Efficiency Margin: -7.01 (ranked 207 of 365)
Offensive Trends:
- Off Reb Pct (Offensive Rebounding): Currently ranked 361 of 365 in D1. Trending up strongly 🟢.
- Turnovers (Turnovers): Currently ranked 12 of 365 in D1. Trending down moderately 🟢.
Defensive Trends:
- Opp Turnovers (Opp Turnovers): Currently ranked 335 of 365 in D1. Trending down strongly 🔴.
- Def Reb Pct (Defensive Rebounding): Currently ranked 258 of 365 in D1. Trending down moderately 🔴.
UM Kansas City
Record: 2-3 | Elo: 1336.0 (ranked 362 of 365) | Efficiency Margin: -5.97 (ranked 198 of 365)
Offensive Trends:
- Shooting (Shooting): Currently ranked 80 of 365 in D1. Trending up strongly 🟢.
- Off Reb Pct (Offensive Rebounding): Currently ranked 345 of 365 in D1. Trending down strongly 🔴.
Defensive Trends:
- Opp Shooting (Opp Shooting): Currently ranked 180 of 365 in D1. Trending down moderately 🟢.
- Opp Turnovers (Opp Turnovers): Currently ranked 298 of 365 in D1. Trending down weakly 🔴.
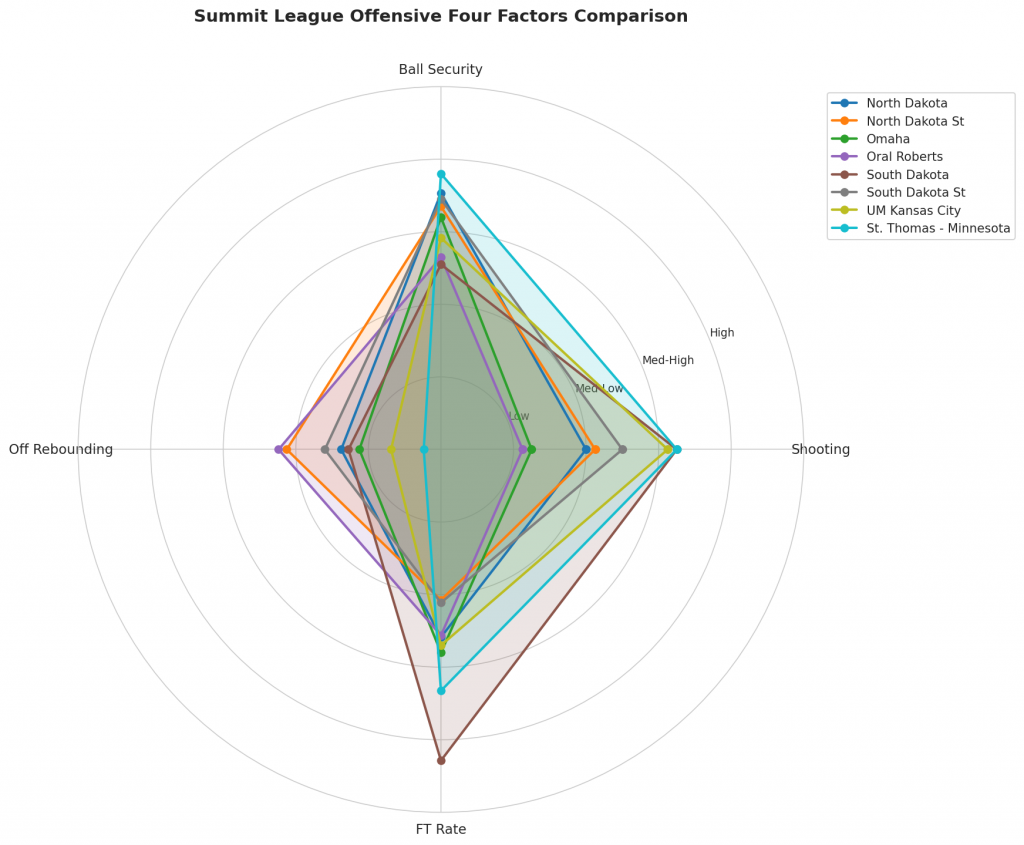
Figure 2: Offensive Four Factors comparison across Summit League teams. The radar chart shows each team’s shooting efficiency (eFG%), ball security (TOV%), offensive rebounding (OREB%), and free throw generation (FT Rate).
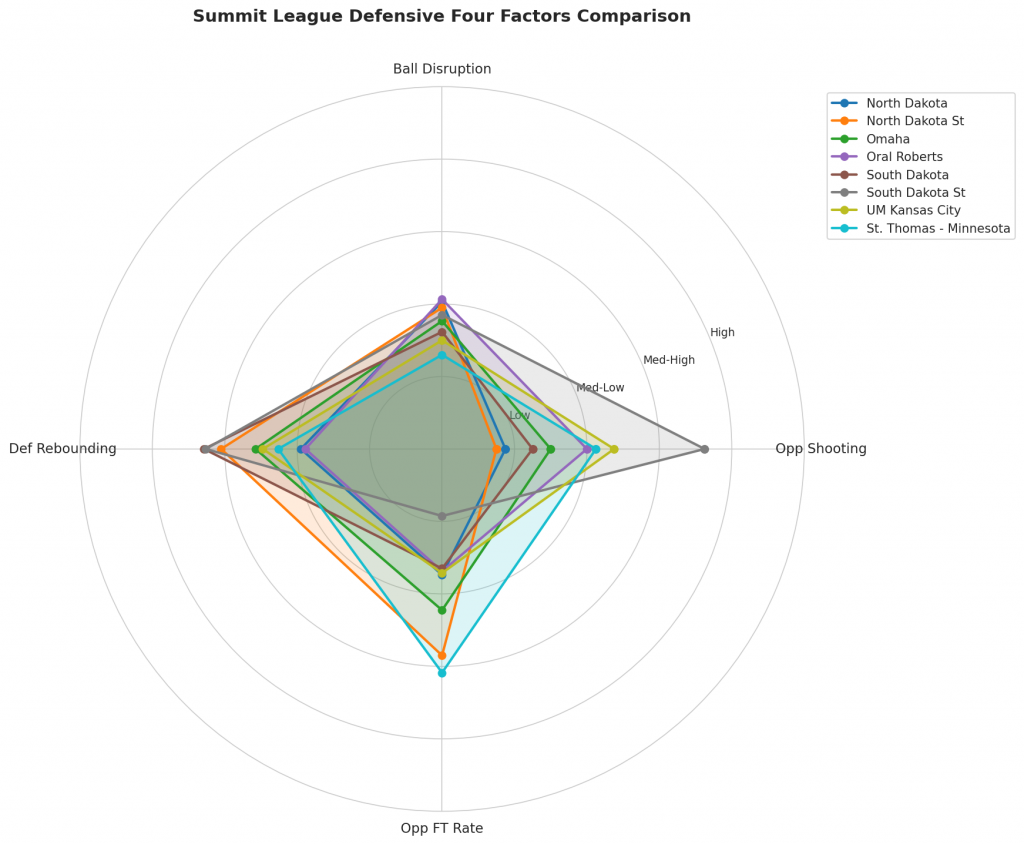
Figure 3: Defensive Four Factors comparison across Summit League teams. The radar chart shows each team’s opponent shooting defense (Opp eFG%), ball disruption (forcing TOV%), defensive rebounding (DREB%), and opponent free throw prevention (Opp FT Rate).
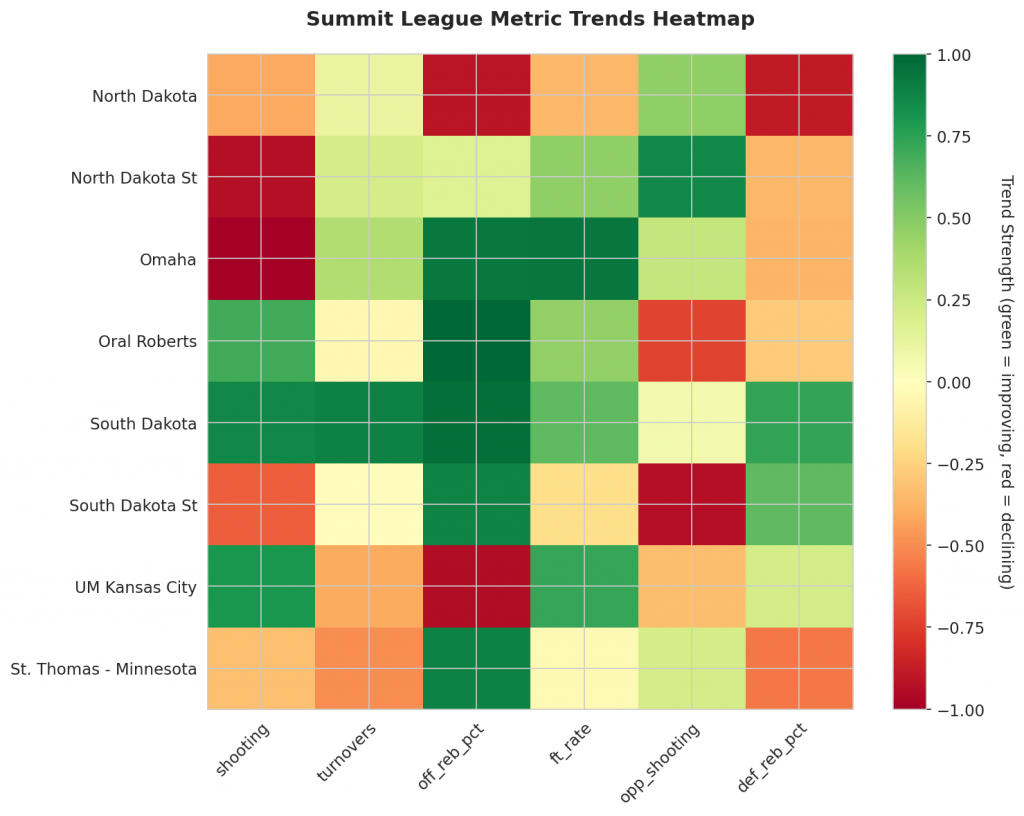
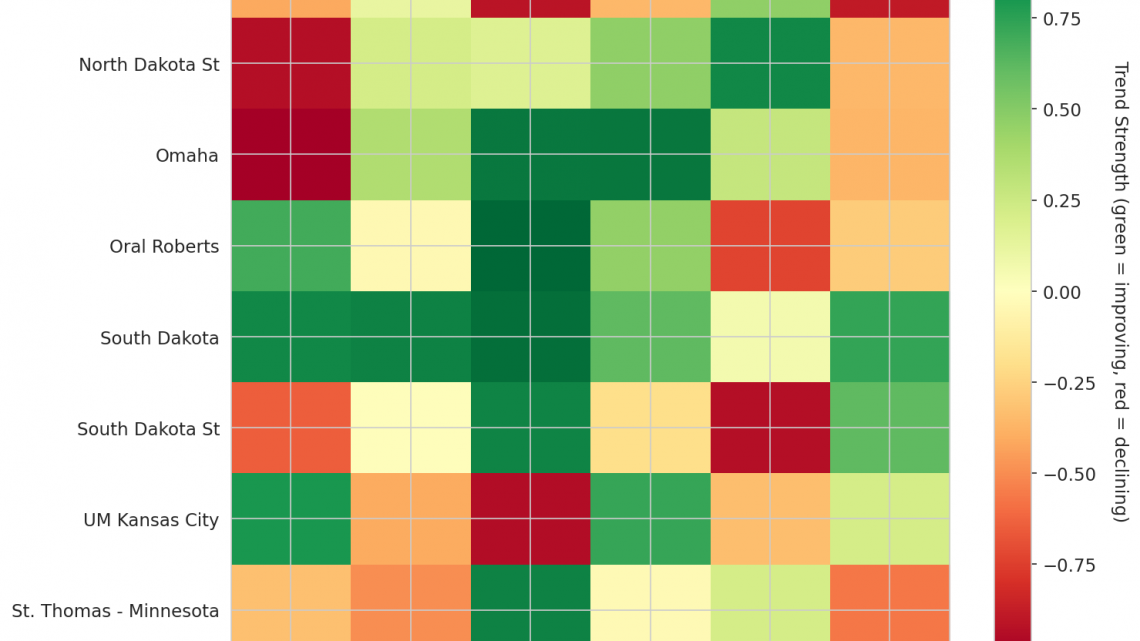
Figure 4: MACD trends heatmap showing which metrics are improving (green) or declining (red) for each team. Stronger colors indicate more pronounced trends.
Looking Ahead
The MACD momentum indicators offer a critical lens for distinguishing genuine performance shifts from unsustainable trajectories as the season progresses through Week 2, revealing how each Summit League team has adapted across their games so far. North Dakota presents a concerning picture where offensive rebounding efficiency sits at a Season Avg of 0.26 and is trending down strongly, while defensive capabilities have eroded as Def Reb Pct declines from an average of approximately 0.656 with strong intensity, signaling that the program is struggling to secure second-chance opportunities against opponents who are grabbing significantly more offensive boards. North Dakota St. faces a distinct downward trajectory in scoring efficiency, where their Shooting metric currently stands at a Season Avg of 0.47 and is trending down strongly with strong strength, indicating a clear struggle to maintain an early-season rhythm. Similarly, Omaha exhibits divergent trends where Shooting percentage sits at a Season Avg of 0.4 and is trending down strongly, marking a decline in offensive output, yet the team is finding success on the glass as Off Reb Pct reaches a Season Avg of 0.24 while trending up strongly to improve their ability to generate second-chance possessions despite shooting difficulties.
On the defensive end, North Dakota St. shows an Opp Shooting metric at a Season Avg of 0.64 that is trending up strongly; however, this represents a worsening trend where opponent efficiency is increasing rather than decreasing. Oral Roberts stands out positively with an Opp Shooting metric at a Season Avg of 0.54 that is trending down strongly, confirming that the program has successfully forced lower percentage looks from rivals. South Dakota demonstrates robust defensive activity as Def Reb Pct holds a Season Avg of 0.763 and is trending up strongly with strong strength, effectively disrupting opponents’ transition opportunities by grabbing more defensive boards. The analysis covers North Dakota, North Dakota St., Omaha, Oral Roberts, and South Dakota to highlight these specific divergent paths, showing that while some teams like South Dakota are adapting their schemes to improve rebounding control, others continue to struggle with fundamental declines in shooting or opponent suppression as the season advances.
Metrics Glossary
Four Factors (Dean Oliver’s framework for basketball success):
- eFG% (Effective Field Goal %): Field goal percentage adjusted for 3-pointers being worth more (FGM + 0.5×3PM) / FGA. Higher is better offensively, lower is better defensively.
- TOV% (Turnover Rate): Turnovers per 100 possessions. Lower is better offensively (taking care of the ball), higher is better defensively (forcing turnovers).
- OREB% / DREB% (Offensive/Defensive Rebound Rate): Percentage of available rebounds grabbed. Offensive rebounds create second-chance points; defensive rebounds end opponent possessions.
- FTR (Free Throw Rate): Free throws made per field goal attempt (FTM/FGA). Measures ability to get to the line AND convert. Higher is better offensively, lower is better defensively.
Other Metrics:
- Elo Rating: Chess-style rating system that updates based on game results and opponent strength. Higher Elo indicates stronger team.
- Efficiency Margin: Point differential per 100 possessions (Offensive Efficiency – Defensive Efficiency). Accounts for pace of play.
- MACD (Moving Average Convergence Divergence): Trend indicator comparing 12-game and 26-game exponential moving averages. Positive MACD = improving trend, Negative MACD = declining trend.
Analysis powered by HoopSci’s advanced metrics and MACD trending indicators.