Week 2: The Dial-Up Report
November 16, 2026In Division I basketball, squads often show significant performance variance depending on their opponents. This week’s analysis isolates “Dial-Up” teams—programs that display a unique split identity based on schedule strength. These groups elevate their play against top-tier competition, appearing as tournament contenders in those matchups, yet they frequently struggle through contests against inferior opposition. The metrics for Week 2 highlight three specific programs currently embodying this dynamic: Loyola-Chicago, Texas A&M-Commerce, and Sacramento St. Unlike teams that maintain a consistent floor regardless of the schedule, these squads rely heavily on external pressure to unlock their potential. When facing elite adversaries, they operate at peak efficiency; however, when defensive pressure drops, their offensive output and overall discipline decline accordingly. The ranking system focuses strictly on how closely a team’s performance aligns with the level of their competition. For Loyola-Chicago, Texas A&M-Commerce, and Sacramento St, the data suggests a pattern where effort and execution are not constant variables but responsive ones. To move beyond the “Dial-Up” designation, these teams must address the inconsistency that allows them to thrive against the best while failing to grind out wins when they hold the advantage. The upcoming weeks will test whether these squads can develop a baseline of excellence independent of the opposition’s quality.
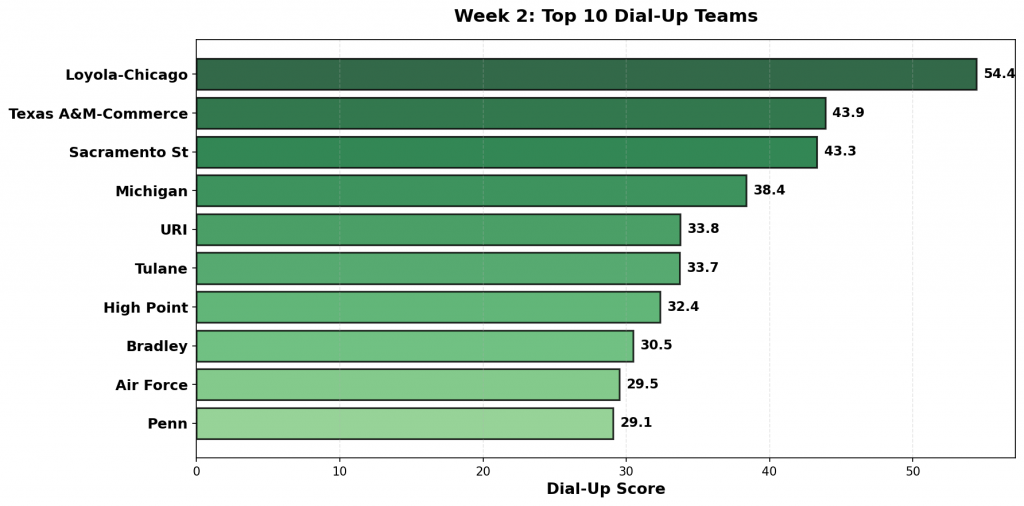
Figure 1: Top 10 teams with the highest Dial-Up scores in Week 2. Scores reflect the combination of overperformance against strong opponents and underperformance against weak ones.
#1: Loyola-Chicago (3-1)
Against #159 Colorado State, #95 Loyola-Chicago pulled off a big win, 73-58. The model expected a margin of -10, but they performed 25 points better than projected. Facing #286 Air Force, #95 Loyola-Chicago suffered a bad loss, 93-107. Favored by 16, they underperformed by 30 points.
Dial-Up Metrics: Exceeded projections by 24.9 total points against strong opponents (1 games); underperformed by 29.5 points against weak competition (1 games).
#2: Texas A&M-Commerce (3-1)
Against #167 Oklahoma, #138 Texas A&M-Commerce pulled off a big win, 68-64. The model expected a margin of -25, but they performed outpacing the projection by 29. Facing #352 Fairleigh Dickinson, #138 Texas A&M-Commerce suffered a bad loss, 76-80. Favored by 26, they underperformed by 30 points.
Dial-Up Metrics: Exceeded projections by 28.8 total points against strong opponents (1 games); underperformed by 30.2 points against weak competition (2 games).
#3: Sacramento St (1-2)
Against #97 Santa Clara, #304 Sacramento St battled tough in a 77-83 loss. The model expected a margin of -27, but they performed beating the line by 21. Facing #191 UC Davis, #304 Sacramento St suffered a bad loss, 56-75. Favored by 3, they underperformed by 22 points.
Dial-Up Metrics: Exceeded projections by 21.0 total points against strong opponents (1 games); underperformed by 22.3 points against weak competition (1 games).
#4: Michigan (3-1)
Against #178 William & Mary, #36 Michigan pulled off a big win, 123-79. The model expected a margin of 17, but they performed +27 versus projection. Facing #279 Oakland, #36 Michigan struggled to put away Oakland, winning just 84-68. Favored by 27, they underperformed by 11 points.
Dial-Up Metrics: Exceeded projections by 27.4 total points against strong opponents (1 games); underperformed by 11.0 points against weak competition (1 games).
#5: URI (5-0)
Against #182 Monmouth, #75 URI pulled off a big win, 84-66. The model expected a margin of -4, but they performed 22 points better than projected. Facing #231 Maine, #75 URI struggled to put away Maine, winning just 71-65. Favored by 18, they underperformed by 12 points.
Dial-Up Metrics: Exceeded projections by 22.2 total points against strong opponents (1 games); underperformed by 11.5 points against weak competition (1 games).
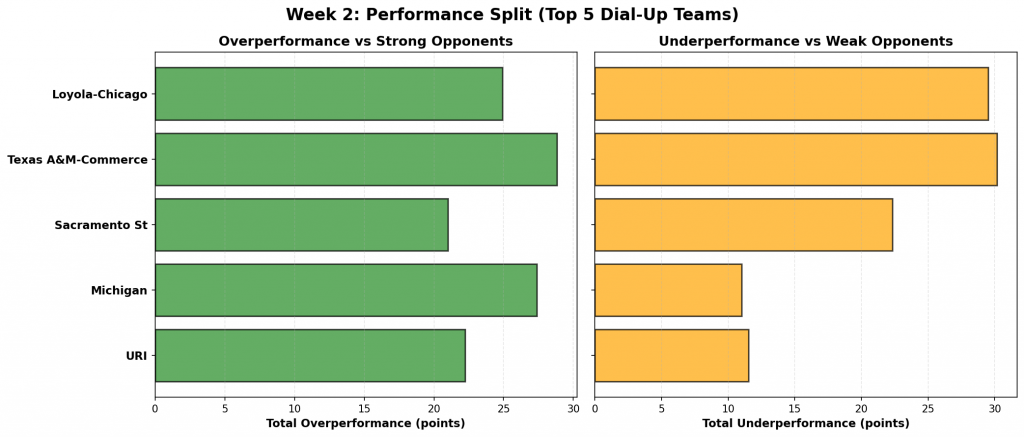
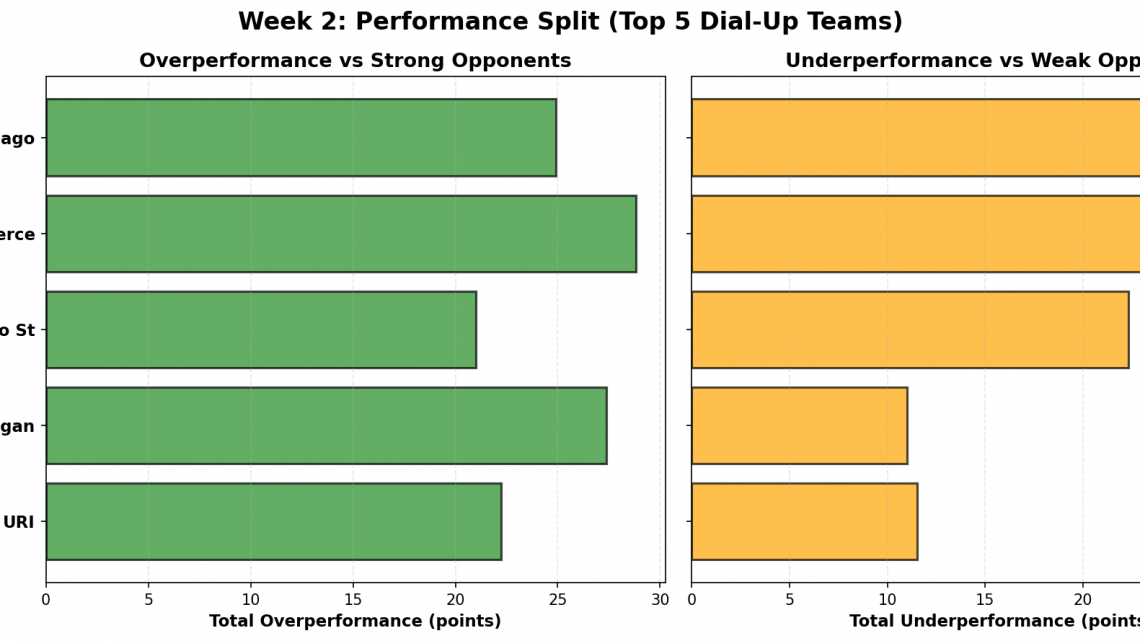
Figure 2: Performance comparison for the top 5 Dial-Up teams. Green bars show total overperformance against strong opponents; orange bars show total underperformance against weak opponents.
#6: Tulane (2-2)
Against #85 Akron, #216 Tulane battled tough in a 63-65 loss. The model expected a margin of -24, but they performed outpacing the projection by 22. Facing #249 Jackson State, #216 Tulane suffered a bad loss, 85-87. Favored by 10, they underperformed by 12 points.
Dial-Up Metrics: Exceeded projections by 22.0 total points against strong opponents (1 games); underperformed by 11.7 points against weak competition (1 games).
#7: High Point (5-0)
Against #37 Saint Louis, #78 High Point pulled off a big win, 68-58. The model expected a margin of -13, but they performed beating the line by 23. Facing #318 Maryland Eastern Shore, #78 High Point struggled to put away Maryland Eastern Shore, winning just 63-49. Favored by 25, they underperformed by 11 points.
Dial-Up Metrics: Exceeded projections by 23.1 total points against strong opponents (1 games); underperformed by 18.6 points against weak competition (2 games).
#8: Bradley (3-2)
Against #114 George Mason, #260 Bradley pulled off a big win, 62-61. The model expected a margin of -4, but they performed +5 versus projection. Facing #289 Coppin State, #260 Bradley struggled to put away Coppin State, winning just 56-54. Favored by 27, they underperformed by 25 points.
Dial-Up Metrics: Exceeded projections by 5.3 total points against strong opponents (1 games); underperformed by 25.2 points against weak competition (1 games).
#9: Air Force (3-2)
Against #95 Loyola Chicago, #286 Air Force pulled off a big win, 107-93. The model expected a margin of -16, but they performed 30 points better than projected.
Dial-Up Metrics: Exceeded projections by 29.5 total points against strong opponents (1 games).
#10: Penn (1-3)
Against #164 Howard, #224 Penn pulled off a big win, 78-65. The model expected a margin of 5, but they performed outpacing the projection by 8. Facing #333 Navy, #224 Penn suffered a bad loss, 76-81. Favored by 17, they underperformed by 22 points.
Dial-Up Metrics: Exceeded projections by 14.2 total points against strong opponents (2 games); underperformed by 22.0 points against weak competition (1 games).
#11: DePaul (4-0)
Against #125 Northwestern, #60 DePaul pulled off a big win, 67-47. The model expected a margin of -9, but they performed beating the line by 29.
Dial-Up Metrics: Exceeded projections by 29.0 total points against strong opponents (1 games).
#12: Utah State (4-0)
Against #183 UC San Diego, #22 Utah State pulled off a big win, 120-82. The model expected a margin of 10, but they performed +28 versus projection.
Dial-Up Metrics: Exceeded projections by 27.6 total points against strong opponents (1 games).
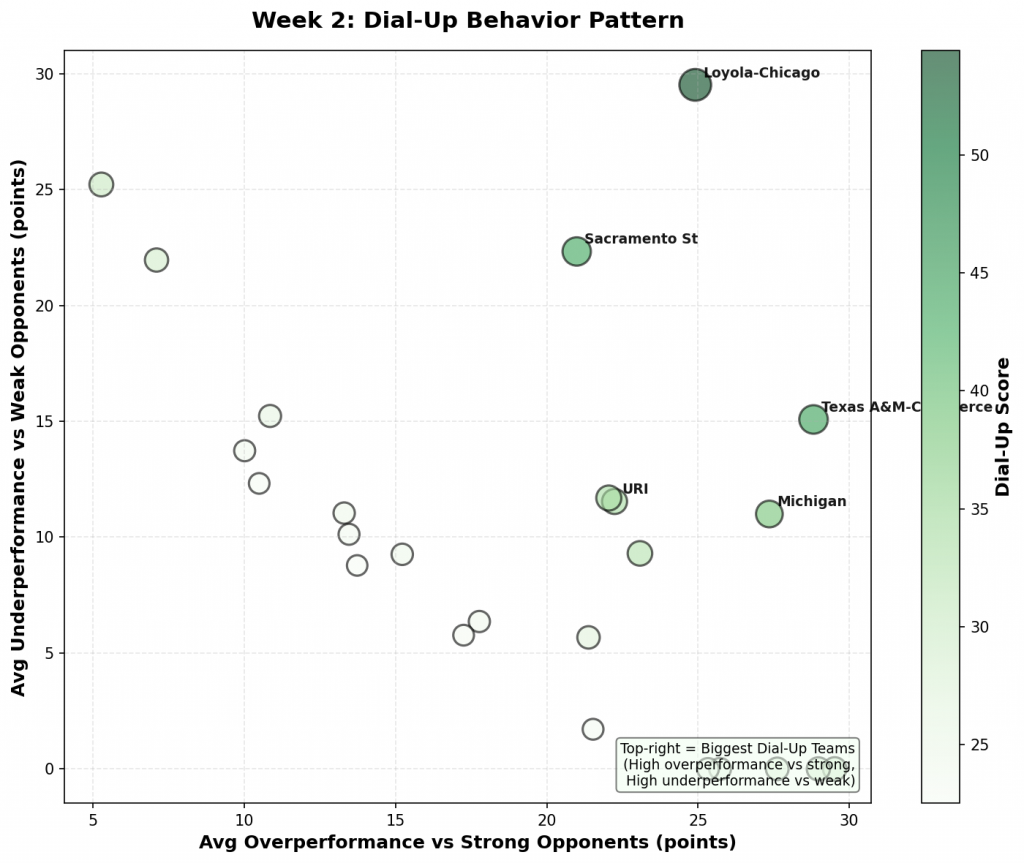
Figure 3: Scatter plot showing the relationship between overperformance against strong opponents (x-axis) and underperformance against weak opponents (y-axis). Bubble size and color indicate Dial-Up score magnitude. Top-right quadrant represents the biggest Dial-Up teams.
#13: Georgia (4-0)
Against #98 North Carolina, #92 Georgia pulled off a big win, 78-70. The model expected a margin of -13, but they performed 21 points better than projected. Facing #290 North Carolina Central, #92 Georgia struggled to put away North Carolina Central, winning just 78-62. Favored by 23, they underperformed by 7 points.
Dial-Up Metrics: Exceeded projections by 21.4 total points against strong opponents (1 games); underperformed by 11.4 points against weak competition (2 games).
#14: Brown (1-4)
Against #134 Siena, #238 Brown battled tough in a 74-79 loss. The model expected a margin of -16, but they performed outpacing the projection by 11. Facing #353 Canisius, #238 Brown suffered a bad loss, 81-86. Favored by 10, they underperformed by 15 points.
Dial-Up Metrics: Exceeded projections by 10.9 total points against strong opponents (1 games); underperformed by 15.2 points against weak competition (1 games).
#15: Tennessee St (2-2)
Against #55 Tennessee, #225 Tennessee St battled tough in a 78-83 loss. The model expected a margin of -31, but they performed beating the line by 26.
Dial-Up Metrics: Exceeded projections by 25.7 total points against strong opponents (1 games).
#16: UCLA (3-0)
Against #58 Arizona, #4 UCLA pulled off a big win, 84-75. The model expected a margin of -16, but they performed +25 versus projection.
Dial-Up Metrics: Exceeded projections by 25.3 total points against strong opponents (1 games).
#17: Little Rock (1-3)
Against #61 VCU, #266 Little Rock battled tough in a 72-82 loss. The model expected a margin of -25, but they performed 15 points better than projected. Facing #316 SE Louisiana, #266 Little Rock suffered a bad loss, 79-83. Favored by 6, they underperformed by 10 points.
Dial-Up Metrics: Exceeded projections by 15.2 total points against strong opponents (1 games); underperformed by 18.5 points against weak competition (2 games).
#18: Niagara (0-4)
Against #41 Iowa State, #322 Niagara battled tough in a 45-66 loss. The model expected a margin of -34, but they performed outpacing the projection by 13. Facing #250 Morgan State, #322 Niagara suffered a bad loss, 67-73. Favored by 5, they underperformed by 11 points.
Dial-Up Metrics: Exceeded projections by 13.3 total points against strong opponents (1 games); underperformed by 11.0 points against weak competition (1 games).
#19: Arizona (3-1)
Against #46 Auburn, #58 Arizona pulled off a big win, 80-69. The model expected a margin of -7, but they performed beating the line by 18. Facing #307 Cal Poly, #58 Arizona struggled to put away Cal Poly, winning just 104-84. Favored by 26, they underperformed by 6 points.
Dial-Up Metrics: Exceeded projections by 17.8 total points against strong opponents (1 games); underperformed by 6.4 points against weak competition (1 games).
#20: Georgetown (4-0)
Against #142 Clemson, #52 Georgetown pulled off a big win, 85-78. The model expected a margin of -8, but they performed +15 versus projection. Facing #291 Delaware State, #52 Georgetown struggled to put away Delaware State, winning just 83-78. Favored by 19, they underperformed by 14 points.
Dial-Up Metrics: Exceeded projections by 20.0 total points against strong opponents (2 games); underperformed by 13.7 points against weak competition (1 games).
#21: Saint Joe’s (4-0)
Against #133 South Florida, #148 Saint Joe’s pulled off a big win, 83-80. The model expected a margin of -10, but they performed 14 points better than projected. Facing #292 Lafayette, #148 Saint Joe’s struggled to put away Lafayette, winning just 67-57. Favored by 26, they underperformed by 16 points.
Dial-Up Metrics: Exceeded projections by 13.5 total points against strong opponents (1 games); underperformed by 30.4 points against weak competition (3 games).
#22: Valparaiso (2-1)
Against #67 Purdue, #94 Valparaiso pulled off a big win, 83-80. The model expected a margin of -18, but they performed outpacing the projection by 22. Facing #350 Western Illinois, #94 Valparaiso struggled to put away Western Illinois, winning just 80-58. Favored by 24, they underperformed by 2 points.
Dial-Up Metrics: Exceeded projections by 21.5 total points against strong opponents (1 games); underperformed by 1.7 points against weak competition (1 games).
#23: North Texas (3-1)
Against #93 McNeese, #173 North Texas pulled off a big win, 77-67. The model expected a margin of -7, but they performed beating the line by 17. Facing #190 South Alabama, #173 North Texas struggled to put away South Alabama, winning just 66-65. Favored by 7, they underperformed by 6 points.
Dial-Up Metrics: Exceeded projections by 17.2 total points against strong opponents (1 games); underperformed by 5.8 points against weak competition (1 games).
#24: Belmont (3-1)
Against #116 Furman, #202 Belmont pulled off a big win, 72-62. The model expected a margin of -0, but they performed +10 versus projection. Facing #297 Southern Indiana, #202 Belmont struggled to put away Southern Indiana, winning just 72-54. Favored by 30, they underperformed by 12 points.
Dial-Up Metrics: Exceeded projections by 10.5 total points against strong opponents (1 games); underperformed by 12.3 points against weak competition (1 games).
#25: Delaware State (1-3)
Against #52 Georgetown, #291 Delaware State battled tough in a 78-83 loss. The model expected a margin of -19, but they performed 14 points better than projected. Facing #333 Navy, #291 Delaware State suffered a bad loss, 60-66. Favored by 3, they underperformed by 9 points.
Dial-Up Metrics: Exceeded projections by 13.7 total points against strong opponents (1 games); underperformed by 8.8 points against weak competition (1 games).
Analyzing the “Dial-Up” Team Profile: A Data-Driven Approach to Volatility in College Basketball
The provided rankings identify a distinct category of programs we term “Dial-Up” teams. These franchises possess a unique statistical profile that separates them from both consistent contenders and genuine underdogs. They are defined by high variance: they have the offensive ceiling to defeat any opponent across the country, yet they possess the defensive floor to lose to nearly anyone on their schedule.
Understanding the implications of this volatility is essential for constructing a balanced betting strategy. The following analysis breaks down how these teams perform in different contexts and offers actionable advice for wagering on them.
Strategic Approach: High Value as Underdogs
The most compelling opportunity presented by “Dial-Up” teams arises when they enter games as underdogs, particularly against Top 50 competition. In this context, the team’s potential often peaks rather than falters. The pressure of playing on a larger stage appears to activate their high-ceiling performance metrics.
From a data perspective, these squads frequently cover point spreads or successfully pull off moneyline upsets when matched against elite opponents. This suggests that their offensive output is most efficient and impactful in “good vs. good” scenarios. Bettors should recognize these teams as prime candidates for underdog value; they are dangerous opponents capable of disrupting the flow of higher-ranked competition, contrary to what standard power ratings might suggest.
Strategic Approach: High Risk as Favorites
Conversely, relying on “Dial-Up” teams as favorites presents significant statistical risk. The data indicates a tendency for these programs to let inferior opponents hang around when they enter as double-digit favorites against sub-200 ranked teams. This phenomenon points to a specific behavioral metric: the propensity to “phone it in” against weaker competition.
When these teams are heavily favored, their performance often drops to match-their-opponent levels rather than elevating them. The betting implication is clear: backing these teams as heavy favorites is a high-risk proposition. The likelihood of letting an inferior team cover the spread increases significantly when the margin of victory is not explicitly mandated by matchup dynamics.
Conclusion
In summary, “Dial-Up” teams are characterized by extreme volatility. They thrive in competitive environments where their full potential can be unleashed but struggle to maintain dominance against weaker opponents. A successful betting strategy involving these franchises requires respecting their ability to win big against the elite while exercising extreme caution when they serve as double-digit favorites.
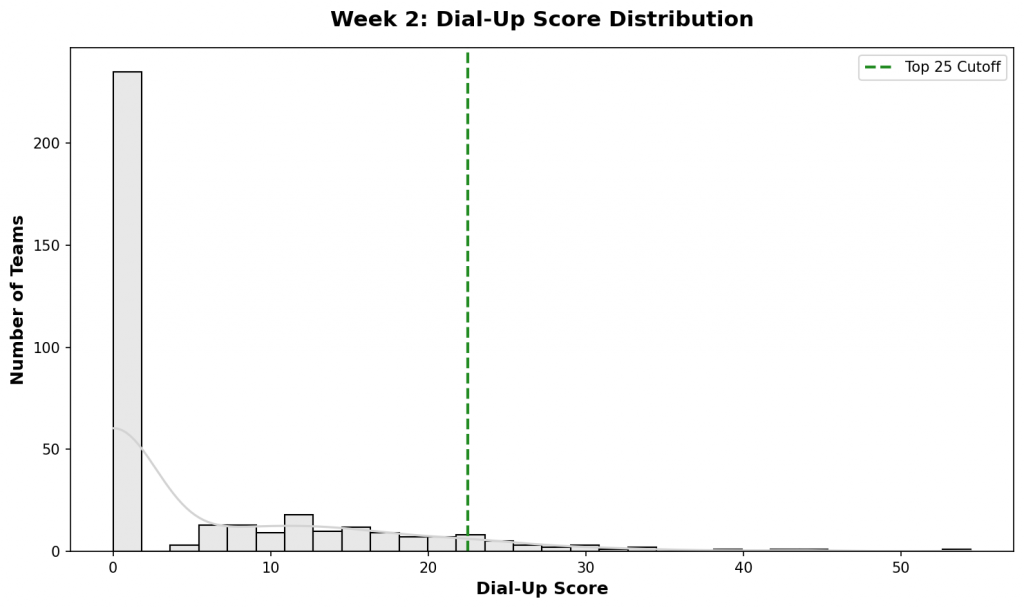
Figure 4: Distribution of Dial-Up scores across all Division I teams. The top 25 teams (highlighted in green) represent those with the most extreme performance splits based on opponent quality.
Check back next week for updated rankings.