Ohio Valley Update: Week 2
November 16, 2026Strongest Offensive Trends
- SIUE, Off Reb Pct, Up, Trend Strength: 0.023 – The improvement in SIUE’s offensive rebounding percentage suggests a growing ability to secure second-chance opportunities, contributing positively to the team’s overall performance trends early in the season.
- E Illinois, Shooting, Up, Trend Strength: 0.018 – The marked improvement in shooting efficiency for E Illinois serves as a key driver of their enhanced offensive output early in the season.
- E Illinois, Off Reb Pct, Up, Trend Strength: 0.017 – E Illinois is showing signs of improvement as their off rebounding percentage moves in a positive direction.
- SIUE, Shooting, Down, Trend Strength: -0.011 – The decline in shooting accuracy observed by SIUE early this season represents a troubling development that is hindering their offensive production.
- Morehead State, Turnovers, Down, Trend Strength: -0.009 – As Morehead State enters its second week, a significant improvement in ball security is strengthening their ability to sustain drives and fuel a more dominant offensive performance throughout the season.
Strongest Defensive Trends
- E Illinois, Opp Shooting, Up, Trend Strength: 0.037 – E Illinois is facing difficulties as its ability to suppress opponent shooting performance continues to decline throughout the early weeks of the season.
- SIUE, Opp Shooting, Up, Trend Strength: 0.024 – SIUE is struggling to contain opponents as their defensive efficiency declines with worsening shot-blocking metrics this season.
- Morehead State, Def Reb Pct, Down, Trend Strength: -0.021 – For Morehead State, a troubling pattern of giving up too many offensive boards to opponents early in the season is hampering their ability to effectively close out possessions and control the game flow.
- Morehead State, Opp Turnovers, Down, Trend Strength: -0.012 – Morehead State finds itself struggling against a concerning rise in opponent turnovers that undermines their chances of recording early defensive stops and sustaining momentum throughout the season.
- E Illinois, Opp Turnovers, Down, Trend Strength: -0.01 – East Illinois continues to struggle defensively as their ability to force opponent turnovers has noticeably declined throughout the season’s early weeks, leaving them vulnerable to easy points.
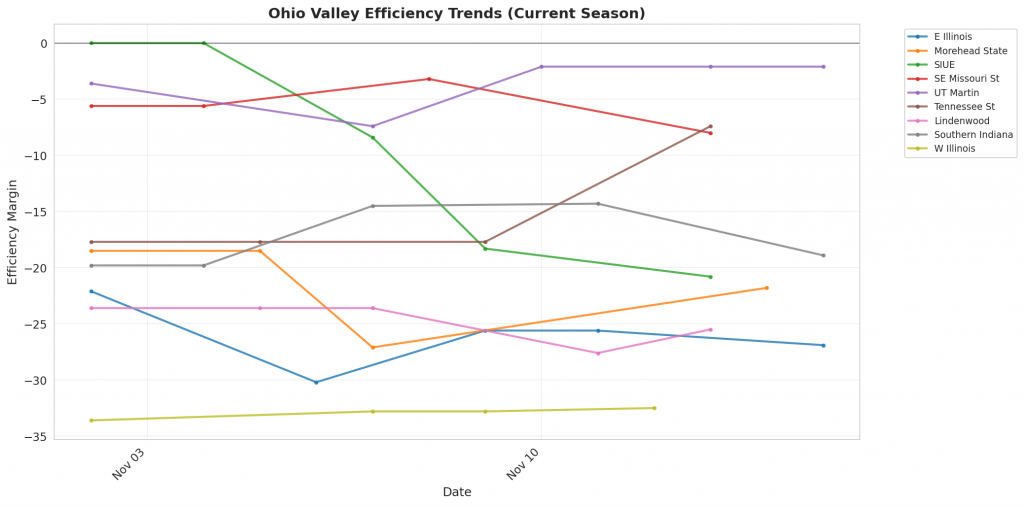
Figure 1: Efficiency margin trends for Ohio Valley teams throughout the season. Teams trending upward show improving performance, while downward trends indicate struggles.
Conference Snapshot
- Week Dates: November 09 – November 15, 2026
- Trending Up (Efficiency):E Illinois, UT Martin, W Illinois
- Trending Down (Efficiency):Morehead State, SIUE, SE Missouri St, Tennessee St, Lindenwood
Team-by-Team Analysis
E Illinois
Record: 1-4 | Elo: 1385.1 (ranked 339 of 365) | Efficiency Margin: -26.94 (ranked 349 of 365)
Offensive Trends:
- Shooting (Shooting): Currently ranked 200 of 365 in D1. Trending up strongly 🟢.
- Off Reb Pct (Offensive Rebounding): Currently ranked 343 of 365 in D1. Trending up strongly 🟢.
Defensive Trends:
- Opp Shooting (Opp Shooting): Currently ranked 365 of 365 in D1. Trending up strongly 🔴.
- Opp Turnovers (Opp Turnovers): Currently ranked 177 of 365 in D1. Trending down strongly 🔴.
Lindenwood
Record: 2-3 | Elo: 1439.9 (ranked 276 of 365) | Efficiency Margin: -25.46 (ranked 346 of 365)
Offensive Trends:
- Off Reb Pct (Offensive Rebounding): Currently ranked 138 of 365 in D1. Trending up strongly 🟢.
- Turnovers (Turnovers): Currently ranked 360 of 365 in D1. Trending up moderately 🔴.
Defensive Trends:
- Opp Shooting (Opp Shooting): Currently ranked 163 of 365 in D1. Trending down moderately 🟢.
- Opp Turnovers (Opp Turnovers): Currently ranked 214 of 365 in D1. Trending down moderately 🔴.
Morehead State
Record: 2-2 | Elo: 1507.1 (ranked 175 of 365) | Efficiency Margin: -21.82 (ranked 323 of 365)
Offensive Trends:
- Turnovers (Turnovers): Currently ranked 93 of 365 in D1. Trending down strongly 🟢.
- Shooting (Shooting): Currently ranked 301 of 365 in D1. Trending down weakly 🔴.
Defensive Trends:
- Opp Turnovers (Opp Turnovers): Currently ranked 363 of 365 in D1. Trending down strongly 🔴.
- Def Reb Pct (Defensive Rebounding): Currently ranked 346 of 365 in D1. Trending down strongly 🔴.
SE Missouri St
Record: 2-2 | Elo: 1507.3 (ranked 174 of 365) | Efficiency Margin: -8.05 (ranked 218 of 365)
Offensive Trends:
- Off Reb Pct (Offensive Rebounding): Currently ranked 277 of 365 in D1. Trending up moderately 🟢.
- Shooting (Shooting): Currently ranked 152 of 365 in D1. Trending down weakly 🔴.
Defensive Trends:
- Opp Turnovers (Opp Turnovers): Currently ranked 200 of 365 in D1. Trending down strongly 🔴.
- Opp Shooting (Opp Shooting): Currently ranked 287 of 365 in D1. Trending up moderately 🔴.
SIUE
Record: 2-3 | Elo: 1483.8 (ranked 218 of 365) | Efficiency Margin: -20.83 (ranked 317 of 365)
Offensive Trends:
- Shooting (Shooting): Currently ranked 319 of 365 in D1. Trending down strongly 🔴.
- Off Reb Pct (Offensive Rebounding): Currently ranked 246 of 365 in D1. Trending up strongly 🟢.
Defensive Trends:
- Opp Shooting (Opp Shooting): Currently ranked 324 of 365 in D1. Trending up strongly 🔴.
- Opp Turnovers (Opp Turnovers): Currently ranked 300 of 365 in D1. Trending down moderately 🔴.
Southern Indiana
Record: 1-4 | Elo: 1317.9 (ranked 368 of 365) | Efficiency Margin: -18.88 (ranked 306 of 365)
Offensive Trends:
- Turnovers (Turnovers): Currently ranked 219 of 365 in D1. Trending down moderately 🟢.
- Off Reb Pct (Offensive Rebounding): Currently ranked 173 of 365 in D1. Trending up moderately 🟢.
Defensive Trends:
- Opp Shooting (Opp Shooting): Currently ranked 241 of 365 in D1. Trending up strongly 🔴.
- Def Reb Pct (Defensive Rebounding): Currently ranked 117 of 365 in D1. Trending up moderately 🟢.
Tennessee St
Record: 2-2 | Elo: 1533.4 (ranked 130 of 365) | Efficiency Margin: -7.42 (ranked 210 of 365)
Offensive Trends:
- Off Reb Pct (Offensive Rebounding): Currently ranked 67 of 365 in D1. Trending up strongly 🟢.
- Shooting (Shooting): Currently ranked 362 of 365 in D1. Trending down weakly 🔴.
Defensive Trends:
- Def Reb Pct (Defensive Rebounding): Currently ranked 242 of 365 in D1. Trending down moderately 🔴.
- Opp Shooting (Opp Shooting): Currently ranked 280 of 365 in D1. Trending up weakly 🔴.
UT Martin
Record: 3-2 | Elo: 1490.1 (ranked 205 of 365) | Efficiency Margin: -2.06 (ranked 163 of 365)
Offensive Trends:
- Shooting (Shooting): Currently ranked 63 of 365 in D1. Trending up strongly 🟢.
- Off Reb Pct (Offensive Rebounding): Currently ranked 51 of 365 in D1. Trending up strongly 🟢.
Defensive Trends:
- Opp Turnovers (Opp Turnovers): Currently ranked 340 of 365 in D1. Trending down strongly 🔴.
- Def Reb Pct (Defensive Rebounding): Currently ranked 191 of 365 in D1. Trending down moderately 🔴.
W Illinois
Record: 1-3 | Elo: 1302.5 (ranked 369 of 365) | Efficiency Margin: -32.52 (ranked 360 of 365)
Offensive Trends:
- Off Reb Pct (Offensive Rebounding): Currently ranked 313 of 365 in D1. Trending up strongly 🟢.
- Shooting (Shooting): Currently ranked 227 of 365 in D1. Trending up moderately 🟢.
Defensive Trends:
- Opp Shooting (Opp Shooting): Currently ranked 305 of 365 in D1. Trending up moderately 🔴.
- Opp Turnovers (Opp Turnovers): Currently ranked 276 of 365 in D1. Trending down weakly 🔴.
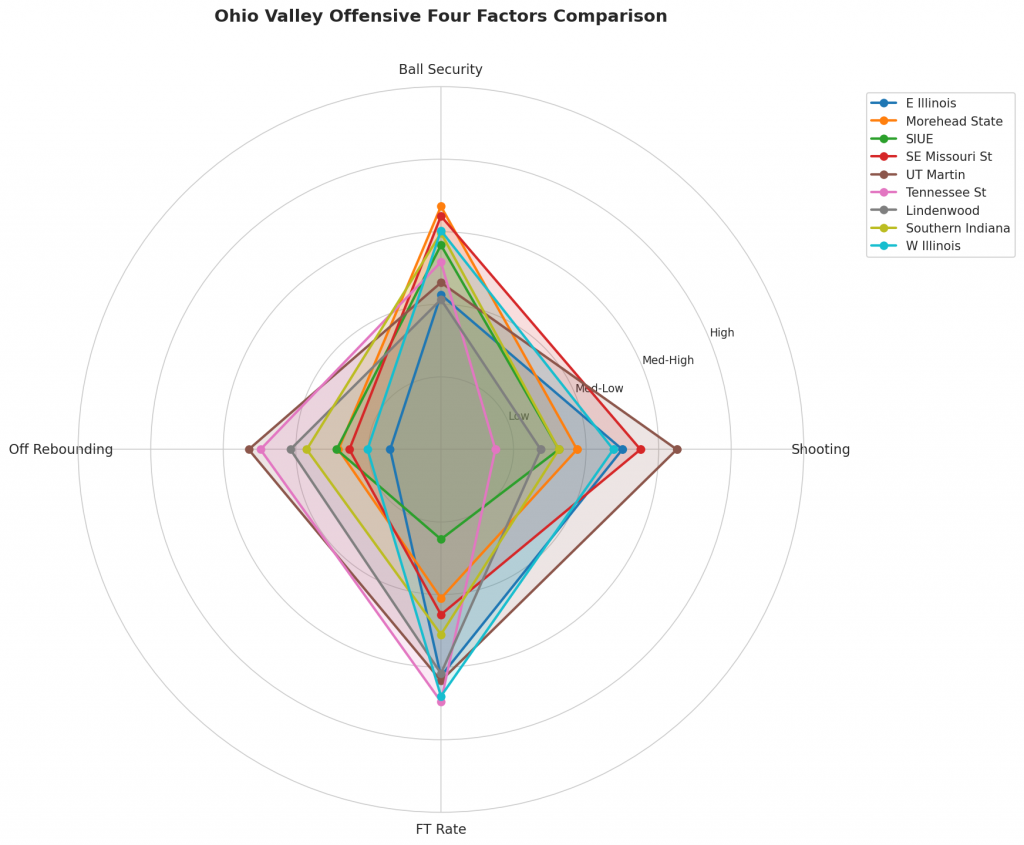
Figure 2: Offensive Four Factors comparison across Ohio Valley teams. The radar chart shows each team’s shooting efficiency (eFG%), ball security (TOV%), offensive rebounding (OREB%), and free throw generation (FT Rate).
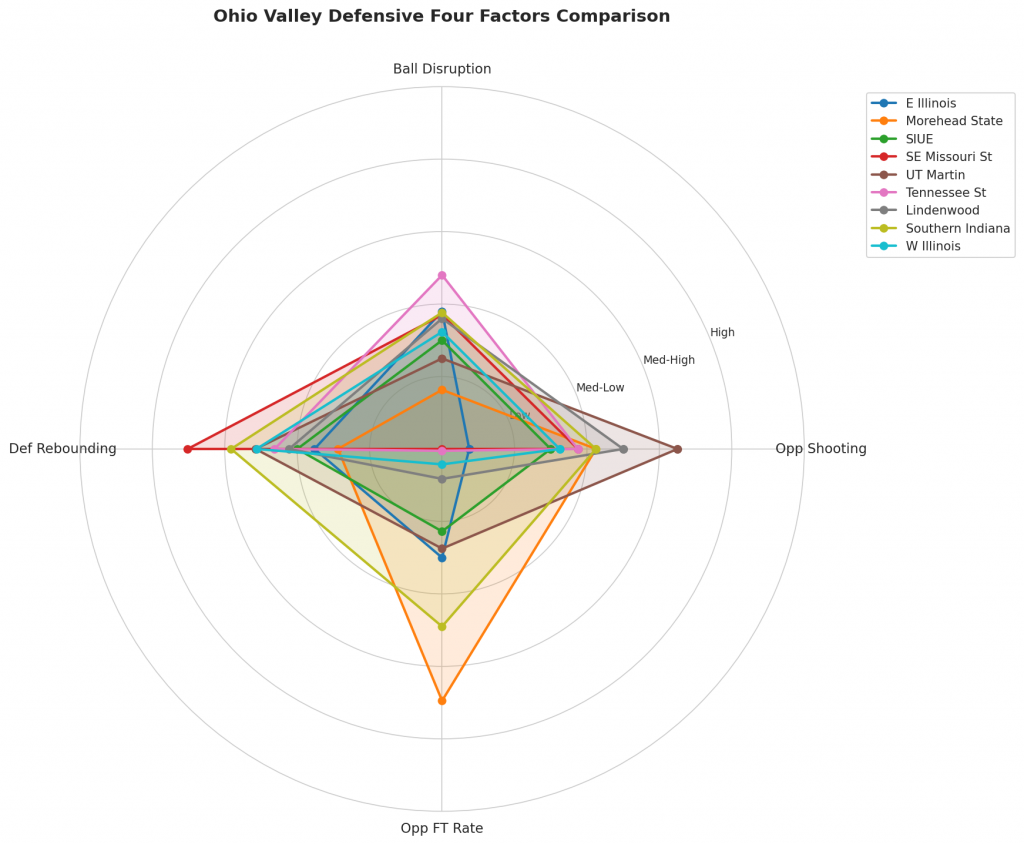
Figure 3: Defensive Four Factors comparison across Ohio Valley teams. The radar chart shows each team’s opponent shooting defense (Opp eFG%), ball disruption (forcing TOV%), defensive rebounding (DREB%), and opponent free throw prevention (Opp FT Rate).
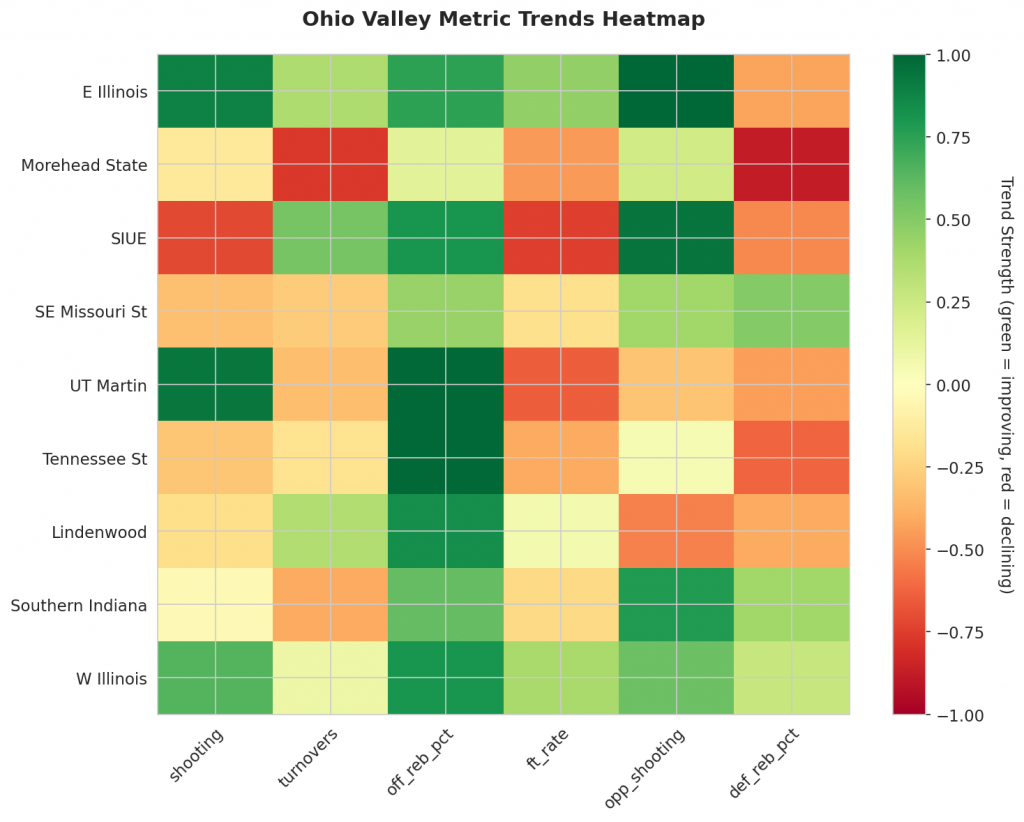
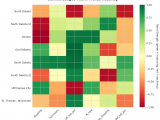
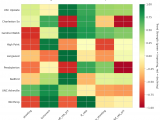
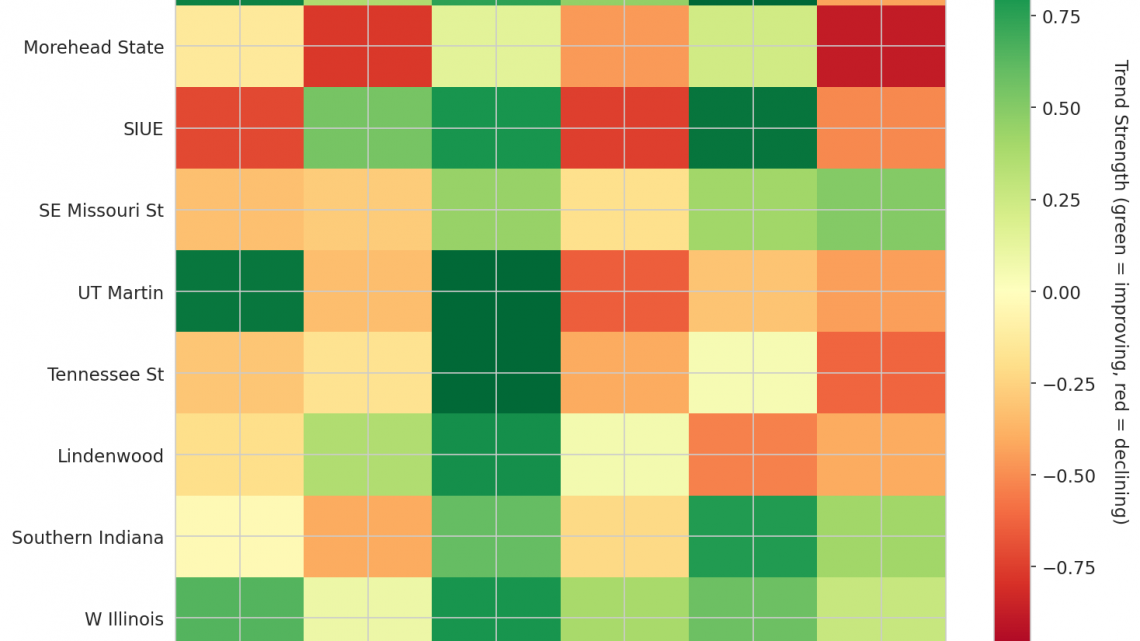
Figure 4: MACD trends heatmap showing which metrics are improving (green) or declining (red) for each team. Stronger colors indicate more pronounced trends.
Looking Ahead
Week 2 provides sufficient sample sizes to evaluate early-season trajectories using MACD trending indicators, distinguishing between teams genuinely refining their play and those merely riding unsustainable momentum. E Illinois presents a complex picture where offensive efficiency is improving while defensive stability erodes; the team’s shooting percentage sits at a season average of 0.5 with a trend strongly upward, indicating a genuine enhancement in shot-making ability that adds value to their offense, and their offensively-rebounded possession percentage of 0.206 is also trending strongly upward, suggesting they are consistently securing extra possessions through aggressive boxing out and transition play. Conversely, defensive consistency remains a significant concern for the squad, as opponent shooting percentages against them have surged to a season average of 0.67 with the trend moving strongly upward, indicating that opponents are finding it easier to score, while forcing turnovers—a season average of 0.164—is trending strongly downward, defining this direction as worsening since they are struggling to disrupt opponent ball handling and protect the tempo effectively. For Morehead State, the indicators reveal a unit that is cleaning up mistakes on offense but losing ground defensively; ball security has improved with turnover rates sitting at a season average of 0.149, where the trend is strongly downward, allowing them to maintain rhythm without unduly surrendering extra opportunities, yet the defensive unit faces regression as they are allowing more offensive rebounds from opponents evidenced by a declining defensive rebound percentage of 0.615 trending strongly downward, granting opponents additional shot attempts, and the rate at which they force opponent turnovers has dropped to a season average of 0.099, also trending strongly downward to mark a significant decline in their ability to disrupt offensive sets. The analysis for SIUE highlights a single but critical area of performance degradation where shooting efficiency has taken a hit with the team’s shooting percentage fallen to a season average of 0.43 and the trend moving strongly downward, indicating that the offense is struggling to generate high-percentage looks leading to a decrease in scoring value and overall offensive production. As the season progresses, these MACD trends will be crucial for identifying which rosters can sustain current performance levels, noting that E Illinois appears to be an offensive threat that must address defensive vulnerabilities, Morehead State needs to secure defensive rebounds to complement improved ball control, and SIUE faces the immediate task of correcting a downward shooting trend.
Metrics Glossary
Four Factors (Dean Oliver’s framework for basketball success):
- eFG% (Effective Field Goal %): Field goal percentage adjusted for 3-pointers being worth more (FGM + 0.5×3PM) / FGA. Higher is better offensively, lower is better defensively.
- TOV% (Turnover Rate): Turnovers per 100 possessions. Lower is better offensively (taking care of the ball), higher is better defensively (forcing turnovers).
- OREB% / DREB% (Offensive/Defensive Rebound Rate): Percentage of available rebounds grabbed. Offensive rebounds create second-chance points; defensive rebounds end opponent possessions.
- FTR (Free Throw Rate): Free throws made per field goal attempt (FTM/FGA). Measures ability to get to the line AND convert. Higher is better offensively, lower is better defensively.
Other Metrics:
- Elo Rating: Chess-style rating system that updates based on game results and opponent strength. Higher Elo indicates stronger team.
- Efficiency Margin: Point differential per 100 possessions (Offensive Efficiency – Defensive Efficiency). Accounts for pace of play.
- MACD (Moving Average Convergence Divergence): Trend indicator comparing 12-game and 26-game exponential moving averages. Positive MACD = improving trend, Negative MACD = declining trend.
Analysis powered by HoopSci’s advanced metrics and MACD trending indicators.