WAC Update: Week 2
November 16, 2026Strongest Offensive Trends
- Tarleton, Off Reb Pct, Up, Trend Strength: 0.058 – Tarleton has demonstrated significant growth in its offensive rebounding efforts, creating vital second-chance opportunities and enhancing command of the glass through this proactive play.
- UT Arlington, Off Reb Pct, Up, Trend Strength: 0.025 – The steady enhancement of UT Arlington’s rebounding percentage suggests an improvement in securing possession, which directly contributes to better scoring opportunities for the team.
- Austin Peay, Shooting, Down, Trend Strength: -0.02 – Austin Peay faces an emerging concern as their shooting performance is on a downward trajectory that threatens to hinder their overall offensive output this season.
- Austin Peay, Off Reb Pct, Up, Trend Strength: 0.019 – Austin Peay is showing signs of improved effectiveness on the glass as the percentage of rebounds grabbed by its own players continues to climb, a development that directly contributes to better possession opportunities and overall offensive rhythm throughout the season.
- Abil Christian, Turnovers, Down, Trend Strength: -0.007 – The improved ball security exhibited by Abil Christian is driving a more dynamic and efficient offense for their team.
Strongest Defensive Trends
- Tarleton, Opp Turnovers, Down, Trend Strength: -0.02 – As Tarleton has navigated its early season schedule, a troubling pattern has emerged where the failure to generate turnovers hampers their ability to disrupt opposing offenses at pivotal moments.
- Little Rock, Opp Turnovers, Down, Trend Strength: -0.016 – Little Rock is struggling defensively as its ability to force turnovers from opponents has declined throughout the season.
- Abil Christian, Opp Turnovers, Down, Trend Strength: -0.015 – Abil Christian’s Opp Turnovers is trending down, a worsening trend (forcing fewer turnovers).
- Tarleton, Opp Shooting, Down, Trend Strength: -0.014 – As Tarleton’s opponents encounter increasingly difficult contests for their shots throughout the match, the team demonstrates a marked and improving defensive efficiency this season.
- E Kentucky, Opp Turnovers, Down, Trend Strength: -0.008 – As the week two campaign unfolds for E Kentucky, a troubling trajectory has emerged where the team is failing to generate steals from opponents, signaling a weakening defensive pressure that allows adversaries to retain possession with greater frequency than desired.
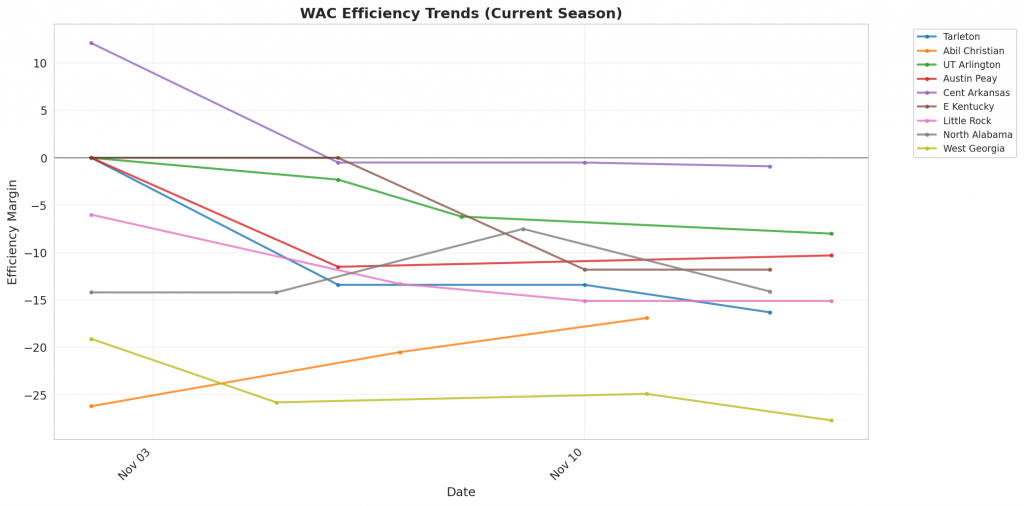
Figure 1: Efficiency margin trends for WAC teams throughout the season. Teams trending upward show improving performance, while downward trends indicate struggles.
Conference Snapshot
- Week Dates: November 09 – November 15, 2026
- Trending Up (Efficiency):Tarleton, Abil Christian, Cent Arkansas, E Kentucky
- Trending Down (Efficiency):UT Arlington, Austin Peay, Little Rock, North Alabama, West Georgia
Team-by-Team Analysis
Abil Christian
Record: 1-2 | Elo: 1445.9 (ranked 268 of 365) | Efficiency Margin: -16.90 (ranked 292 of 365)
Offensive Trends:
- Turnovers (Turnovers): Currently ranked 214 of 365 in D1. Trending down strongly 🟢.
- Off Reb Pct (Offensive Rebounding): Currently ranked 192 of 365 in D1. Trending down moderately 🔴.
Defensive Trends:
- Opp Turnovers (Opp Turnovers): Currently ranked 132 of 365 in D1. Trending down strongly 🔴.
- Opp Shooting (Opp Shooting): Currently ranked 344 of 365 in D1. Trending up moderately 🔴.
Austin Peay
Record: 1-2 | Elo: 1517.8 (ranked 158 of 365) | Efficiency Margin: -10.26 (ranked 242 of 365)
Offensive Trends:
- Shooting (Shooting): Currently ranked 358 of 365 in D1. Trending down strongly 🔴.
- Off Reb Pct (Offensive Rebounding): Currently ranked 346 of 365 in D1. Trending up strongly 🟢.
Defensive Trends:
- Opp Shooting (Opp Shooting): Currently ranked 220 of 365 in D1. Trending up moderately 🔴.
- Opp Turnovers (Opp Turnovers): Currently ranked 41 of 365 in D1. Trending down weakly 🔴.
Cent Arkansas
Record: 2-2 | Elo: 1498.0 (ranked 194 of 365) | Efficiency Margin: -0.92 (ranked 156 of 365)
Offensive Trends:
- Off Reb Pct (Offensive Rebounding): Currently ranked 355 of 365 in D1. Trending up strongly 🟢.
- Shooting (Shooting): Currently ranked 168 of 365 in D1. Trending up moderately 🟢.
Defensive Trends:
- Opp Shooting (Opp Shooting): Currently ranked 189 of 365 in D1. Trending down moderately 🟢.
- Def Reb Pct (Defensive Rebounding): Currently ranked 100 of 365 in D1. Trending down moderately 🔴.
E Kentucky
Record: 3-1 | Elo: 1428.5 (ranked 288 of 365) | Efficiency Margin: -11.84 (ranked 256 of 365)
Offensive Trends:
- Shooting (Shooting): Currently ranked 167 of 365 in D1. Trending up strongly 🟢.
- Turnovers (Turnovers): Currently ranked 162 of 365 in D1. Trending up strongly 🔴.
Defensive Trends:
- Opp Turnovers (Opp Turnovers): Currently ranked 321 of 365 in D1. Trending down strongly 🔴.
- Opp Shooting (Opp Shooting): Currently ranked 230 of 365 in D1. Trending up moderately 🔴.
Little Rock
Record: 1-3 | Elo: 1420.7 (ranked 299 of 365) | Efficiency Margin: -15.10 (ranked 283 of 365)
Offensive Trends:
- Shooting (Shooting): Currently ranked 208 of 365 in D1. Trending down weakly 🔴.
- Turnovers (Turnovers): Currently ranked 274 of 365 in D1. Trending down weakly 🟢.
Defensive Trends:
- Opp Turnovers (Opp Turnovers): Currently ranked 229 of 365 in D1. Trending down strongly 🔴.
- Opp Shooting (Opp Shooting): Currently ranked 316 of 365 in D1. Trending up weakly 🔴.
North Alabama
Record: 2-2 | Elo: 1435.6 (ranked 286 of 365) | Efficiency Margin: -14.12 (ranked 273 of 365)
Offensive Trends:
- Turnovers (Turnovers): Currently ranked 342 of 365 in D1. Trending up strongly 🔴.
- Shooting (Shooting): Currently ranked 148 of 365 in D1. Trending down weakly 🔴.
Defensive Trends:
- Opp Shooting (Opp Shooting): Currently ranked 283 of 365 in D1. Trending up moderately 🔴.
- Def Reb Pct (Defensive Rebounding): Currently ranked 125 of 365 in D1. Trending up moderately 🟢.
Tarleton
Record: 3-1 | Elo: 1438.1 (ranked 283 of 365) | Efficiency Margin: -16.26 (ranked 291 of 365)
Offensive Trends:
- Off Reb Pct (Offensive Rebounding): Currently ranked 169 of 365 in D1. Trending up strongly 🟢.
- Shooting (Shooting): Currently ranked 90 of 365 in D1. Trending up moderately 🟢.
Defensive Trends:
- Opp Shooting (Opp Shooting): Currently ranked 81 of 365 in D1. Trending down strongly 🟢.
- Opp Turnovers (Opp Turnovers): Currently ranked 120 of 365 in D1. Trending down strongly 🔴.
UT Arlington
Record: 3-1 | Elo: 1512.6 (ranked 167 of 365) | Efficiency Margin: -8.03 (ranked 217 of 365)
Offensive Trends:
- Off Reb Pct (Offensive Rebounding): Currently ranked 84 of 365 in D1. Trending up strongly 🟢.
- Shooting (Shooting): Currently ranked 148 of 365 in D1. Trending down weakly 🔴.
Defensive Trends:
- Opp Shooting (Opp Shooting): Currently ranked 95 of 365 in D1. Trending down moderately 🟢.
- Def Reb Pct (Defensive Rebounding): Currently ranked 253 of 365 in D1. Trending down moderately 🔴.
West Georgia
Record: 0-4 | Elo: 1398.4 (ranked 322 of 365) | Efficiency Margin: -27.66 (ranked 351 of 365)
Offensive Trends:
- Shooting (Shooting): Currently ranked 352 of 365 in D1. Trending down strongly 🔴.
- Turnovers (Turnovers): Currently ranked 270 of 365 in D1. Trending up moderately 🔴.
Defensive Trends:
- Def Reb Pct (Defensive Rebounding): Currently ranked 36 of 365 in D1. Trending up strongly 🟢.
- Opp Shooting (Opp Shooting): Currently ranked 232 of 365 in D1. Trending down moderately 🟢.
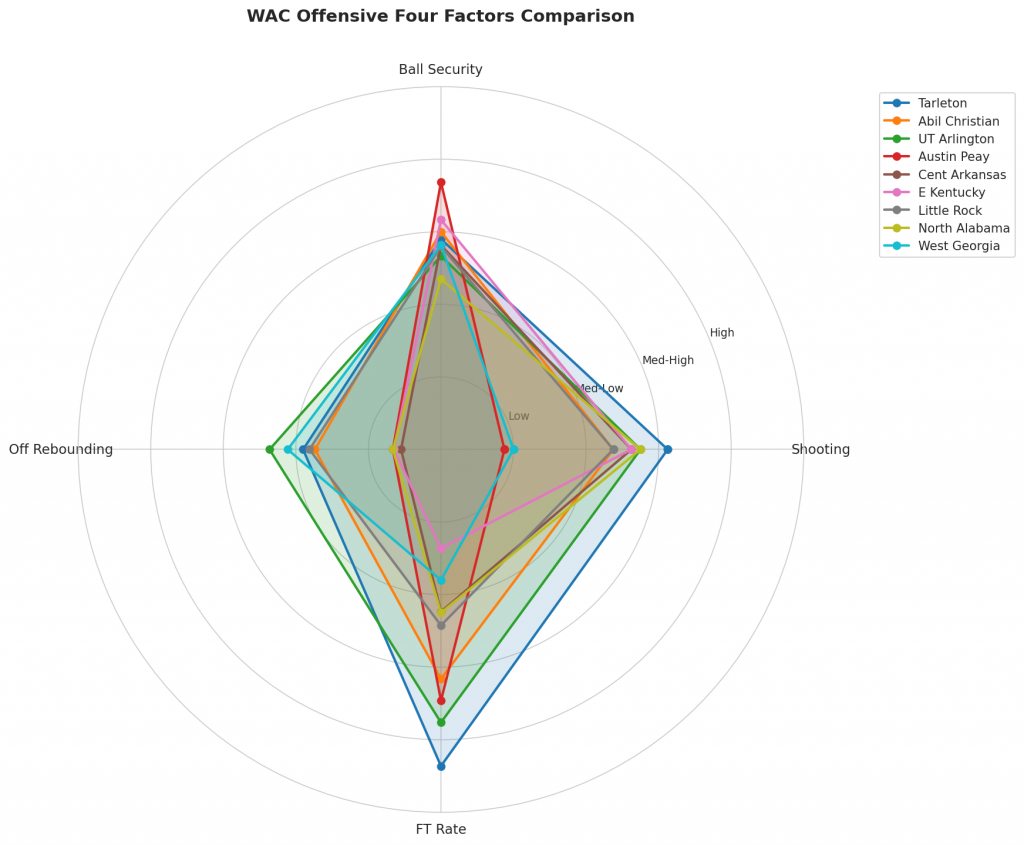
Figure 2: Offensive Four Factors comparison across WAC teams. The radar chart shows each team’s shooting efficiency (eFG%), ball security (TOV%), offensive rebounding (OREB%), and free throw generation (FT Rate).
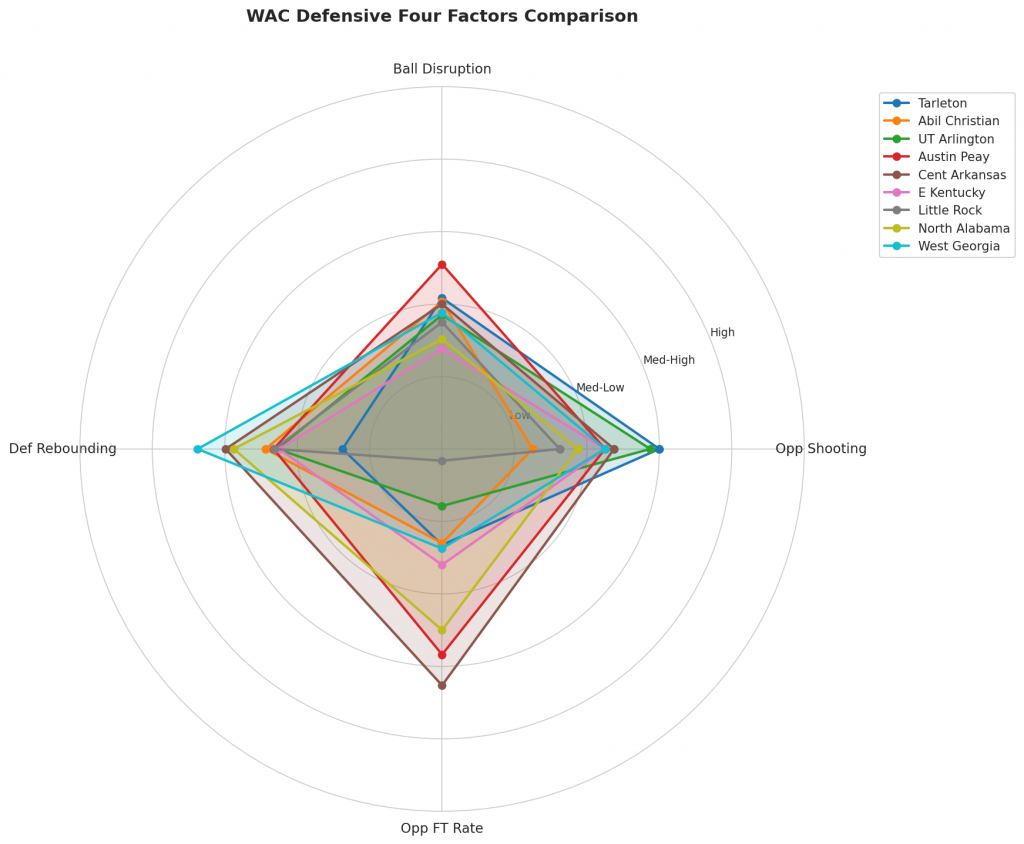
Figure 3: Defensive Four Factors comparison across WAC teams. The radar chart shows each team’s opponent shooting defense (Opp eFG%), ball disruption (forcing TOV%), defensive rebounding (DREB%), and opponent free throw prevention (Opp FT Rate).
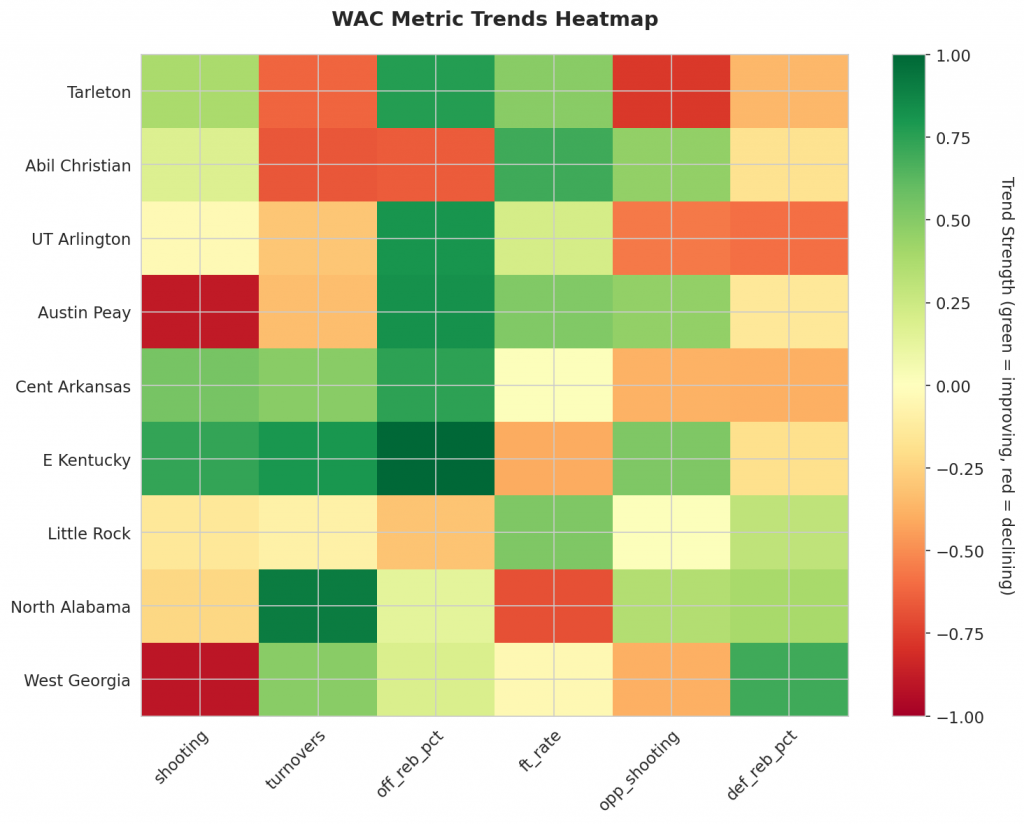
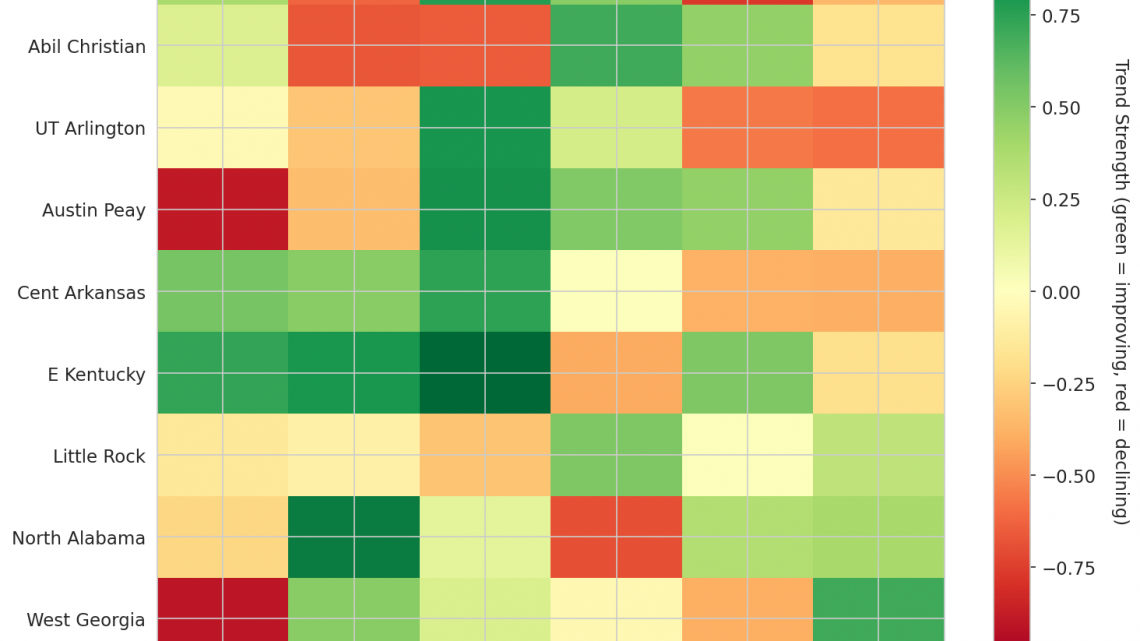
Figure 4: MACD trends heatmap showing which metrics are improving (green) or declining (red) for each team. Stronger colors indicate more pronounced trends.
Looking Ahead
MACD momentum indicators show distinct shifts across the teams’ recent games, separating genuine progress from early-season volatility. Tarleton leads the offensive discussion with an Off Reb Pct of 0.302 that is moving strongly upward, reflecting a marked improvement in securing second-chance opportunities. UT Arlington mirrors this positive movement with an Off Reb Pct near 0.339 trending strongly up, indicating heightened effectiveness on the glass. In contrast, Austin Peay faces significant struggle as their shooting percentage sits at 0.37 and trends strongly down, signaling a decline in offensive efficiency.
Defensive metrics reveal mixed results where lower values generally indicate success, yet Tarleton shows a notable problem in turnover generation. Their Opp Turnovers metric stands at 0.175 while trending strongly down; since defensive play relies on forcing opponent giveaways, this movement represents a worsening of that specific skill. Abil Christian faces an identical challenge with Opp Turnovers averaging 0.172 and declining sharply, pointing to a drop in their ability to disrupt opponents’ possessions. E Kentucky shares this regression, posting an Opp Turnovers average of 0.133 that is trending strongly down, marking a reduction in forced turnovers despite the team starting from a lower baseline. Additionally, Tarleton demonstrates strong defensive improvement on the other end, as their opponent shooting percentage of 0.46 trends strongly downward, effectively limiting scoring chances against them.
Metrics Glossary
Four Factors (Dean Oliver’s framework for basketball success):
- eFG% (Effective Field Goal %): Field goal percentage adjusted for 3-pointers being worth more (FGM + 0.5×3PM) / FGA. Higher is better offensively, lower is better defensively.
- TOV% (Turnover Rate): Turnovers per 100 possessions. Lower is better offensively (taking care of the ball), higher is better defensively (forcing turnovers).
- OREB% / DREB% (Offensive/Defensive Rebound Rate): Percentage of available rebounds grabbed. Offensive rebounds create second-chance points; defensive rebounds end opponent possessions.
- FTR (Free Throw Rate): Free throws made per field goal attempt (FTM/FGA). Measures ability to get to the line AND convert. Higher is better offensively, lower is better defensively.
Other Metrics:
- Elo Rating: Chess-style rating system that updates based on game results and opponent strength. Higher Elo indicates stronger team.
- Efficiency Margin: Point differential per 100 possessions (Offensive Efficiency – Defensive Efficiency). Accounts for pace of play.
- MACD (Moving Average Convergence Divergence): Trend indicator comparing 12-game and 26-game exponential moving averages. Positive MACD = improving trend, Negative MACD = declining trend.
Analysis powered by HoopSci’s advanced metrics and MACD trending indicators.