Ohio Valley Update: Week 9
January 5, 2026The Ohio Valley enters Week 9 with teams showing diverse trending patterns. This analysis examines each team’s performance trends using MACD (Moving Average Convergence Divergence) indicators to identify not just where teams stand, but where they’re headed.
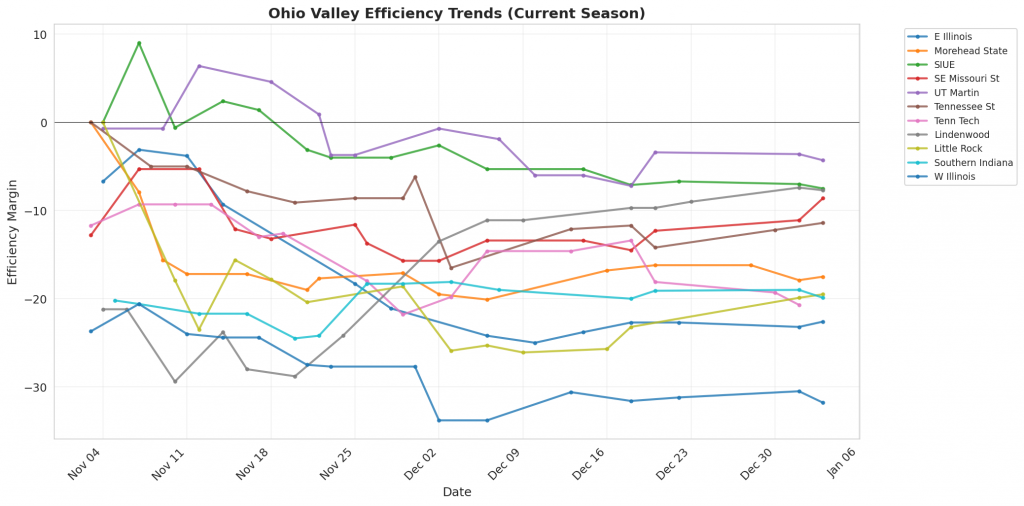
Figure 1: Efficiency margin trends for Ohio Valley teams throughout the season. Teams trending upward show improving performance, while downward trends indicate struggles.
Conference Snapshot
- Week Dates: December 29 – January 04, 2026
- Trending Up (Efficiency): E Illinois, Morehead State, SE Missouri St, Lindenwood, Little Rock
- Trending Down (Efficiency): SIUE, UT Martin, Tennessee St, Tenn Tech, Southern Indiana
Team-by-Team Analysis
E Illinois
Record: 3-10 | Elo: 1368.3 (ranked 336 of 365) | Efficiency Margin: -22.59 (ranked 336 of 365)
Offensive Trends:
- Off Reb Pct (Offensive Rebounding): Currently ranked 336 of 365 in D1. Trending up strongly 🟢.
- 2Pt Rate (2 Point Attempts/FGA (%)): Currently ranked 45 of 365 in D1. Trending down strongly 🔴.
Defensive Trends:
- Opp 2PM Per Poss (Opp 2 Point Makes Per Possession (%)): Currently ranked 299 of 365 in D1. Trending up strongly 🔴.
- Opp 2Pt Pct (Opp 2 Point FGM/FGA (%)): Currently ranked 342 of 365 in D1. Trending up strongly 🔴.
Lindenwood
Record: 10-5 | Elo: 1449.0 (ranked 253 of 365) | Efficiency Margin: -7.70 (ranked 227 of 365)
Offensive Trends:
- Shooting (Shooting): Currently ranked 289 of 365 in D1. Trending up strongly 🟢.
- Turnovers (Turnovers): Currently ranked 195 of 365 in D1. Trending down strongly 🟢.
Defensive Trends:
- Opp 2PM Per Poss (Opp 2 Point Makes Per Possession (%)): Currently ranked 221 of 365 in D1. Trending up strongly 🔴.
- Opp 2PA Per Poss (Opp 2 Point Attempts Per Possession (%)): Currently ranked 252 of 365 in D1. Trending up strongly 🔴.
Little Rock
Record: 4-10 | Elo: 1440.6 (ranked 263 of 365) | Efficiency Margin: -19.51 (ranked 321 of 365)
Offensive Trends:
- FT Rate (FTA/FGA (%)): Currently ranked 299 of 365 in D1. Trending up strongly 🟢.
- FGA Per Poss (Field Goal Attempts Per Possession (%)): Currently ranked 304 of 365 in D1. Trending down strongly 🔴.
Defensive Trends:
- Def Reb Pct (Defensive Rebounding): Currently ranked 336 of 365 in D1. Trending down strongly 🔴.
- Opp FGA Per Poss (Opp FG Attempts Per Possession (%)): Currently ranked 236 of 365 in D1. Trending up strongly 🔴.
Morehead State
Record: 7-8 | Elo: 1460.8 (ranked 239 of 365) | Efficiency Margin: -17.55 (ranked 306 of 365)
Offensive Trends:
- Shooting (Shooting): Currently ranked 309 of 365 in D1. Trending up strongly 🟢.
- Off Reb Pct (Offensive Rebounding): Currently ranked 95 of 365 in D1. Trending up strongly 🟢.
Defensive Trends:
- Opp 2Pt Rate (Opp 2 Point Attempts/FGA (%)): Currently ranked 95 of 365 in D1. Trending down strongly 🟢.
- Opp 2PM Per Poss (Opp 2 Point Makes Per Possession (%)): Currently ranked 178 of 365 in D1. Trending down strongly 🟢.
SE Missouri St
Record: 8-7 | Elo: 1482.0 (ranked 218 of 365) | Efficiency Margin: -8.57 (ranked 234 of 365)
Offensive Trends:
- Turnovers (Turnovers): Currently ranked 235 of 365 in D1. Trending up strongly 🔴.
- Off Reb Pct (Offensive Rebounding): Currently ranked 177 of 365 in D1. Trending up strongly 🟢.
Defensive Trends:
- Opp Shooting (Opp Shooting): Currently ranked 260 of 365 in D1. Trending down strongly 🟢.
- Def Reb Pct (Defensive Rebounding): Currently ranked 39 of 365 in D1. Trending up strongly 🟢.
SIUE
Record: 9-6 | Elo: 1497.5 (ranked 196 of 365) | Efficiency Margin: -7.52 (ranked 225 of 365)
Offensive Trends:
- 2PM Per Poss (2 Point Makes Per Possession (%)): Currently ranked 132 of 365 in D1. Trending down strongly 🔴.
- 2Pt Pct (2 Point FGM/FGA (%)): Currently ranked 282 of 365 in D1. Trending down strongly 🔴.
Defensive Trends:
- Opp Shooting (Opp Shooting): Currently ranked 84 of 365 in D1. Trending up strongly 🔴.
- Opp Turnovers (Opp Turnovers): Currently ranked 153 of 365 in D1. Trending up strongly 🔴.
Southern Indiana
Record: 3-11 | Elo: 1311.3 (ranked 362 of 365) | Efficiency Margin: -19.89 (ranked 322 of 365)
Offensive Trends:
- 2Pt Rate (2 Point Attempts/FGA (%)): Currently ranked 262 of 365 in D1. Trending down strongly 🔴.
- 3Pt Rate (3 Point Attempts/FGA (%)): Currently ranked 104 of 365 in D1. Trending up strongly 🟢.
Defensive Trends:
- Opp 2Pt Rate (Opp 2 Point Attempts/FGA (%)): Currently ranked 364 of 365 in D1. Trending up strongly 🔴.
- Opp 2PM Per Poss (Opp 2 Point Makes Per Possession (%)): Currently ranked 334 of 365 in D1. Trending up strongly 🔴.
Tenn Tech
Record: 6-9 | Elo: 1390.1 (ranked 312 of 365) | Efficiency Margin: -20.66 (ranked 324 of 365)
Offensive Trends:
- Turnovers (Turnovers): Currently ranked 332 of 365 in D1. Trending up strongly 🔴.
- Off Reb Pct (Offensive Rebounding): Currently ranked 285 of 365 in D1. Trending up strongly 🟢.
Defensive Trends:
- Opp Shooting (Opp Shooting): Currently ranked 281 of 365 in D1. Trending up strongly 🔴.
- Opp FG Pct (%) (Opp FGM/FGA (%)): Currently ranked 255 of 365 in D1. Trending up strongly 🔴.
Tennessee St
Record: 9-5 | Elo: 1507.8 (ranked 177 of 365) | Efficiency Margin: -11.40 (ranked 255 of 365)
Offensive Trends:
- Turnovers (Turnovers): Currently ranked 230 of 365 in D1. Trending down strongly 🟢.
- Off Reb Pct (Offensive Rebounding): Currently ranked 174 of 365 in D1. Trending down strongly 🔴.
Defensive Trends:
- Opp Shooting (Opp Shooting): Currently ranked 268 of 365 in D1. Trending up strongly 🔴.
- Opp Turnovers (Opp Turnovers): Currently ranked 17 of 365 in D1. Trending up strongly 🔴.
UT Martin
Record: 11-4 | Elo: 1483.3 (ranked 212 of 365) | Efficiency Margin: -4.26 (ranked 194 of 365)
Offensive Trends:
- Adj Off Eff (Adjusted Offensive Efficiency): Currently ranked 232 of 365 in D1. Trending up strongly 🟢.
- FTM Per Poss (Free Throw Makes Per Possession (%)): Currently ranked 97 of 365 in D1. Trending up strongly 🟢.
Defensive Trends:
- Opp Shooting (Opp Shooting): Currently ranked 73 of 365 in D1. Trending down strongly 🟢.
- Opp 2Pt Rate (Opp 2 Point Attempts/FGA (%)): Currently ranked 190 of 365 in D1. Trending up strongly 🔴.
W Illinois
Record: 4-11 | Elo: 1363.1 (ranked 344 of 365) | Efficiency Margin: -31.76 (ranked 358 of 365)
Offensive Trends:
- Shooting (Shooting): Currently ranked 352 of 365 in D1. Trending down strongly 🔴.
- FT Rate (FTA/FGA (%)): Currently ranked 140 of 365 in D1. Trending up strongly 🟢.
Defensive Trends:
- Opp Turnovers (Opp Turnovers): Currently ranked 283 of 365 in D1. Trending up strongly 🔴.
- Opp FT Rate (Opp FTA/FGA (%)): Currently ranked 269 of 365 in D1. Trending up strongly 🔴.
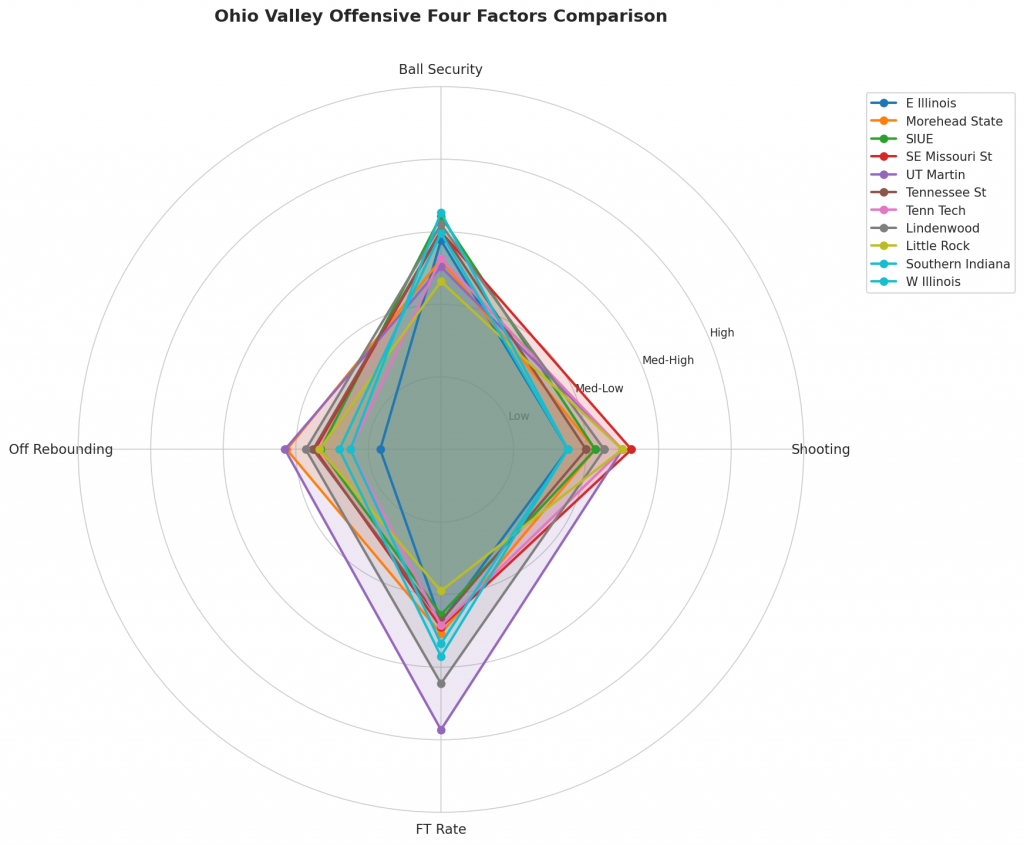
Figure 2: Offensive Four Factors comparison across Ohio Valley teams. The radar chart shows each team’s shooting efficiency (eFG%), ball security (TOV%), offensive rebounding (OREB%), and free throw generation (FT Rate).
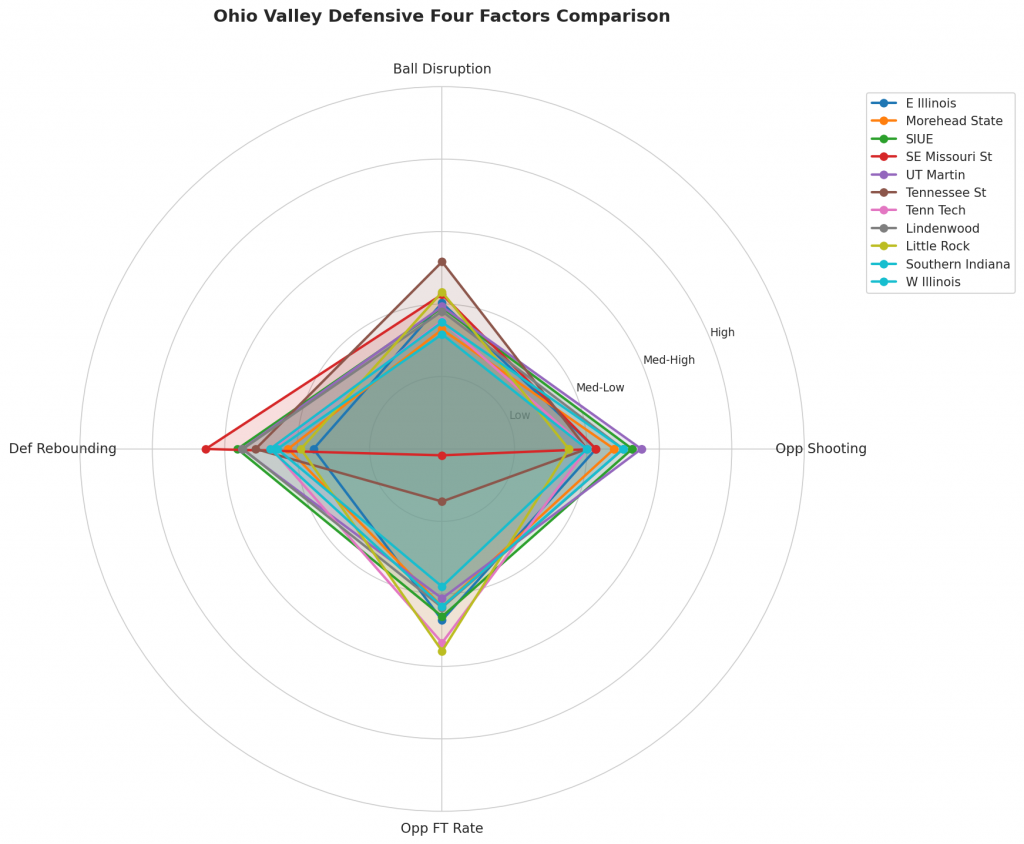
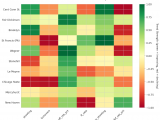
Figure 3: Defensive Four Factors comparison across Ohio Valley teams. The radar chart shows each team’s opponent shooting defense (Opp eFG%), ball disruption (forcing TOV%), defensive rebounding (DREB%), and opponent free throw prevention (Opp FT Rate).
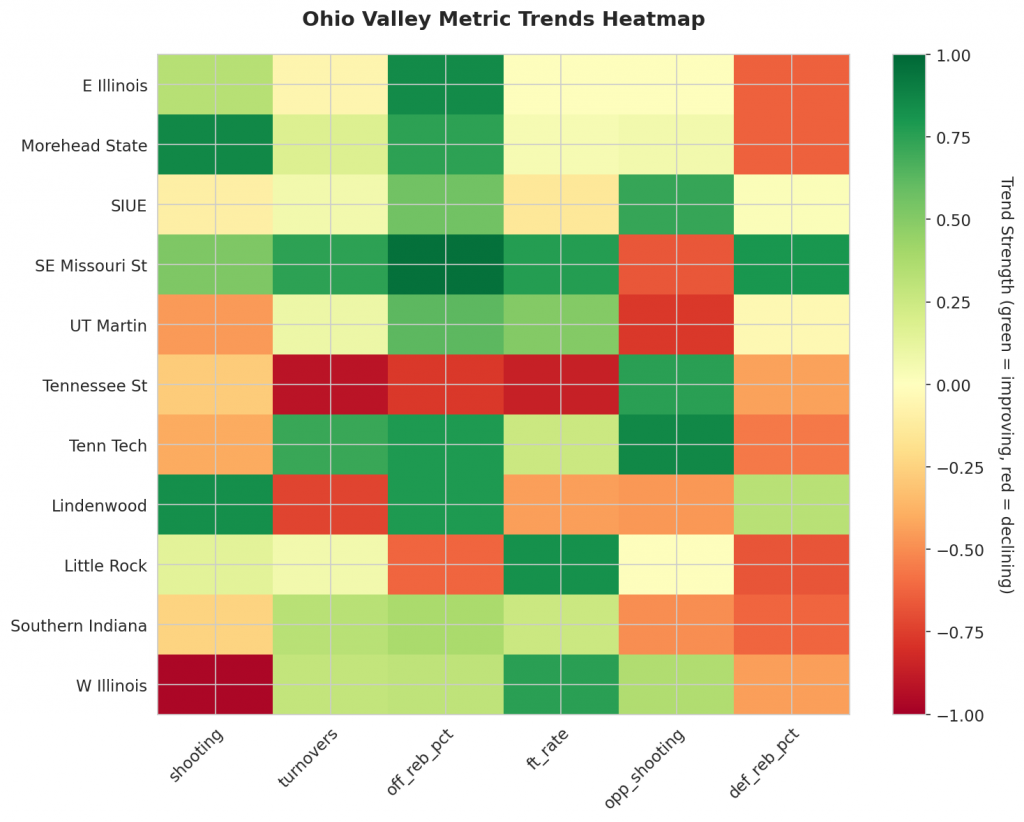
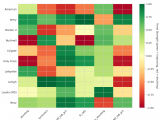
Figure 4: MACD trends heatmap showing which metrics are improving (green) or declining (red) for each team. Stronger colors indicate more pronounced trends.
Looking Ahead
As Ohio Valley teams continue their season, the MACD trending indicators will help identify which teams are genuinely improving versus those riding unsustainable momentum. Check back next week for updated analysis.
Metrics Glossary
Four Factors (Dean Oliver’s framework for basketball success):
- eFG% (Effective Field Goal %): Field goal percentage adjusted for 3-pointers being worth more (FGM + 0.5×3PM) / FGA. Higher is better offensively, lower is better defensively.
- TOV% (Turnover Rate): Turnovers per 100 possessions. Lower is better offensively (taking care of the ball), higher is better defensively (forcing turnovers).
- OREB% / DREB% (Offensive/Defensive Rebound Rate): Percentage of available rebounds grabbed. Offensive rebounds create second-chance points; defensive rebounds end opponent possessions.
- FTR (Free Throw Rate): Free throws made per field goal attempt (FTM/FGA). Measures ability to get to the line AND convert. Higher is better offensively, lower is better defensively.
Other Metrics:
- Elo Rating: Chess-style rating system that updates based on game results and opponent strength. Higher Elo indicates stronger team.
- Efficiency Margin: Point differential per 100 possessions (Offensive Efficiency – Defensive Efficiency). Accounts for pace of play.
- MACD (Moving Average Convergence Divergence): Trend indicator comparing 12-game and 26-game exponential moving averages. Positive MACD = improving trend, Negative MACD = declining trend.
Analysis powered by HoopSci’s advanced metrics and MACD trending indicators.