WAC Update: Week 9
January 5, 2026The WAC enters Week 9 with teams showing diverse trending patterns. This analysis examines each team’s performance trends using MACD (Moving Average Convergence Divergence) indicators to identify not just where teams stand, but where they’re headed.
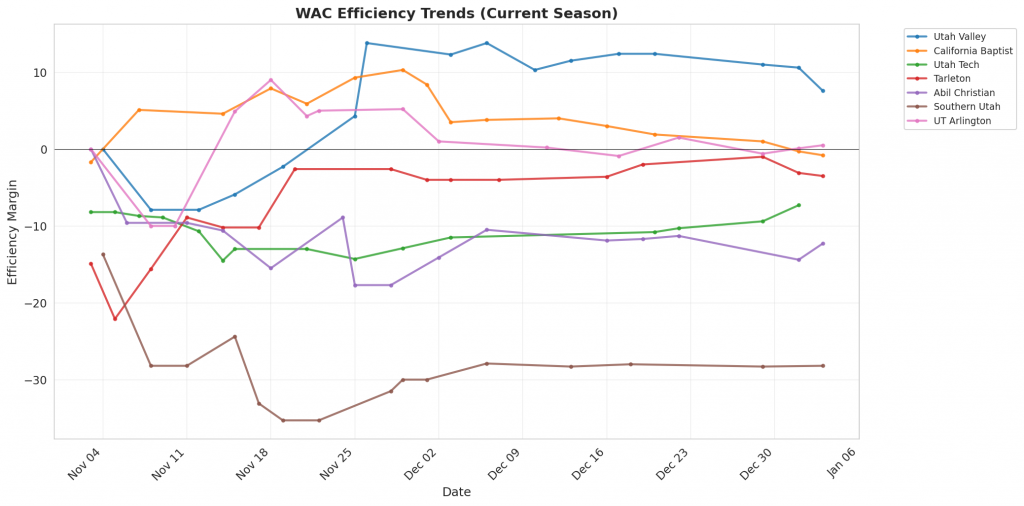
Figure 1: Efficiency margin trends for WAC teams throughout the season. Teams trending upward show improving performance, while downward trends indicate struggles.
Conference Snapshot
- Week Dates: December 29 – January 04, 2026
- Trending Up (Efficiency): Utah Valley, California Baptist, Utah Tech, Tarleton, Abil Christian
- Trending Down (Efficiency): UT Arlington
Team-by-Team Analysis
Abil Christian
Record: 9-6 | Elo: 1503.0 (ranked 188 of 365) | Efficiency Margin: -12.33 (ranked 263 of 365)
Offensive Trends:
- Off Reb Pct (Offensive Rebounding): Currently ranked 146 of 365 in D1. Trending down strongly 🔴.
- FG Pct (Field Goal Percentage (FGM/FGA)): Currently ranked 203 of 365 in D1. Trending up strongly 🟢.
Defensive Trends:
- Opp Shooting (Opp Shooting): Currently ranked 344 of 365 in D1. Trending up strongly 🔴.
- Opp FGM Per Poss (Opp FG Makes Per Possession (%)): Currently ranked 89 of 365 in D1. Trending up strongly 🔴.
California Baptist
Record: 10-6 | Elo: 1532.7 (ranked 138 of 365) | Efficiency Margin: -0.83 (ranked 168 of 365)
Offensive Trends:
- Turnovers (Turnovers): Currently ranked 309 of 365 in D1. Trending up strongly 🔴.
- FGA Per Poss (Field Goal Attempts Per Possession (%)): Currently ranked 136 of 365 in D1. Trending down strongly 🔴.
Defensive Trends:
- Opp FT Rate (Opp FTA/FGA (%)): Currently ranked 282 of 365 in D1. Trending up strongly 🔴.
- Opp 3Pt Pct (Opp 3 Point FGM/FGA (%)): Currently ranked 113 of 365 in D1. Trending up strongly 🔴.
Southern Utah
Record: 4-11 | Elo: 1367.0 (ranked 339 of 365) | Efficiency Margin: -28.24 (ranked 354 of 365)
Offensive Trends:
- FTM Per Poss (Free Throw Makes Per Possession (%)): Currently ranked 325 of 365 in D1. Trending down strongly 🔴.
- FTA Per Poss (Free Throw Attempts Per Possession (%)): Currently ranked 330 of 365 in D1. Trending down strongly 🔴.
Defensive Trends:
- Opp Shooting (Opp Shooting): Currently ranked 345 of 365 in D1. Trending up strongly 🔴.
- Opp 3PM Per Poss (Opp 3 Point Makes Per Possession (%)): Currently ranked 287 of 365 in D1. Trending up strongly 🔴.
Tarleton
Record: 11-5 | Elo: 1508.7 (ranked 174 of 365) | Efficiency Margin: -3.54 (ranked 189 of 365)
Offensive Trends:
- Shooting (Shooting): Currently ranked 168 of 365 in D1. Trending up strongly 🟢.
- Turnovers (Turnovers): Currently ranked 290 of 365 in D1. Trending down strongly 🟢.
Defensive Trends:
- Opp Turnovers (Opp Turnovers): Currently ranked 1 of 365 in D1. Trending up strongly 🔴.
- Opp Off Tempo (Opp Offensive Possessions Per Game): Currently ranked 84 of 365 in D1. Trending up strongly 🔴.
UT Arlington
Record: 10-5 | Elo: 1515.3 (ranked 159 of 365) | Efficiency Margin: +0.53 (ranked 159 of 365)
Offensive Trends:
- Off Reb Pct (Offensive Rebounding): Currently ranked 98 of 365 in D1. Trending down strongly 🔴.
- FT Rate (FTA/FGA (%)): Currently ranked 54 of 365 in D1. Trending up strongly 🟢.
Defensive Trends:
- Def Reb Pct (Defensive Rebounding): Currently ranked 33 of 365 in D1. Trending up strongly 🟢.
- Opp FGM Per Poss (Opp FG Makes Per Possession (%)): Currently ranked 35 of 365 in D1. Trending down strongly 🟢.
Utah Tech
Record: 8-7 | Elo: 1411.9 (ranked 295 of 365) | Efficiency Margin: -7.28 (ranked 222 of 365)
Offensive Trends:
- Shooting (Shooting): Currently ranked 129 of 365 in D1. Trending up strongly 🟢.
- FT Rate (FTA/FGA (%)): Currently ranked 331 of 365 in D1. Trending down strongly 🔴.
Defensive Trends:
- Opp Turnovers (Opp Turnovers): Currently ranked 98 of 365 in D1. Trending up strongly 🔴.
- Opp 2Pt Rate (Opp 2 Point Attempts/FGA (%)): Currently ranked 300 of 365 in D1. Trending down strongly 🟢.
Utah Valley
Record: 12-4 | Elo: 1631.3 (ranked 50 of 365) | Efficiency Margin: +7.59 (ranked 108 of 365)
Offensive Trends:
- Shooting (Shooting): Currently ranked 31 of 365 in D1. Trending up strongly 🟢.
- Turnovers (Turnovers): Currently ranked 353 of 365 in D1. Trending up strongly 🔴.
Defensive Trends:
- Opp FGM Per Poss (Opp FG Makes Per Possession (%)): Currently ranked 83 of 365 in D1. Trending up strongly 🔴.
- Opp FG Pct (%) (Opp FGM/FGA (%)): Currently ranked 136 of 365 in D1. Trending up strongly 🔴.
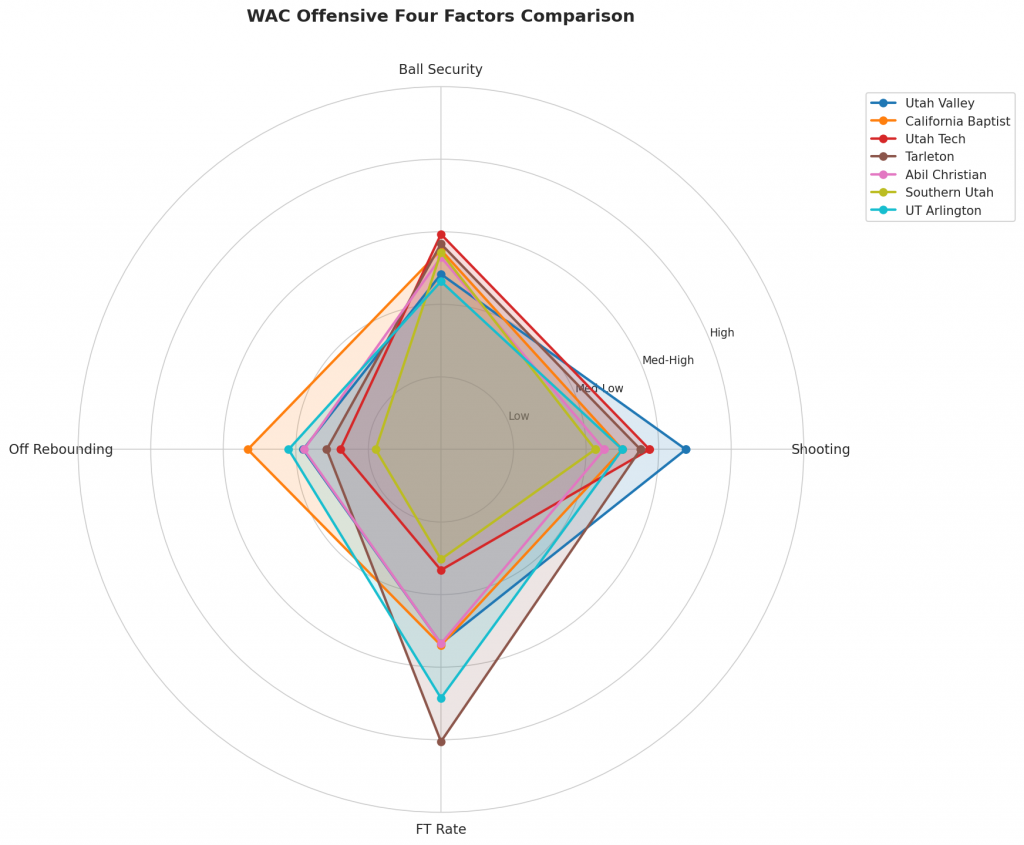
Figure 2: Offensive Four Factors comparison across WAC teams. The radar chart shows each team’s shooting efficiency (eFG%), ball security (TOV%), offensive rebounding (OREB%), and free throw generation (FT Rate).
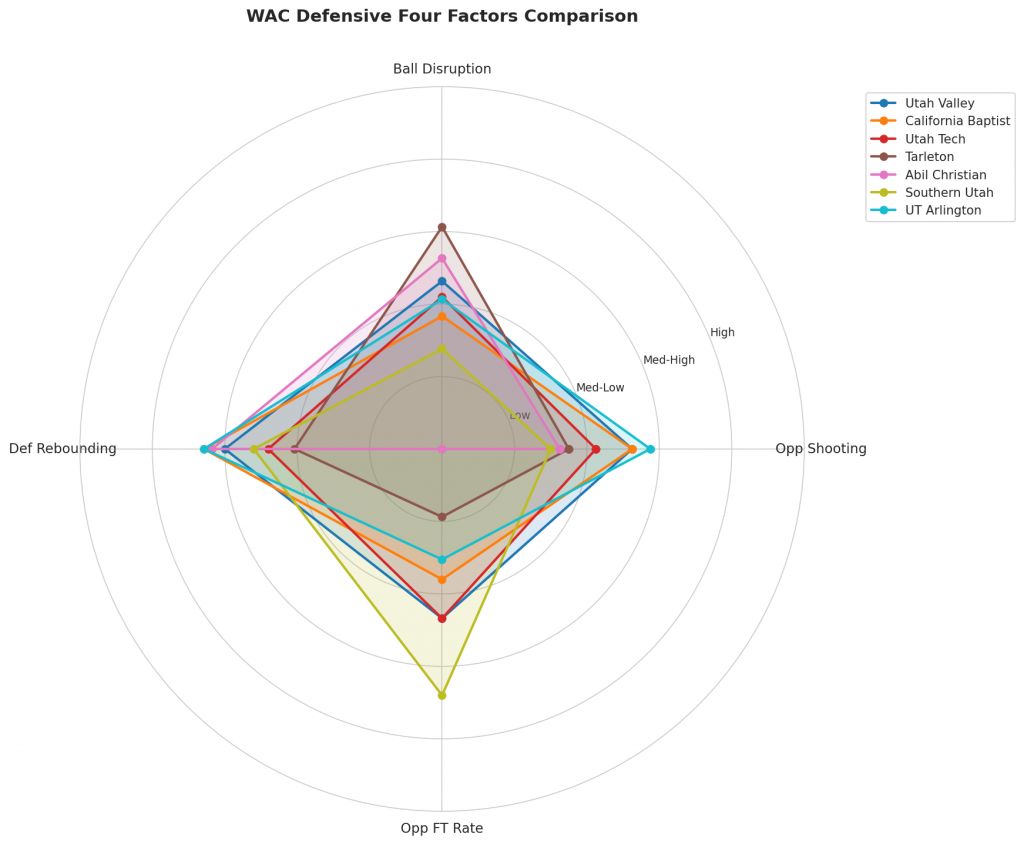
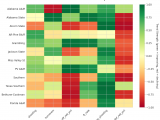
Figure 3: Defensive Four Factors comparison across WAC teams. The radar chart shows each team’s opponent shooting defense (Opp eFG%), ball disruption (forcing TOV%), defensive rebounding (DREB%), and opponent free throw prevention (Opp FT Rate).
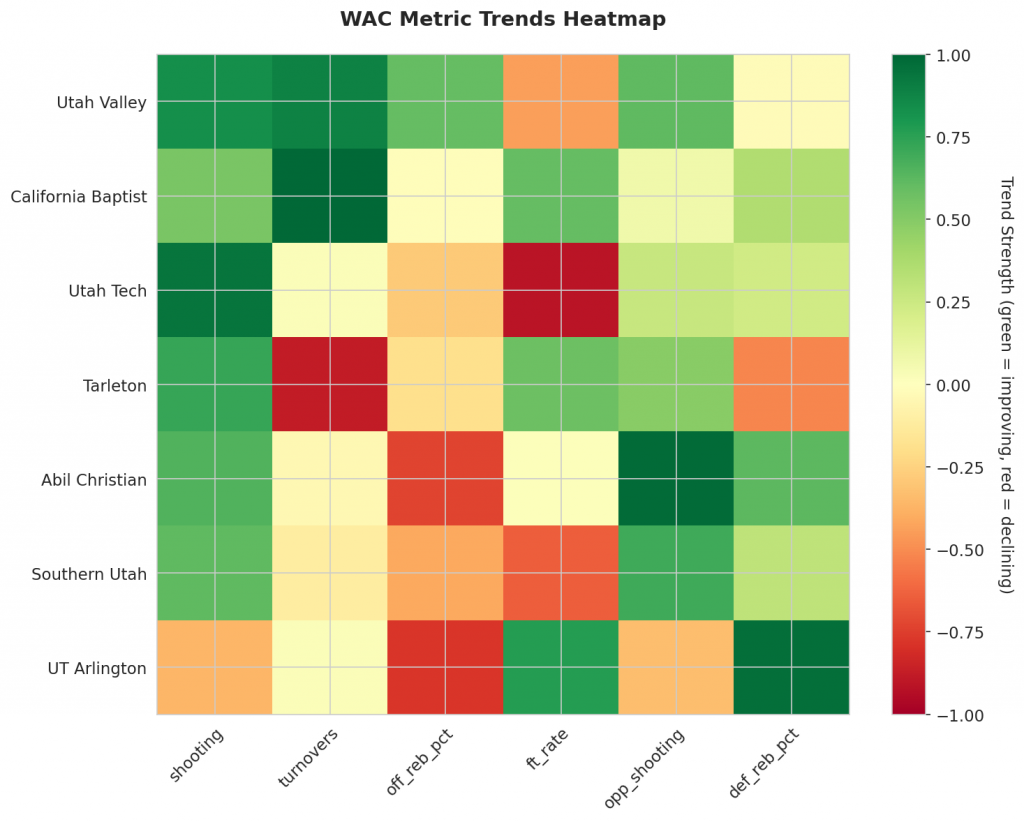
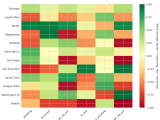
Figure 4: MACD trends heatmap showing which metrics are improving (green) or declining (red) for each team. Stronger colors indicate more pronounced trends.
Looking Ahead
As WAC teams continue their season, the MACD trending indicators will help identify which teams are genuinely improving versus those riding unsustainable momentum. Check back next week for updated analysis.
Metrics Glossary
Four Factors (Dean Oliver’s framework for basketball success):
- eFG% (Effective Field Goal %): Field goal percentage adjusted for 3-pointers being worth more (FGM + 0.5×3PM) / FGA. Higher is better offensively, lower is better defensively.
- TOV% (Turnover Rate): Turnovers per 100 possessions. Lower is better offensively (taking care of the ball), higher is better defensively (forcing turnovers).
- OREB% / DREB% (Offensive/Defensive Rebound Rate): Percentage of available rebounds grabbed. Offensive rebounds create second-chance points; defensive rebounds end opponent possessions.
- FTR (Free Throw Rate): Free throws made per field goal attempt (FTM/FGA). Measures ability to get to the line AND convert. Higher is better offensively, lower is better defensively.
Other Metrics:
- Elo Rating: Chess-style rating system that updates based on game results and opponent strength. Higher Elo indicates stronger team.
- Efficiency Margin: Point differential per 100 possessions (Offensive Efficiency – Defensive Efficiency). Accounts for pace of play.
- MACD (Moving Average Convergence Divergence): Trend indicator comparing 12-game and 26-game exponential moving averages. Positive MACD = improving trend, Negative MACD = declining trend.
Analysis powered by HoopSci’s advanced metrics and MACD trending indicators.