Ohio Valley Update: Week 10
January 12, 2026The Ohio Valley enters Week 10 with teams showing diverse trending patterns. This analysis examines each team’s performance trends using MACD (Moving Average Convergence Divergence) indicators to identify not just where teams stand, but where they’re headed.
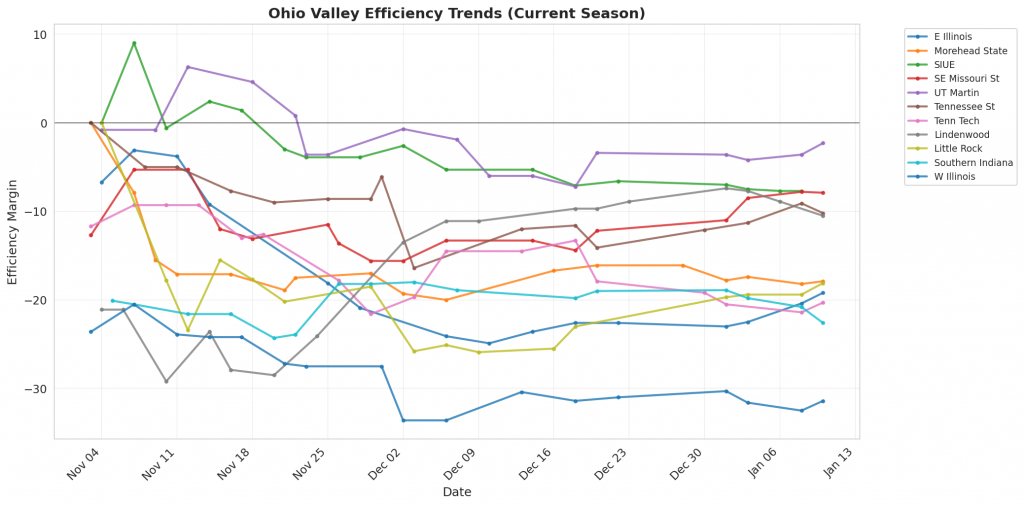
Figure 1: Efficiency margin trends for Ohio Valley teams throughout the season. Teams trending upward show improving performance, while downward trends indicate struggles.
Conference Snapshot
- Week Dates: January 05 – January 11, 2026
- Trending Up (Efficiency): E Illinois, Morehead State, SIUE, SE Missouri St, Tennessee St
- Trending Down (Efficiency): UT Martin, Tenn Tech, Southern Indiana, W Illinois
Team-by-Team Analysis
E Illinois
Record: 5-10 | Elo: 1387.3 (ranked 319 of 365) | Efficiency Margin: -19.15 (ranked 318 of 365)
Offensive Trends:
- Shooting (Shooting): Currently ranked 345 of 365 in D1. Trending up strongly 🟢.
- FGM Per Poss (Field Goal Makes Per Possession (%)): Currently ranked 323 of 365 in D1. Trending up strongly 🟢.
Defensive Trends:
- Opp FT Pct (Opp FTM/FTA (%)): Currently ranked 290 of 365 in D1. Trending up strongly 🔴.
- Opp Shooting (Opp Shooting): Currently ranked 210 of 365 in D1. Trending down moderately 🟢.
Lindenwood
Record: 10-7 | Elo: 1430.5 (ranked 276 of 365) | Efficiency Margin: -10.50 (ranked 251 of 365)
Offensive Trends:
- FT Rate (FTA/FGA (%)): Currently ranked 130 of 365 in D1. Trending down strongly 🔴.
- Adj Off Eff (Adjusted Offensive Efficiency): Currently ranked 294 of 365 in D1. Trending up strongly 🟢.
Defensive Trends:
- Opp FGM Per Poss (Opp FG Makes Per Possession (%)): Currently ranked 180 of 365 in D1. Trending up strongly 🔴.
- Opp 2Pt Rate (Opp 2 Point Attempts/FGA (%)): Currently ranked 320 of 365 in D1. Trending up strongly 🔴.
Little Rock
Record: 6-10 | Elo: 1467.5 (ranked 233 of 365) | Efficiency Margin: -18.11 (ranked 309 of 365)
Offensive Trends:
- Turnovers (Turnovers): Currently ranked 354 of 365 in D1. Trending down strongly 🟢.
- FT Rate (FTA/FGA (%)): Currently ranked 297 of 365 in D1. Trending up strongly 🟢.
Defensive Trends:
- Def Reb Pct (Defensive Rebounding): Currently ranked 349 of 365 in D1. Trending down strongly 🔴.
- Opp FGM Per Poss (Opp FG Makes Per Possession (%)): Currently ranked 320 of 365 in D1. Trending up strongly 🔴.
Morehead State
Record: 8-9 | Elo: 1456.9 (ranked 243 of 365) | Efficiency Margin: -17.93 (ranked 308 of 365)
Offensive Trends:
- Shooting (Shooting): Currently ranked 290 of 365 in D1. Trending up strongly 🟢.
- Off Reb Pct (Offensive Rebounding): Currently ranked 62 of 365 in D1. Trending up strongly 🟢.
Defensive Trends:
- Def Reb Pct (Defensive Rebounding): Currently ranked 326 of 365 in D1. Trending down strongly 🔴.
- Opp 2Pt Rate (Opp 2 Point Attempts/FGA (%)): Currently ranked 97 of 365 in D1. Trending down strongly 🟢.
SE Missouri St
Record: 9-8 | Elo: 1481.7 (ranked 219 of 365) | Efficiency Margin: -7.90 (ranked 225 of 365)
Offensive Trends:
- FT Rate (FTA/FGA (%)): Currently ranked 191 of 365 in D1. Trending up strongly 🟢.
- FTM Per Poss (Free Throw Makes Per Possession (%)): Currently ranked 231 of 365 in D1. Trending up strongly 🟢.
Defensive Trends:
- Opp FT Rate (Opp FTA/FGA (%)): Currently ranked 361 of 365 in D1. Trending up moderately 🔴.
- Opp FGA Per Poss (Opp FG Attempts Per Possession (%)): Currently ranked 3 of 365 in D1. Trending down moderately 🟢.
SIUE
Record: 10-7 | Elo: 1489.1 (ranked 208 of 365) | Efficiency Margin: -7.70 (ranked 224 of 365)
Offensive Trends:
- Turnovers (Turnovers): Currently ranked 214 of 365 in D1. Trending up strongly 🔴.
- 2PM Per Poss (2 Point Makes Per Possession (%)): Currently ranked 146 of 365 in D1. Trending down strongly 🔴.
Defensive Trends:
- Def Reb Pct (Defensive Rebounding): Currently ranked 188 of 365 in D1. Trending down strongly 🔴.
- Opp 2Pt Rate (Opp 2 Point Attempts/FGA (%)): Currently ranked 130 of 365 in D1. Trending up strongly 🔴.
Southern Indiana
Record: 3-13 | Elo: 1295.9 (ranked 364 of 365) | Efficiency Margin: -22.64 (ranked 338 of 365)
Offensive Trends:
- FT Rate (FTA/FGA (%)): Currently ranked 126 of 365 in D1. Trending up strongly 🟢.
- FGM Per Poss (Field Goal Makes Per Possession (%)): Currently ranked 352 of 365 in D1. Trending down strongly 🔴.
Defensive Trends:
- Def Reb Pct (Defensive Rebounding): Currently ranked 283 of 365 in D1. Trending down strongly 🔴.
- Opp FG Pct (%) (Opp FGM/FGA (%)): Currently ranked 245 of 365 in D1. Trending up strongly 🔴.
Tenn Tech
Record: 7-10 | Elo: 1394.4 (ranked 312 of 365) | Efficiency Margin: -20.34 (ranked 325 of 365)
Offensive Trends:
- Shooting (Shooting): Currently ranked 249 of 365 in D1. Trending down strongly 🔴.
- Turnovers (Turnovers): Currently ranked 343 of 365 in D1. Trending up strongly 🔴.
Defensive Trends:
- Opp FT Rate (Opp FTA/FGA (%)): Currently ranked 142 of 365 in D1. Trending up strongly 🔴.
- Opp FGA Per Poss (Opp FG Attempts Per Possession (%)): Currently ranked 242 of 365 in D1. Trending down strongly 🟢.
Tennessee St
Record: 10-6 | Elo: 1505.4 (ranked 175 of 365) | Efficiency Margin: -10.21 (ranked 248 of 365)
Offensive Trends:
- Turnovers (Turnovers): Currently ranked 224 of 365 in D1. Trending down strongly 🟢.
- Off Reb Pct (Offensive Rebounding): Currently ranked 171 of 365 in D1. Trending down strongly 🔴.
Defensive Trends:
- Opp 2Pt Rate (Opp 2 Point Attempts/FGA (%)): Currently ranked 334 of 365 in D1. Trending up strongly 🔴.
- Opp 3Pt Rate (Opp 3 Point Attempts/FGA (%)): Currently ranked 32 of 365 in D1. Trending down strongly 🟢.
UT Martin
Record: 13-4 | Elo: 1502.9 (ranked 179 of 365) | Efficiency Margin: -2.31 (ranked 182 of 365)
Offensive Trends:
- Off Reb Pct (Offensive Rebounding): Currently ranked 52 of 365 in D1. Trending up strongly 🟢.
- Adj Off Eff (Adjusted Offensive Efficiency): Currently ranked 218 of 365 in D1. Trending up strongly 🟢.
Defensive Trends:
- Opp Shooting (Opp Shooting): Currently ranked 45 of 365 in D1. Trending down strongly 🟢.
- Def Reb Pct (Defensive Rebounding): Currently ranked 219 of 365 in D1. Trending down strongly 🔴.
W Illinois
Record: 4-13 | Elo: 1342.3 (ranked 355 of 365) | Efficiency Margin: -31.44 (ranked 357 of 365)
Offensive Trends:
- Shooting (Shooting): Currently ranked 357 of 365 in D1. Trending down strongly 🔴.
- FT Rate (FTA/FGA (%)): Currently ranked 92 of 365 in D1. Trending up strongly 🟢.
Defensive Trends:
- Opp Turnovers (Opp Turnovers): Currently ranked 266 of 365 in D1. Trending up strongly 🔴.
- Opp FGA Per Poss (Opp FG Attempts Per Possession (%)): Currently ranked 246 of 365 in D1. Trending down strongly 🟢.

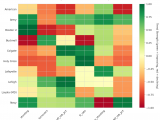
Figure 2: Offensive Four Factors comparison across Ohio Valley teams. The radar chart shows each team’s shooting efficiency (eFG%), ball security (TOV%), offensive rebounding (OREB%), and free throw generation (FT Rate).
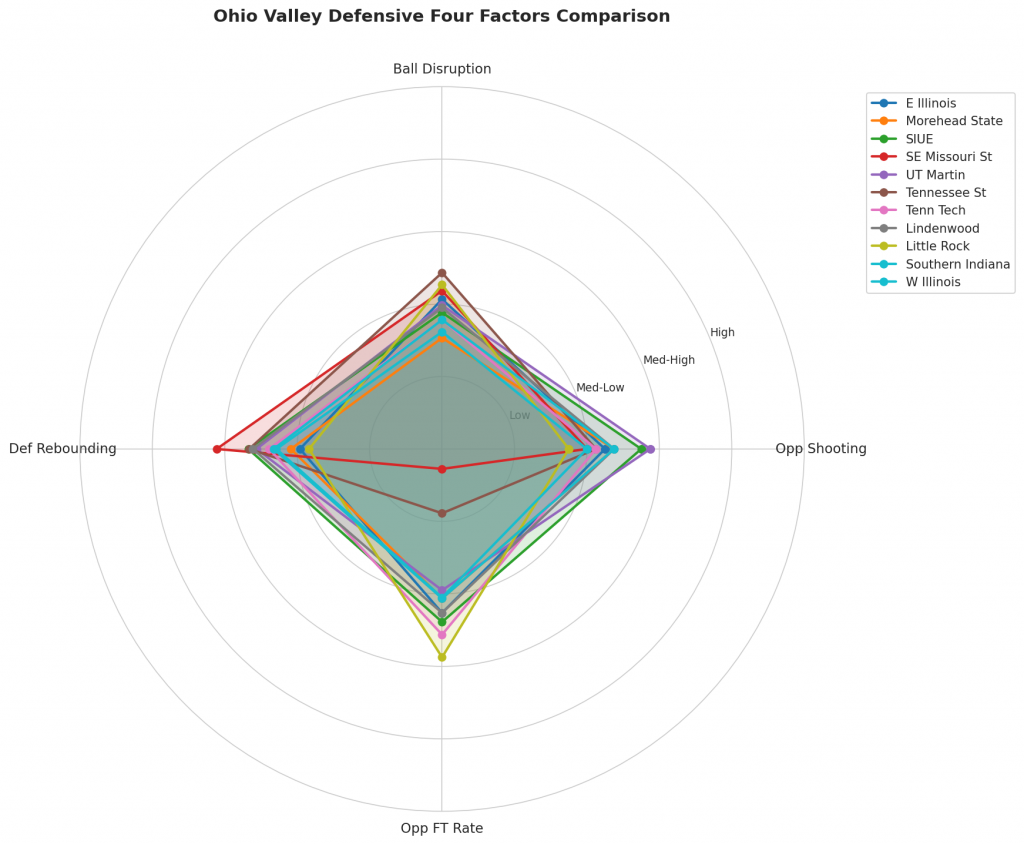
Figure 3: Defensive Four Factors comparison across Ohio Valley teams. The radar chart shows each team’s opponent shooting defense (Opp eFG%), ball disruption (forcing TOV%), defensive rebounding (DREB%), and opponent free throw prevention (Opp FT Rate).
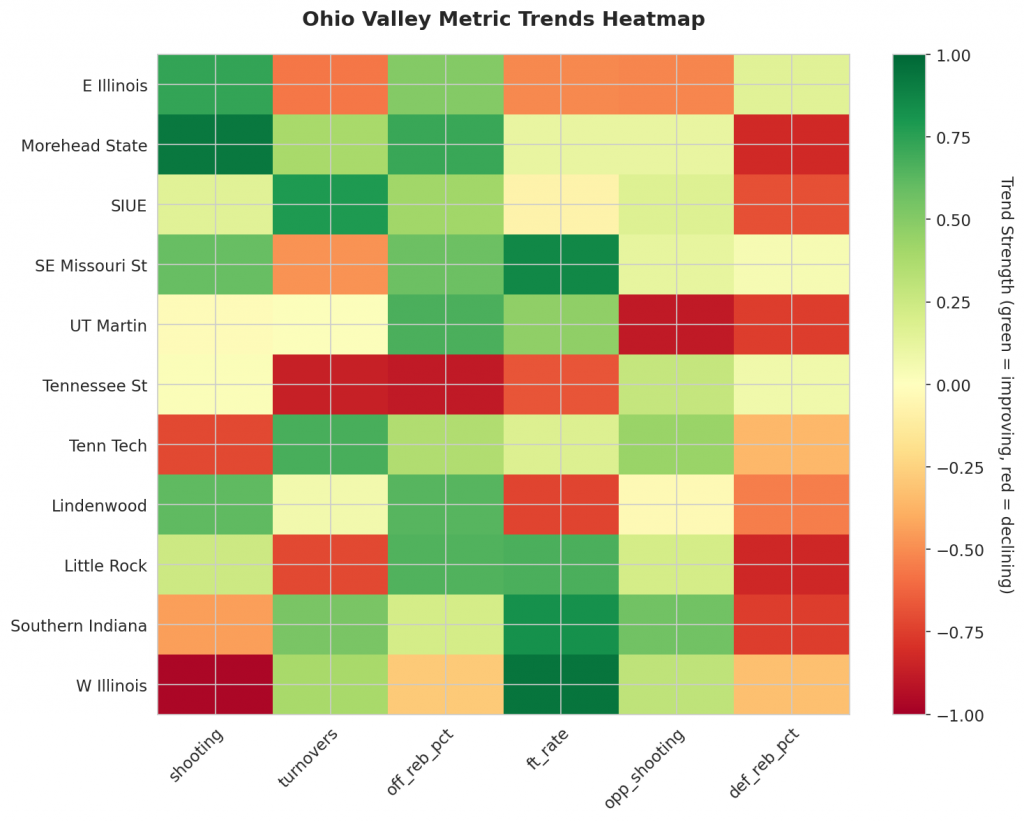
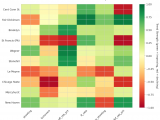
Figure 4: MACD trends heatmap showing which metrics are improving (green) or declining (red) for each team. Stronger colors indicate more pronounced trends.
Looking Ahead
As Ohio Valley teams continue their season, the MACD trending indicators will help identify which teams are genuinely improving versus those riding unsustainable momentum. Check back next week for updated analysis.
Metrics Glossary
Four Factors (Dean Oliver’s framework for basketball success):
- eFG% (Effective Field Goal %): Field goal percentage adjusted for 3-pointers being worth more (FGM + 0.5×3PM) / FGA. Higher is better offensively, lower is better defensively.
- TOV% (Turnover Rate): Turnovers per 100 possessions. Lower is better offensively (taking care of the ball), higher is better defensively (forcing turnovers).
- OREB% / DREB% (Offensive/Defensive Rebound Rate): Percentage of available rebounds grabbed. Offensive rebounds create second-chance points; defensive rebounds end opponent possessions.
- FTR (Free Throw Rate): Free throws made per field goal attempt (FTM/FGA). Measures ability to get to the line AND convert. Higher is better offensively, lower is better defensively.
Other Metrics:
- Elo Rating: Chess-style rating system that updates based on game results and opponent strength. Higher Elo indicates stronger team.
- Efficiency Margin: Point differential per 100 possessions (Offensive Efficiency – Defensive Efficiency). Accounts for pace of play.
- MACD (Moving Average Convergence Divergence): Trend indicator comparing 12-game and 26-game exponential moving averages. Positive MACD = improving trend, Negative MACD = declining trend.
Analysis powered by HoopSci’s advanced metrics and MACD trending indicators.