Summit League Update: Week 17
March 2, 2026Strongest Offensive Trends
- North Dakota, Off Reb Pct, Down, Trend Strength: -0.038 – The North Dakota team’s inability to capitalize on scoring chances, specifically converting 2-on-1 breaks into goals, has hindered its offense’s performance this season.
- North Dakota St, Off Reb Pct, Down, Trend Strength: -0.027 – North Dakota St’s inconsistent performance is largely due to their struggles with securing rebounds, which leads to a loss of momentum and frequently results in turnovers that deny them opportunities to capitalize on scoring chances in key situations.
- Omaha, Off Reb Pct, Down, Trend Strength: -0.017 – The Omaha team struggles with grabbing rebounds on offense, contributing to their challenges scoring points effectively.
- Denver, Off Reb Pct, Down, Trend Strength: -0.016 – Denver’s struggles with scoring are largely due to its problem with low offensive rebounding, which has led to inconsistencies in its field goal shooting accuracy.
- Denver, Turnovers, Down, Trend Strength: -0.015 – Denver’s struggles with turnovers contribute to its instability in the Summit League, as reducing mistakes on defense hinders overall stability.
Strongest Defensive Trends
- Oral Roberts, Def Reb Pct, Up, Trend Strength: 0.036 – Oral Roberts has shown a notable improvement on the defensive glass, having overcome last season’s struggles with securing rebounds.
- North Dakota St, Def Reb Pct, Up, Trend Strength: 0.024 – North Dakota St’s defensive rebounding struggles have been a persistent issue, with the team frequently allowing opponents to secure second-chance opportunities on the glass.
- Omaha, Def Reb Pct, Up, Trend Strength: 0.019 – Omaha’s defense has shown improvement in their defensive rebounding efforts, allowing them to maintain possession and limit scoring opportunities, but they still struggle with adapting to adversity on the court.
- Denver, Def Reb Pct, Up, Trend Strength: 0.013 – Denver’s improvement in defensive rebounding could prove problematic for opponents trying to maintain their scoring momentum.
- North Dakota, Def Reb Pct, Down, Trend Strength: -0.013 – North Dakota’s defensive rebounding woes have worsened, as evidenced by opposing teams consistently securing rebounds on their end of the court.
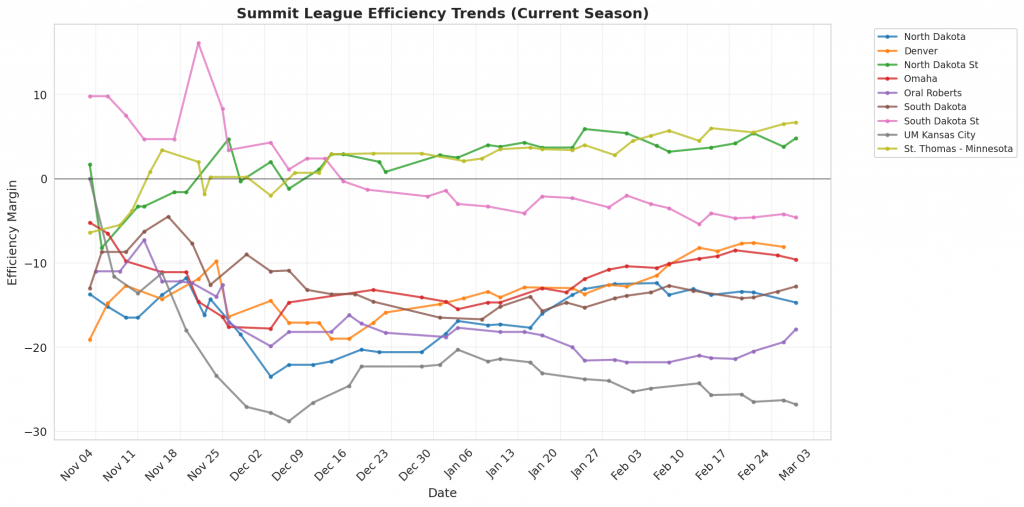
Figure 1: Efficiency margin trends for Summit League teams throughout the season. Teams trending upward show improving performance, while downward trends indicate struggles.
Conference Snapshot
- Week Dates: February 23 – March 01, 2026
- Trending Up (Efficiency): North Dakota St, Oral Roberts, St. Thomas – Minnesota
- Trending Down (Efficiency): North Dakota, Denver, Omaha, South Dakota, South Dakota St
Team-by-Team Analysis
Denver
Record: 15-16 | Elo: 1430.6 (ranked 267 of 365) | Efficiency Margin: -8.07 (ranked 237 of 365)
Offensive Trends:
- Turnovers (Turnovers): Currently ranked 18 of 365 in D1. Trending down strongly 🟢.
- Off Reb Pct (Offensive Rebounding): Currently ranked 178 of 365 in D1. Trending down strongly 🔴.
Defensive Trends:
- Def Reb Pct (Defensive Rebounding): Currently ranked 273 of 365 in D1. Trending up strongly 🟢.
- Opp Turnovers (Opp Turnovers): Currently ranked 352 of 365 in D1. Trending down moderately 🔴.
North Dakota
Record: 16-16 | Elo: 1446.8 (ranked 253 of 365) | Efficiency Margin: -14.66 (ranked 294 of 365)
Offensive Trends:
- Off Reb Pct (Offensive Rebounding): Currently ranked 250 of 365 in D1. Trending down strongly 🔴.
- Turnovers (Turnovers): Currently ranked 29 of 365 in D1. Trending down moderately 🟢.
Defensive Trends:
- Def Reb Pct (Defensive Rebounding): Currently ranked 289 of 365 in D1. Trending down strongly 🔴.
- Opp Shooting (Opp Shooting): Currently ranked 361 of 365 in D1. Trending up moderately 🔴.
North Dakota St
Record: 24-7 | Elo: 1612.9 (ranked 64 of 365) | Efficiency Margin: +4.81 (ranked 114 of 365)
Offensive Trends:
- Off Reb Pct (Offensive Rebounding): Currently ranked 85 of 365 in D1. Trending down strongly 🔴.
- Shooting (Shooting): Currently ranked 75 of 365 in D1. Trending up moderately 🟢.
Defensive Trends:
- Def Reb Pct (Defensive Rebounding): Currently ranked 28 of 365 in D1. Trending up strongly 🟢.
- Opp Turnovers (Opp Turnovers): Currently ranked 61 of 365 in D1. Trending down moderately 🔴.
Omaha
Record: 12-16 | Elo: 1480.6 (ranked 209 of 365) | Efficiency Margin: -9.58 (ranked 255 of 365)
Offensive Trends:
- Off Reb Pct (Offensive Rebounding): Currently ranked 331 of 365 in D1. Trending down strongly 🔴.
- Turnovers (Turnovers): Currently ranked 152 of 365 in D1. Trending down moderately 🟢.
Defensive Trends:
- Def Reb Pct (Defensive Rebounding): Currently ranked 98 of 365 in D1. Trending up strongly 🟢.
- Opp Shooting (Opp Shooting): Currently ranked 272 of 365 in D1. Trending up moderately 🔴.
Oral Roberts
Record: 9-22 | Elo: 1332.6 (ranked 348 of 365) | Efficiency Margin: -17.87 (ranked 316 of 365)
Offensive Trends:
- Shooting (Shooting): Currently ranked 279 of 365 in D1. Trending up strongly 🟢.
- Turnovers (Turnovers): Currently ranked 291 of 365 in D1. Trending down moderately 🟢.
Defensive Trends:
- Def Reb Pct (Defensive Rebounding): Currently ranked 265 of 365 in D1. Trending up strongly 🟢.
- Opp Shooting (Opp Shooting): Currently ranked 303 of 365 in D1. Trending down moderately 🟢.
South Dakota
Record: 15-15 | Elo: 1453.4 (ranked 242 of 365) | Efficiency Margin: -12.75 (ranked 277 of 365)
Offensive Trends:
- Off Reb Pct (Offensive Rebounding): Currently ranked 268 of 365 in D1. Trending down strongly 🔴.
- Turnovers (Turnovers): Currently ranked 205 of 365 in D1. Trending down moderately 🟢.
Defensive Trends:
- Opp Shooting (Opp Shooting): Currently ranked 309 of 365 in D1. Trending down strongly 🟢.
- Opp Turnovers (Opp Turnovers): Currently ranked 214 of 365 in D1. Trending down moderately 🔴.
South Dakota St
Record: 14-17 | Elo: 1476.8 (ranked 215 of 365) | Efficiency Margin: -4.56 (ranked 201 of 365)
Offensive Trends:
- Turnovers (Turnovers): Currently ranked 159 of 365 in D1. Trending down moderately 🟢.
- Off Reb Pct (Offensive Rebounding): Currently ranked 184 of 365 in D1. Trending down moderately 🔴.
Defensive Trends:
- Opp Turnovers (Opp Turnovers): Currently ranked 312 of 365 in D1. Trending down strongly 🔴.
- Def Reb Pct (Defensive Rebounding): Currently ranked 24 of 365 in D1. Trending up strongly 🟢.
St. Thomas – Minnesota
Record: 23-8 | Elo: 1593.4 (ranked 75 of 365) | Efficiency Margin: +6.70 (ranked 99 of 365)
Offensive Trends:
- Off Reb Pct (Offensive Rebounding): Currently ranked 360 of 365 in D1. Trending down strongly 🔴.
- Shooting (Shooting): Currently ranked 4 of 365 in D1. Trending up moderately 🟢.
Defensive Trends:
- Opp Shooting (Opp Shooting): Currently ranked 159 of 365 in D1. Trending down strongly 🟢.
- Opp Turnovers (Opp Turnovers): Currently ranked 139 of 365 in D1. Trending down strongly 🔴.
UM Kansas City
Record: 3-26 | Elo: 1268.2 (ranked 366 of 365) | Efficiency Margin: -26.80 (ranked 353 of 365)
Offensive Trends:
- Turnovers (Turnovers): Currently ranked 303 of 365 in D1. Trending down strongly 🟢.
- Off Reb Pct (Offensive Rebounding): Currently ranked 294 of 365 in D1. Trending down strongly 🔴.
Defensive Trends:
- Opp Shooting (Opp Shooting): Currently ranked 344 of 365 in D1. Trending up strongly 🔴.
- Opp Turnovers (Opp Turnovers): Currently ranked 188 of 365 in D1. Trending down moderately 🔴.
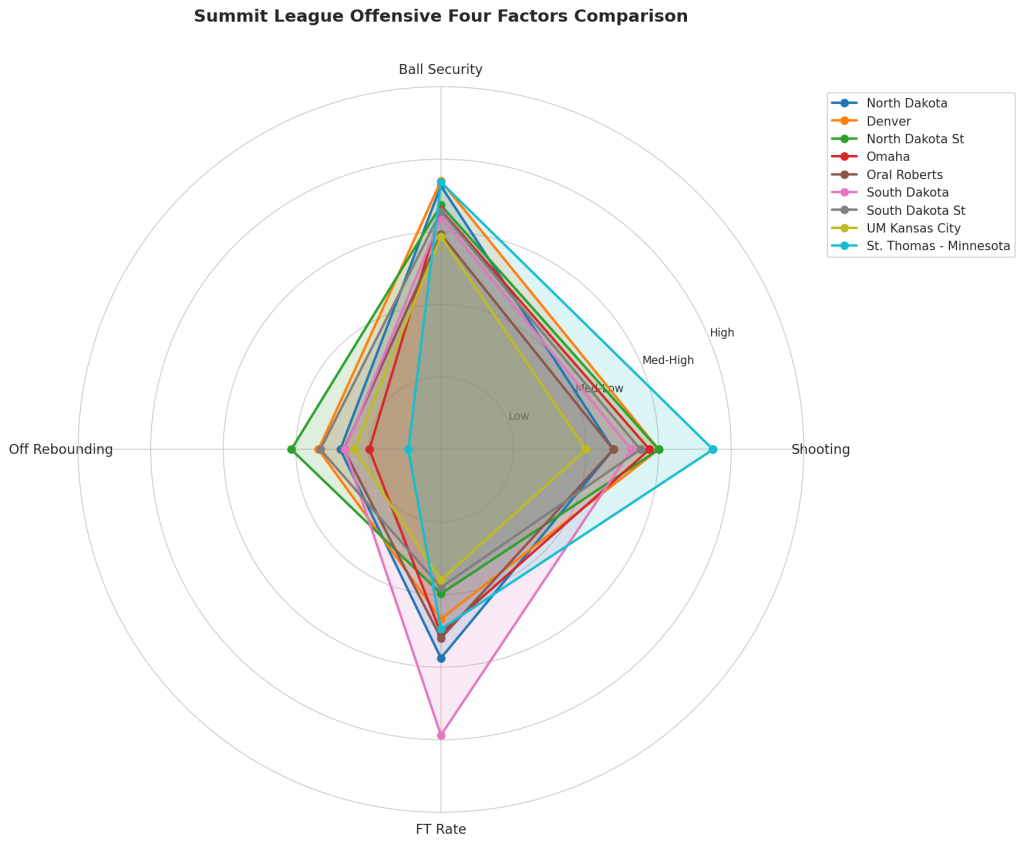
Figure 2: Offensive Four Factors comparison across Summit League teams. The radar chart shows each team’s shooting efficiency (eFG%), ball security (TOV%), offensive rebounding (OREB%), and free throw generation (FT Rate).
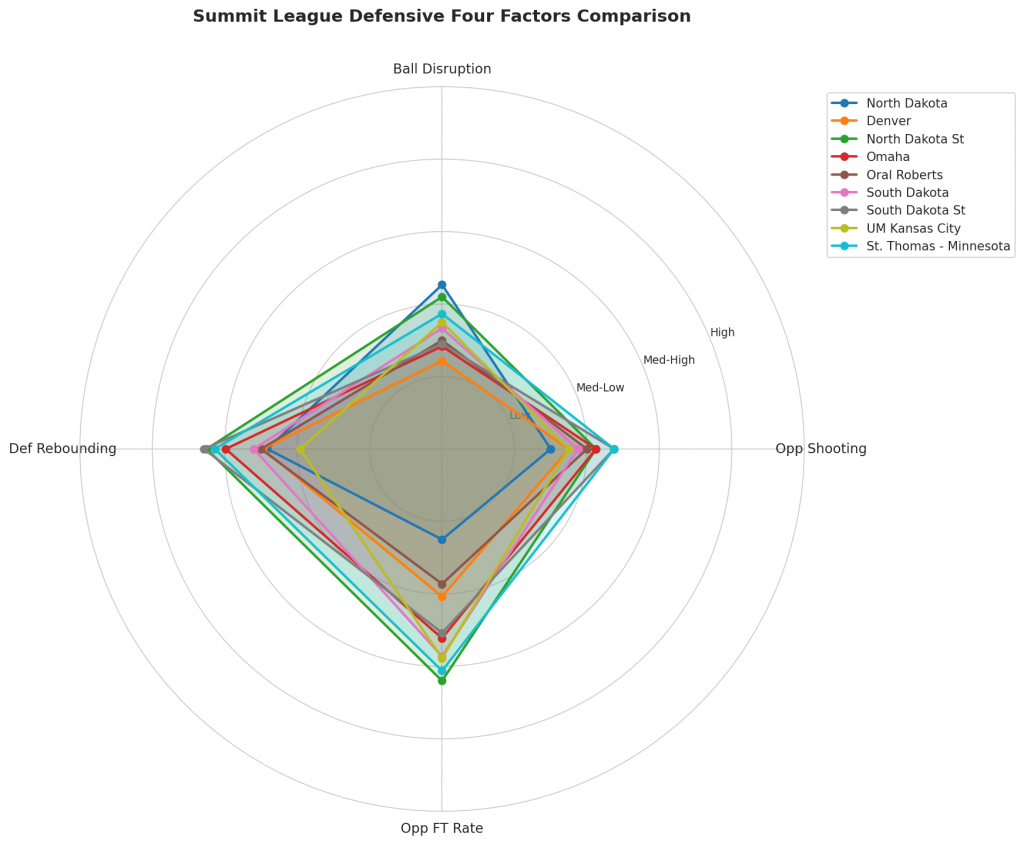
Figure 3: Defensive Four Factors comparison across Summit League teams. The radar chart shows each team’s opponent shooting defense (Opp eFG%), ball disruption (forcing TOV%), defensive rebounding (DREB%), and opponent free throw prevention (Opp FT Rate).
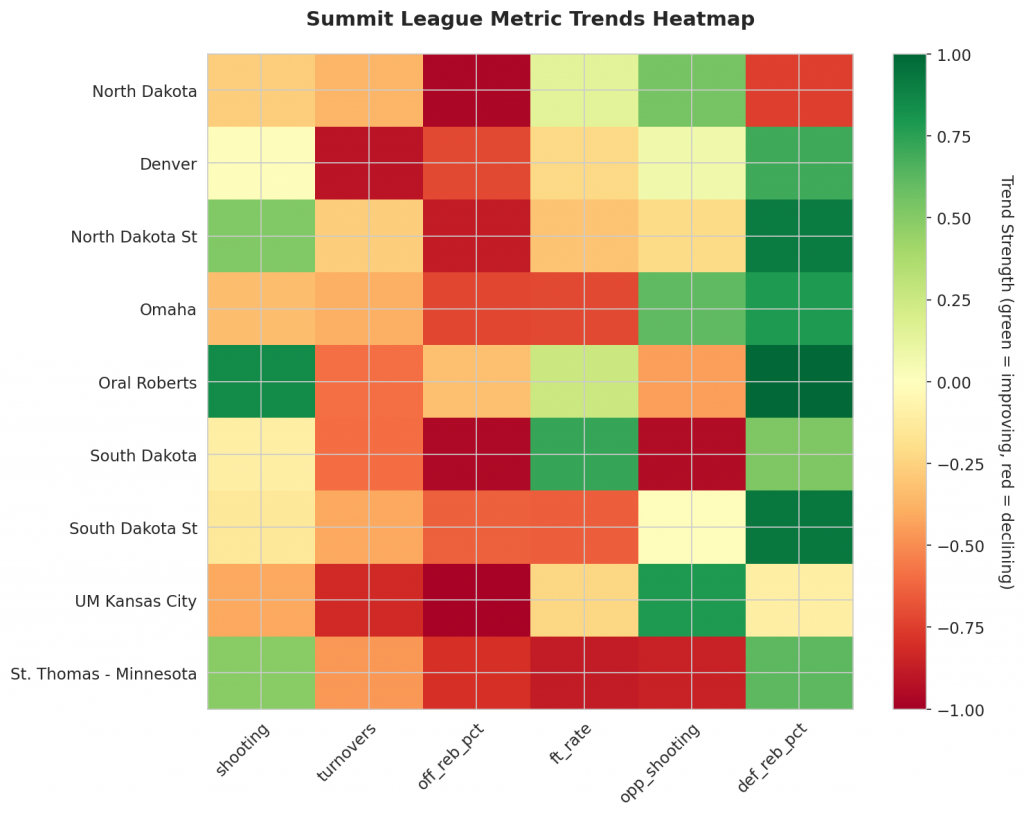
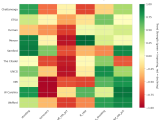
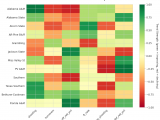
Figure 4: MACD trends heatmap showing which metrics are improving (green) or declining (red) for each team. Stronger colors indicate more pronounced trends.
Looking Ahead
Summit League Teams Face Challenges in Key Areas
As the Summit League season continues, several teams are facing difficulties in specific areas of their game. A closer look at the data reveals trends that could impact their performance moving forward.
Offensive Trends to Watch
North Dakota is struggling with defensive rebounding percentages, having seen a decline from 0.261, indicating worsening performance in this area. North Dakota State’s season average has also experienced a similar trend in defensive rebounding percentage. On the other hand, Denver Pioneers are showing improvement in terms of turnovers.
Defensive Trends to Highlight
On the defensive end, several teams are making strides. Denver Pioneers and North Dakota State are both grabbing more defensive boards, with their defensive rebounding percentages trending up strongly.
Metrics Glossary
Four Factors (Dean Oliver’s framework for basketball success):
- eFG% (Effective Field Goal %): Field goal percentage adjusted for 3-pointers being worth more (FGM + 0.5×3PM) / FGA. Higher is better offensively, lower is better defensively.
- TOV% (Turnover Rate): Turnovers per 100 possessions. Lower is better offensively (taking care of the ball), higher is better defensively (forcing turnovers).
- OREB% / DREB% (Offensive/Defensive Rebound Rate): Percentage of available rebounds grabbed. Offensive rebounds create second-chance points; defensive rebounds end opponent possessions.
- FTR (Free Throw Rate): Free throws made per field goal attempt (FTM/FGA). Measures ability to get to the line AND convert. Higher is better offensively, lower is better defensively.
Other Metrics:
- Elo Rating: Chess-style rating system that updates based on game results and opponent strength. Higher Elo indicates stronger team.
- Efficiency Margin: Point differential per 100 possessions (Offensive Efficiency – Defensive Efficiency). Accounts for pace of play.
- MACD (Moving Average Convergence Divergence): Trend indicator comparing 12-game and 26-game exponential moving averages. Positive MACD = improving trend, Negative MACD = declining trend.
Analysis powered by HoopSci’s advanced metrics and MACD trending indicators.