WAC Update: Week 18
March 10, 2026Strongest Offensive Trends
- Abil Christian, Off Reb Pct, Down, Trend Strength: -0.039 – Abil Christian’s offense has struggled with rebounding percentages, a problem that contributes to difficulties in maintaining possession and creating scoring opportunities.
- Southern Utah, Shooting, Up, Trend Strength: 0.021 – Southern Utah’s shooting performance has been steadily improving, which has allowed them to capitalize on scoring opportunities and gain a significant advantage over their opponents in terms of overall effectiveness on the court.
- California Baptist, Shooting, Up, Trend Strength: 0.014 – California Baptist has seen a notable increase in shooting efficiency, which has contributed to their improved overall performance as they make a significant number of three-point shots and average more shots made per game compared to the same period last season.
- Abil Christian, Shooting, Down, Trend Strength: -0.012 – Abil Christian has struggled with their 3-point shooting in Week 18 of the WAC Conference.
- Utah Valley, Turnovers, Down, Trend Strength: -0.01 – Utah Valley’s improved efficiency on offense can be attributed to their reduced turnovers, contributing to their recent success in Week 18 of the WAC conference schedule.
Strongest Defensive Trends
- Tarleton, Opp Turnovers, Down, Trend Strength: -0.018 – Tarleton’s defense has been unable to effectively limit opponents’ possessions by forcing turnovers, a recurring issue in recent games that continues to hinder their overall performance.
- Tarleton, Opp Shooting, Down, Trend Strength: -0.013 – Tarleton’s defense is struggling against increasingly efficient opponents, making it harder for Tarleton’s defense to hold off them successfully.
- California Baptist, Opp Shooting, Down, Trend Strength: -0.013 – The defense of California Baptist struggles with opponents’ improved shooting, marking a stark contrast from their usual defensive capabilities.
- Utah Valley, Opp Shooting, Up, Trend Strength: 0.012 – Utah Valley’s opponents have struggled with shooting against them, as evidenced by Utah Valley: Opp Shooting, a trend where teams consistently struggle to find their rhythm.
- Utah Tech, Opp Turnovers, Down, Trend Strength: -0.012 – Utah Tech is experiencing difficulties forcing turnovers, which seems to be stifling opponents and creating a problem on the defensive side of the field.
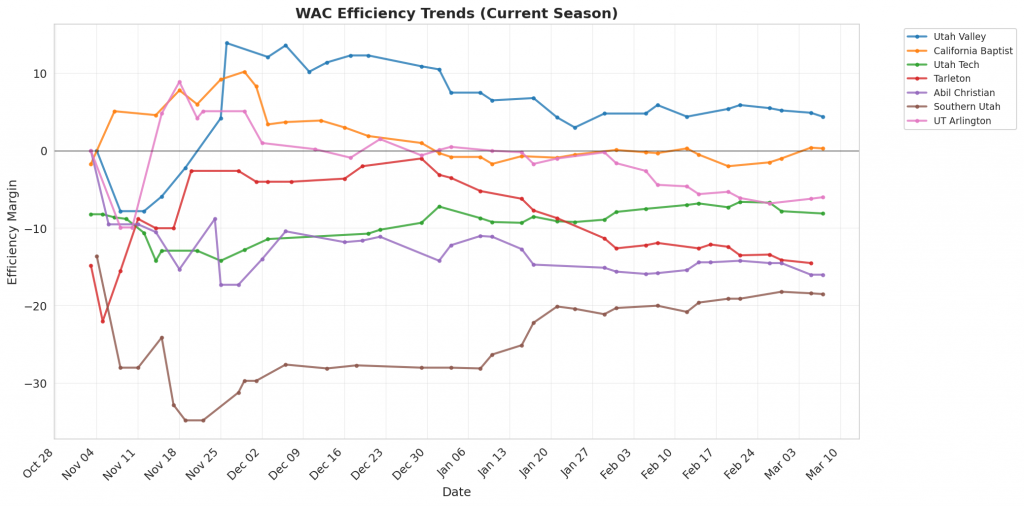
Figure 1: Efficiency margin trends for WAC teams throughout the season. Teams trending upward show improving performance, while downward trends indicate struggles.
Conference Snapshot
- Week Dates: March 02 – March 08, 2026
- Trending Up (Efficiency): Utah Valley, California Baptist, Utah Tech, Southern Utah
- Trending Down (Efficiency): Tarleton, Abil Christian, UT Arlington
Team-by-Team Analysis
Abil Christian
Record: 13-18 | Elo: 1436.8 (ranked 257 of 365) | Efficiency Margin: -15.98 (ranked 300 of 365)
Offensive Trends:
- Shooting (Shooting): Currently ranked 334 of 365 in D1. Trending down strongly 🔴.
- Off Reb Pct (Offensive Rebounding): Currently ranked 197 of 365 in D1. Trending down strongly 🔴.
Defensive Trends:
- Opp Shooting (Opp Shooting): Currently ranked 353 of 365 in D1. Trending up moderately 🔴.
- Def Reb Pct (Defensive Rebounding): Currently ranked 93 of 365 in D1. Trending up moderately 🟢.
California Baptist
Record: 23-8 | Elo: 1596.5 (ranked 75 of 365) | Efficiency Margin: +0.32 (ranked 156 of 365)
Offensive Trends:
- Shooting (Shooting): Currently ranked 300 of 365 in D1. Trending up strongly 🟢.
- Turnovers (Turnovers): Currently ranked 250 of 365 in D1. Trending down moderately 🟢.
Defensive Trends:
- Opp Shooting (Opp Shooting): Currently ranked 14 of 365 in D1. Trending down strongly 🟢.
- Opp Turnovers (Opp Turnovers): Currently ranked 145 of 365 in D1. Trending up moderately 🟢.
Southern Utah
Record: 10-21 | Elo: 1383.1 (ranked 315 of 365) | Efficiency Margin: -18.54 (ranked 319 of 365)
Offensive Trends:
- Shooting (Shooting): Currently ranked 184 of 365 in D1. Trending up strongly 🟢.
- Off Reb Pct (Offensive Rebounding): Currently ranked 234 of 365 in D1. Trending down moderately 🔴.
Defensive Trends:
- Opp Shooting (Opp Shooting): Currently ranked 283 of 365 in D1. Trending up moderately 🔴.
- Opp Turnovers (Opp Turnovers): Currently ranked 312 of 365 in D1. Trending down weakly 🔴.
Tarleton
Record: 14-17 | Elo: 1428.9 (ranked 266 of 365) | Efficiency Margin: -14.53 (ranked 291 of 365)
Offensive Trends:
- Shooting (Shooting): Currently ranked 306 of 365 in D1. Trending down moderately 🔴.
- Turnovers (Turnovers): Currently ranked 346 of 365 in D1. Trending down weakly 🟢.
Defensive Trends:
- Opp Shooting (Opp Shooting): Currently ranked 285 of 365 in D1. Trending down strongly 🟢.
- Opp Turnovers (Opp Turnovers): Currently ranked 3 of 365 in D1. Trending down strongly 🔴.
UT Arlington
Record: 17-13 | Elo: 1502.6 (ranked 185 of 365) | Efficiency Margin: -5.99 (ranked 222 of 365)
Offensive Trends:
- Shooting (Shooting): Currently ranked 314 of 365 in D1. Trending down strongly 🔴.
- Turnovers (Turnovers): Currently ranked 358 of 365 in D1. Trending down weakly 🟢.
Defensive Trends:
- Opp Shooting (Opp Shooting): Currently ranked 29 of 365 in D1. Trending down moderately 🟢.
- Opp Turnovers (Opp Turnovers): Currently ranked 105 of 365 in D1. Trending down weakly 🔴.
Utah Tech
Record: 17-14 | Elo: 1465.0 (ranked 231 of 365) | Efficiency Margin: -8.06 (ranked 235 of 365)
Offensive Trends:
- Shooting (Shooting): Currently ranked 112 of 365 in D1. Trending up moderately 🟢.
- Turnovers (Turnovers): Currently ranked 242 of 365 in D1. Trending down moderately 🟢.
Defensive Trends:
- Opp Turnovers (Opp Turnovers): Currently ranked 194 of 365 in D1. Trending down strongly 🔴.
- Opp Shooting (Opp Shooting): Currently ranked 134 of 365 in D1. Trending up weakly 🔴.
Utah Valley
Record: 24-7 | Elo: 1657.1 (ranked 45 of 365) | Efficiency Margin: +4.42 (ranked 118 of 365)
Offensive Trends:
- Turnovers (Turnovers): Currently ranked 351 of 365 in D1. Trending down strongly 🟢.
- Off Reb Pct (Offensive Rebounding): Currently ranked 52 of 365 in D1. Trending down moderately 🔴.
Defensive Trends:
- Opp Shooting (Opp Shooting): Currently ranked 77 of 365 in D1. Trending up strongly 🔴.
- Opp Turnovers (Opp Turnovers): Currently ranked 6 of 365 in D1. Trending up weakly 🟢.

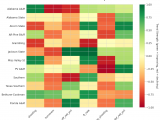
Figure 2: Offensive Four Factors comparison across WAC teams. The radar chart shows each team’s shooting efficiency (eFG%), ball security (TOV%), offensive rebounding (OREB%), and free throw generation (FT Rate).

Figure 3: Defensive Four Factors comparison across WAC teams. The radar chart shows each team’s opponent shooting defense (Opp eFG%), ball disruption (forcing TOV%), defensive rebounding (DREB%), and opponent free throw prevention (Opp FT Rate).
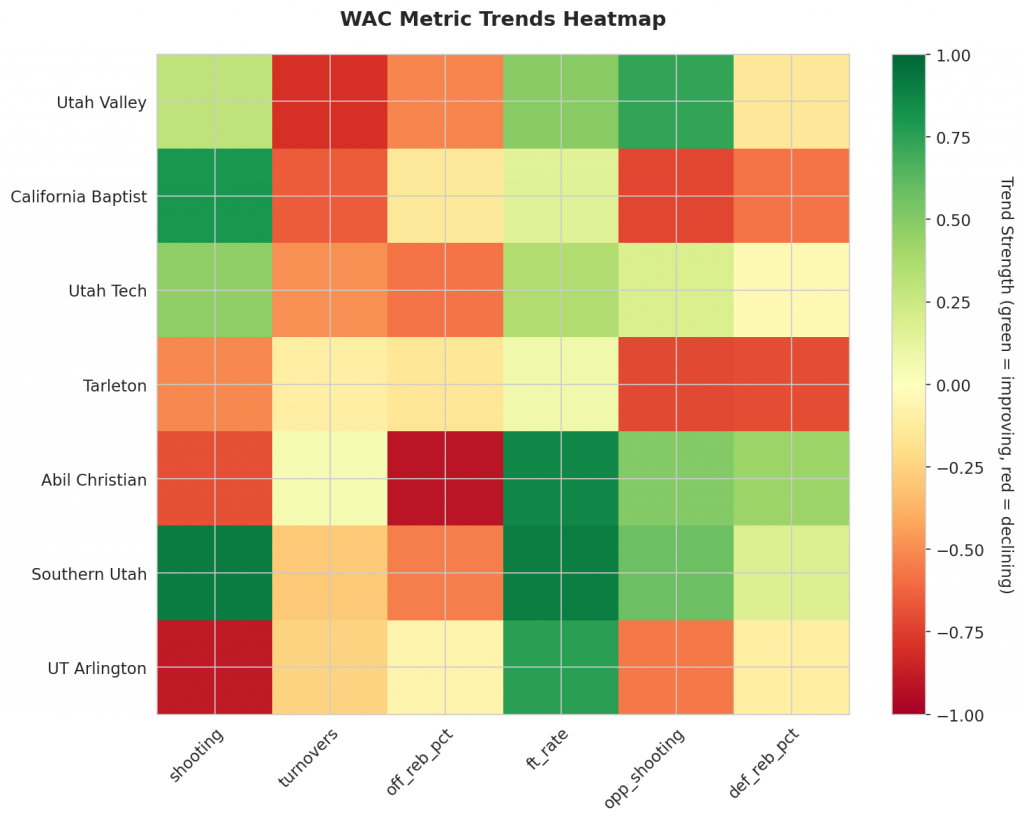
Figure 4: MACD trends heatmap showing which metrics are improving (green) or declining (red) for each team. Stronger colors indicate more pronounced trends.
Looking Ahead
WAC Teams’ Momentum and Improvement: A Data-Driven Analysis
As the Western Athletic Conference (WAC) season continues, we examine key offensive and defensive trends to identify which teams are genuinely improving.
Offensive Trends:
Utah Valley’s shooting percentage has increased, trending upward strongly with a season average of 0.49. California Baptist also shows an improvement in their shooting percentage, which is trending up at a strong rate.
Defensive Trends:
Unfortunately for Utah Valley, their opponents’ shooting percentage is increasing, indicating a decline in defensive prowess. In contrast, California Baptist’s defense has improved, with opponents’ shooting percentage trending downward strongly with a season average of 0.46. Tarleton’s defense also shows a problem as their opponents’ shooting percentage is increasing.
Additional Trends:
Utah Tech’s defense faces a challenge as their opponents have been forcing fewer turnovers against them.
Metrics Glossary
Four Factors (Dean Oliver’s framework for basketball success):
- eFG% (Effective Field Goal %): Field goal percentage adjusted for 3-pointers being worth more (FGM + 0.5×3PM) / FGA. Higher is better offensively, lower is better defensively.
- TOV% (Turnover Rate): Turnovers per 100 possessions. Lower is better offensively (taking care of the ball), higher is better defensively (forcing turnovers).
- OREB% / DREB% (Offensive/Defensive Rebound Rate): Percentage of available rebounds grabbed. Offensive rebounds create second-chance points; defensive rebounds end opponent possessions.
- FTR (Free Throw Rate): Free throws made per field goal attempt (FTM/FGA). Measures ability to get to the line AND convert. Higher is better offensively, lower is better defensively.
Other Metrics:
- Elo Rating: Chess-style rating system that updates based on game results and opponent strength. Higher Elo indicates stronger team.
- Efficiency Margin: Point differential per 100 possessions (Offensive Efficiency – Defensive Efficiency). Accounts for pace of play.
- MACD (Moving Average Convergence Divergence): Trend indicator comparing 12-game and 26-game exponential moving averages. Positive MACD = improving trend, Negative MACD = declining trend.
Analysis powered by HoopSci’s advanced metrics and MACD trending indicators.