America East Update: Week 1
November 9, 2026Strongest Offensive Trends
- Albany, Off Reb Pct, Up, Trend Strength: 0.045 – Albany has shown a marked improvement in its ability to secure rebounds offensively, a development that contributes to sustained possession advantages throughout the game.
- UNH, Off Reb Pct, Down, Trend Strength: -0.019 – As UNH navigates its early-season schedule, a troubling decline in off-the-glass rebounding stands out as a significant liability that is hindering their overall presence inside the paint.
- UMass Lowell, Turnovers, Down, Trend Strength: -0.016 – The reduction in turnovers by UMass Lowell serves as a clear indicator of sharpened ball security, directly contributing to improved offensive consistency throughout this early season stretch.
- Maine, Off Reb Pct, Down, Trend Strength: -0.015 – Maine’s Off Reb Pct is trending down, a worsening trend.
- Albany, Turnovers, Up, Trend Strength: 0.011 – As Albany struggles with turnovers, inconsistent ball security is hindering their ability to maintain possession and execute their game plan this early in the season.
Strongest Defensive Trends
- Maine, Def Reb Pct, Up, Trend Strength: 0.021 – Maine is successfully converting a greater share of their defensive rebounding opportunities, demonstrating a clear improvement in controlling the glass to limit opponent possessions.
- Binghamton, Def Reb Pct, Down, Trend Strength: -0.018 – Binghamton is grappling with a troubling drop in defensive rebounding, a struggle that allows opponents to gather extra loose balls and generate further offensive chances during this season.
- UNH, Opp Shooting, Down, Trend Strength: -0.018 – UNH’s defensive scheme has emerged as a significant strength, effectively stifling opponents and limiting their scoring opportunities throughout the season.
- UMBC, Def Reb Pct, Down, Trend Strength: -0.016 – UMBC faces a troubling decline in defensive rebounding that leaves opponents with too many second-chance opportunities, directly undermining the Retrieving team’s ability to shut out easy points and maintain control of the glass throughout this season’s games.
- Maine, Opp Turnovers, Down, Trend Strength: -0.013 – Maine’s Opp Turnovers is trending down, a worsening trend (forcing fewer turnovers).
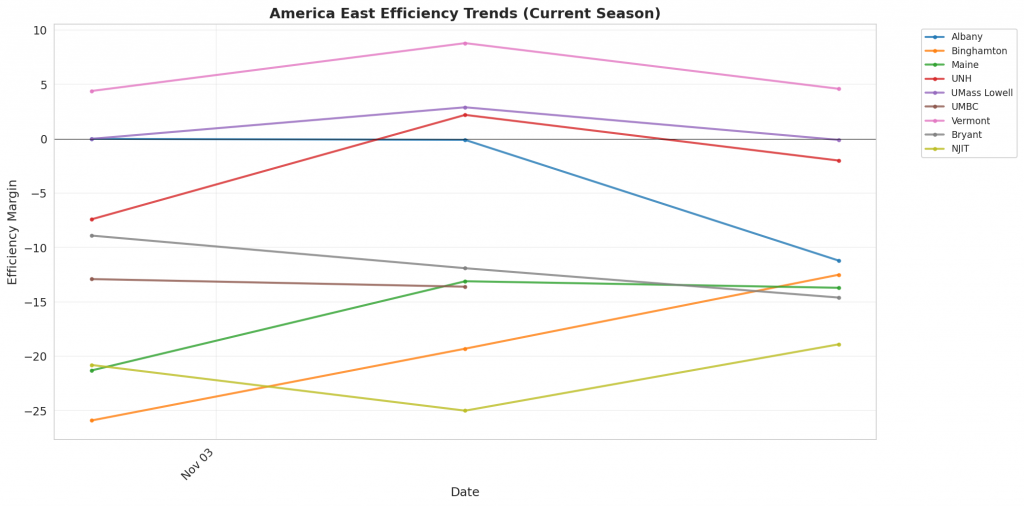
Figure 1: Efficiency margin trends for America East teams throughout the season. Teams trending upward show improving performance, while downward trends indicate struggles.
Conference Snapshot
- Week Dates: November 02 – November 08, 2026
- Trending Up (Efficiency): Binghamton, UNH, Vermont
- Trending Down (Efficiency): Albany, Maine, UMass Lowell, UMBC, Bryant
Team-by-Team Analysis
Albany
Record: 2-1 | Elo: 1424.6 (ranked 300 of 365) | Efficiency Margin: -11.15 (ranked 239 of 365)
Offensive Trends:
- Turnovers (Turnovers): Currently ranked 315 of 365 in D1. Trending up strongly 🔴.
- Off Reb Pct (Offensive Rebounding): Currently ranked 37 of 365 in D1. Trending up strongly 🟢.
Defensive Trends:
- Opp Shooting (Opp Shooting): Currently ranked 252 of 365 in D1. Trending down weakly 🟢.
- Opp Turnovers (Opp Turnovers): Currently ranked 153 of 365 in D1. Trending up weakly 🟢.
Binghamton
Record: 2-1 | Elo: 1396.5 (ranked 330 of 365) | Efficiency Margin: -12.47 (ranked 249 of 365)
Offensive Trends:
- Shooting (Shooting): Currently ranked 275 of 365 in D1. Trending up moderately 🟢.
- Turnovers (Turnovers): Currently ranked 140 of 365 in D1. Trending down moderately 🟢.
Defensive Trends:
- Def Reb Pct (Defensive Rebounding): Currently ranked 273 of 365 in D1. Trending down strongly 🔴.
- Opp Shooting (Opp Shooting): Currently ranked 187 of 365 in D1. Trending down moderately 🟢.
Bryant
Record: 1-2 | Elo: 1431.0 (ranked 292 of 365) | Efficiency Margin: -14.61 (ranked 276 of 365)
Offensive Trends:
- Turnovers (Turnovers): Currently ranked 326 of 365 in D1. Trending up strongly 🔴.
- Off Reb Pct (Offensive Rebounding): Currently ranked 213 of 365 in D1. Trending down strongly 🔴.
Defensive Trends:
- Opp Shooting (Opp Shooting): Currently ranked 88 of 365 in D1. Trending down weakly 🟢.
- Opp Turnovers (Opp Turnovers): Currently ranked 169 of 365 in D1. Trending up weakly 🟢.
Maine
Record: 1-2 | Elo: 1407.7 (ranked 318 of 365) | Efficiency Margin: -13.67 (ranked 264 of 365)
Offensive Trends:
- Off Reb Pct (Offensive Rebounding): Currently ranked 358 of 365 in D1. Trending down strongly 🔴.
- Turnovers (Turnovers): Currently ranked 332 of 365 in D1. Trending up moderately 🔴.
Defensive Trends:
- Opp Turnovers (Opp Turnovers): Currently ranked 341 of 365 in D1. Trending down strongly 🔴.
- Def Reb Pct (Defensive Rebounding): Currently ranked 196 of 365 in D1. Trending up strongly 🟢.
NJIT
Record: 1-2 | Elo: 1432.6 (ranked 287 of 365) | Efficiency Margin: -18.92 (ranked 305 of 365)
Offensive Trends:
- Shooting (Shooting): Currently ranked 337 of 365 in D1. Trending down strongly 🔴.
- Off Reb Pct (Offensive Rebounding): Currently ranked 325 of 365 in D1. Trending down strongly 🔴.
Defensive Trends:
- Opp Turnovers (Opp Turnovers): Currently ranked 60 of 365 in D1. Trending up strongly 🟢.
- Def Reb Pct (Defensive Rebounding): Currently ranked 352 of 365 in D1. Trending down strongly 🔴.
UMBC
Record: 0-2 | Elo: 1513.0 (ranked 163 of 365) | Efficiency Margin: -13.61 (ranked 262 of 365)
Offensive Trends:
- Shooting (Shooting): Currently ranked 304 of 365 in D1. Trending down moderately 🔴.
- Turnovers (Turnovers): Currently ranked 218 of 365 in D1. Trending up moderately 🔴.
Defensive Trends:
- Def Reb Pct (Defensive Rebounding): Currently ranked 244 of 365 in D1. Trending down strongly 🔴.
- Opp Shooting (Opp Shooting): Currently ranked 165 of 365 in D1. Trending down weakly 🟢.
UMass Lowell
Record: 3-0 | Elo: 1494.8 (ranked 196 of 365) | Efficiency Margin: -0.08 (ranked 163 of 365)
Offensive Trends:
- Turnovers (Turnovers): Currently ranked 27 of 365 in D1. Trending down strongly 🟢.
- Off Reb Pct (Offensive Rebounding): Currently ranked 172 of 365 in D1. Trending up strongly 🟢.
Defensive Trends:
- Def Reb Pct (Defensive Rebounding): Currently ranked 7 of 365 in D1. Trending up moderately 🟢.
- Opp Shooting (Opp Shooting): Currently ranked 132 of 365 in D1. Trending down weakly 🟢.
UNH
Record: 2-1 | Elo: 1399.2 (ranked 325 of 365) | Efficiency Margin: -2.00 (ranked 172 of 365)
Offensive Trends:
- Off Reb Pct (Offensive Rebounding): Currently ranked 344 of 365 in D1. Trending down strongly 🔴.
- Shooting (Shooting): Currently ranked 264 of 365 in D1. Trending up weakly 🟢.
Defensive Trends:
- Opp Shooting (Opp Shooting): Currently ranked 20 of 365 in D1. Trending down strongly 🟢.
- Opp Turnovers (Opp Turnovers): Currently ranked 122 of 365 in D1. Trending up moderately 🟢.
Vermont
Record: 1-2 | Elo: 1548.8 (ranked 102 of 365) | Efficiency Margin: +4.63 (ranked 128 of 365)
Offensive Trends:
- Off Reb Pct (Offensive Rebounding): Currently ranked 67 of 365 in D1. Trending up strongly 🟢.
- Turnovers (Turnovers): Currently ranked 233 of 365 in D1. Trending up moderately 🔴.
Defensive Trends:
- Def Reb Pct (Defensive Rebounding): Currently ranked 126 of 365 in D1. Trending down strongly 🔴.
- Opp Shooting (Opp Shooting): Currently ranked 90 of 365 in D1. Trending down moderately 🟢.
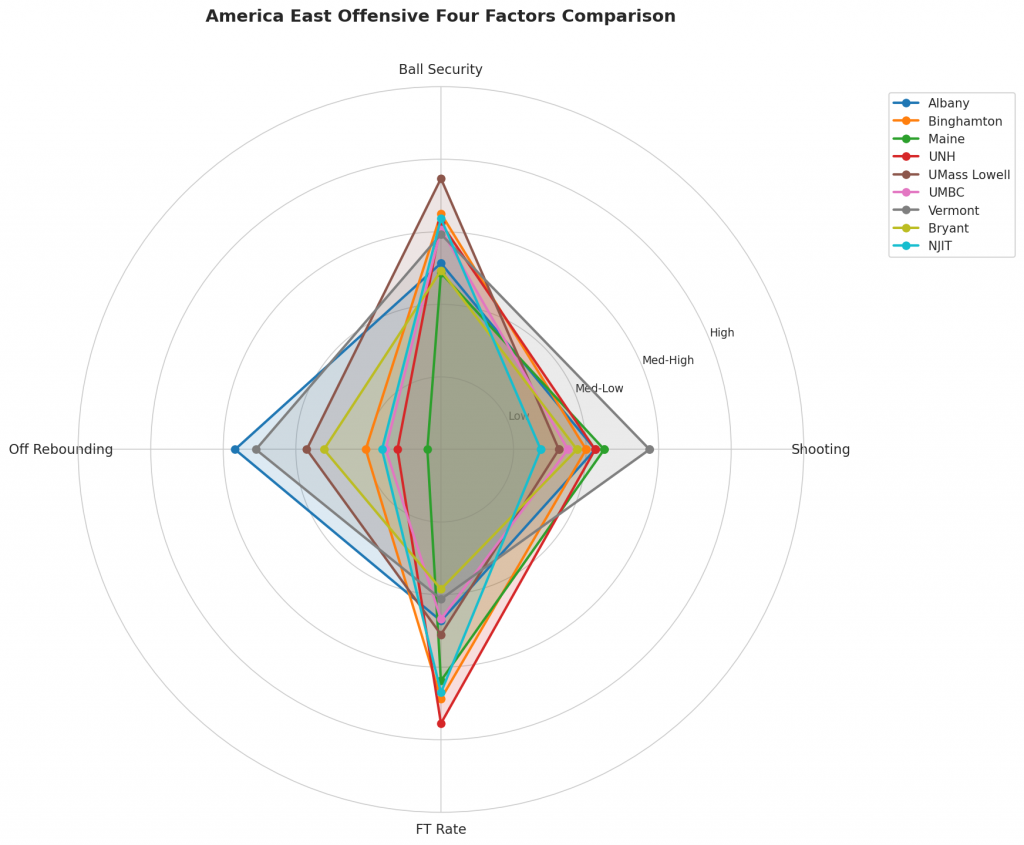
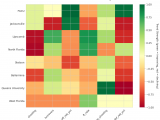
Figure 2: Offensive Four Factors comparison across America East teams. The radar chart shows each team’s shooting efficiency (eFG%), ball security (TOV%), offensive rebounding (OREB%), and free throw generation (FT Rate).
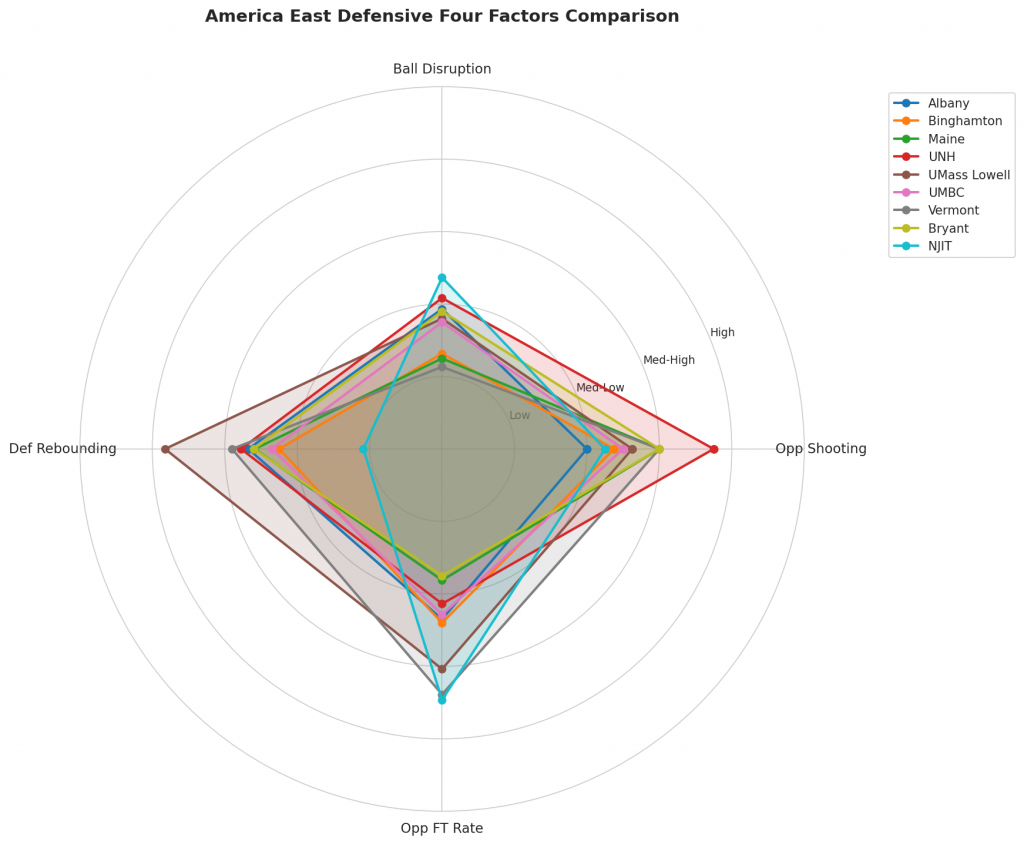
Figure 3: Defensive Four Factors comparison across America East teams. The radar chart shows each team’s opponent shooting defense (Opp eFG%), ball disruption (forcing TOV%), defensive rebounding (DREB%), and opponent free throw prevention (Opp FT Rate).
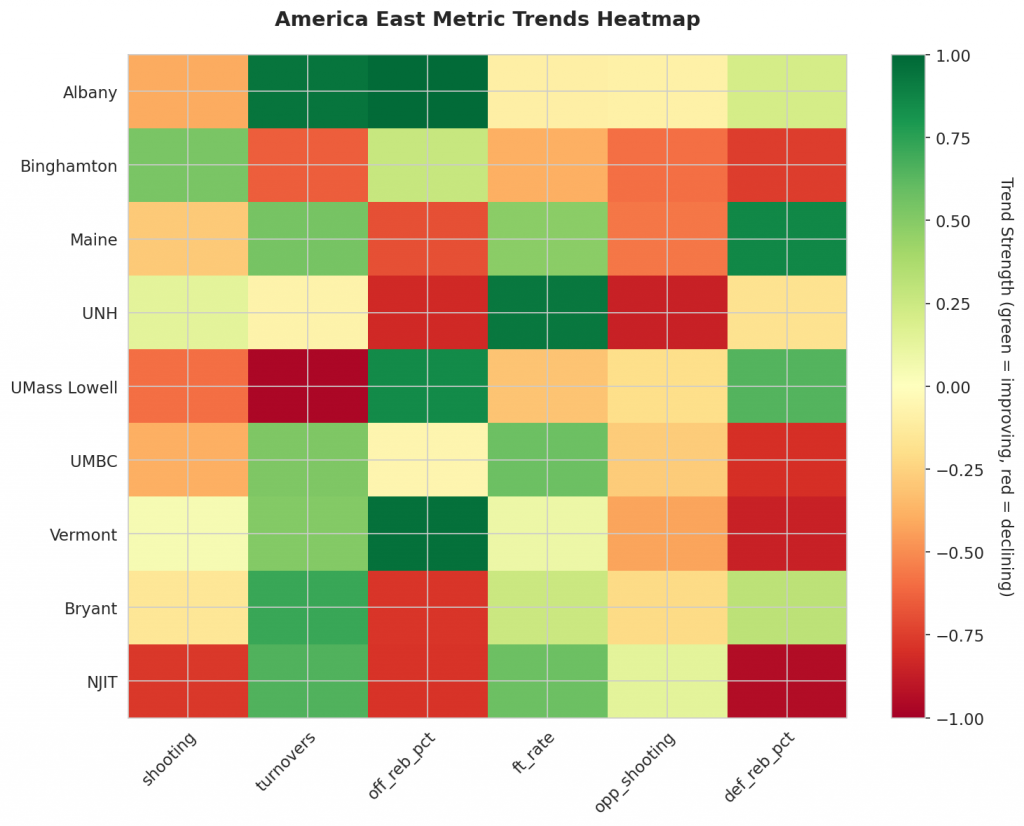
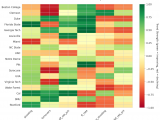
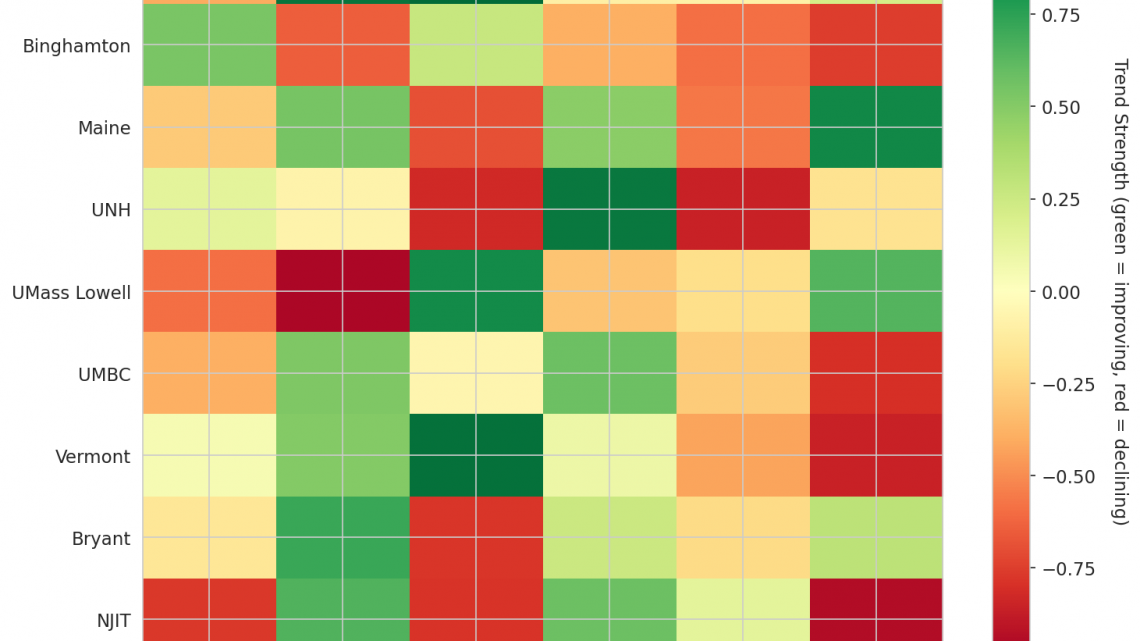
Figure 4: MACD trends heatmap showing which metrics are improving (green) or declining (red) for each team. Stronger colors indicate more pronounced trends.
Looking Ahead
Distinguishing between genuine team improvement and transient momentum is critical for evaluating early-season health. By utilizing MACD trending indicators—which quantify the magnitude of change over time—we can filter out noise and identify which programs are building sustainable advantages versus those experiencing volatile fluctuations. The following analysis covers trends across key offensive, defensive, and turnover metrics for available data on UMass Lowell, UMBC, Vermont, Bryant, and NJIT, alongside the primary focus teams.
Offensive Efficiency and Turnover Trends
A significant area of focus is how teams manage their possessions. While turnovers often fluctuate wildly early in a season, the MACD indicator helps determine if these fluctuations represent a real shift in player execution or random variance. For Albany, there are contrasting signals across different offensive categories. The data indicates a strongly upward trend in season turnovers for Albany. Since this metric treats turnovers as a negative value where higher is worse, a strong upward trend signifies a worrisome decline in ball security. Conversely, Albany shows a strongly upward trend in offensive rebound percentage. Because higher rebounding is desirable, this same direction indicates meaningful improvement in their ability to get second-chance points.
In contrast, Maine and the University of New Hampshire (UNH) are facing challenges on the glass. Both teams display a strongly downward trend in offensive rebound percentage. Given that a lower value is detrimental here, these strong down trends confirm worsening performance in securing extra possessions off the opponent’s misses: Maine at 0.165 and UNH at 0.198. This divergence highlights how specific MACD trends can isolate both strengths and weaknesses within the same statistical domain for different teams.
Defensive Stability and Opponent Suppression
Defensive metrics offer further clarity on team trajectory, particularly regarding shot prevention and defensive board control. Maine presents a mixed but volatile picture in their defense. While the team shows improvement in one area—a strongly upward trend in defensive rebound percentage indicates they are grabbing more defensive boards at 0.707—they simultaneously show a strongly downward trend in forced opponent turnovers. Because forcing turnovers is a positive outcome for the defender, a downward trend here reflects a worsening ability to disrupt opponent ball handling, suggesting a decline in their defensive pressure or scheme effectiveness.
UNH demonstrates clear defensive resilience regarding shot prevention. The MACD indicator shows a strongly downward trend in opponent shooting percentage at 0.4. Since allowing opponents to shoot well is undesirable, this decreasing trend translates directly to an improvement, indicating the team is effectively limiting the quality of shots they surrender. However, Binghamton requires monitoring on the defensive boards. A strongly downward trend in their defensive rebound percentage signals that they are allowing more offensive boards against them, specifically at 0.68. In a metric where possession retention is key, letting opponents grab second chances constitutes a worsening performance trend.
Metrics Glossary
Four Factors (Dean Oliver’s framework for basketball success):
- eFG% (Effective Field Goal %): Field goal percentage adjusted for 3-pointers being worth more (FGM + 0.5×3PM) / FGA. Higher is better offensively, lower is better defensively.
- TOV% (Turnover Rate): Turnovers per 100 possessions. Lower is better offensively (taking care of the ball), higher is better defensively (forcing turnovers).
- OREB% / DREB% (Offensive/Defensive Rebound Rate): Percentage of available rebounds grabbed. Offensive rebounds create second-chance points; defensive rebounds end opponent possessions.
- FTR (Free Throw Rate): Free throws made per field goal attempt (FTM/FGA). Measures ability to get to the line AND convert. Higher is better offensively, lower is better defensively.
Other Metrics:
- Elo Rating: Chess-style rating system that updates based on game results and opponent strength. Higher Elo indicates stronger team.
- Efficiency Margin: Point differential per 100 possessions (Offensive Efficiency – Defensive Efficiency). Accounts for pace of play.
- MACD (Moving Average Convergence Divergence): Trend indicator comparing 12-game and 26-game exponential moving averages. Positive MACD = improving trend, Negative MACD = declining trend.
Analysis powered by HoopSci’s advanced metrics and MACD trending indicators.