Big West Update: Week 1
November 9, 2026Strongest Offensive Trends
- UC Irvine, Off Reb Pct, Up, Trend Strength: 0.061 – The uptick in percentage of points earned on offense rebounds at UC Irvine signals an encouraging shift as the team capitalizes more effectively on second-chance opportunities following a missed field goal attempt.
- Long Beach St, Off Reb Pct, Down, Trend Strength: -0.04 – The Long Beach State offense is increasingly struggling with rebounding, a growing issue that hinders their ability to secure possession.
- Cal Poly, Off Reb Pct, Up, Trend Strength: 0.035 – As Cal Poly shows marked improvement in winning rebounding battles, that extra possession serves as a direct catalyst for sustained offensive production throughout the season.
- CSU Fullerton, Off Reb Pct, Down, Trend Strength: -0.019 – As CSU Fullerton enters week one of the season, a troubling downward trend in their ability to win backboards signals early struggles that could hinder their overall performance on the court.
- CSU Northridge, Shooting, Down, Trend Strength: -0.015 – The team’s shooting ability is declining, which is negatively impacting their overall offensive performance.
Strongest Defensive Trends
- UC Irvine, Opp Shooting, Up, Trend Strength: 0.024 – UC Irvine faces an escalating concern as its defense allows opponents to increase their offensive efficiency throughout the season.
- UCSB, Def Reb Pct, Up, Trend Strength: 0.019 – UCSB’s defense has shown resilience by grabbing more rebounds on their own end, a sign that they are better at ending opponents’ possessions than in earlier contests.
- UC Irvine, Def Reb Pct, Up, Trend Strength: 0.019 – UC Irvine is demonstrating positive momentum by securing a growing portion of available defensive rebounds to limit second-chance opportunities for opponents.
- CSU Fullerton, Opp Shooting, Down, Trend Strength: -0.016 – As CSU Fullerton demonstrates an upward trajectory in opponent shooting metrics, the team appears to be gaining control over defensive intensity by limiting how effectively opposing squads can convert shots during this early portion of the season.
- UCSB, Opp Turnovers, Down, Trend Strength: -0.009 – UCSB is struggling as its inability to force opponent turnovers has deteriorated, signaling a troubling decline in defensive disruption early in the season.
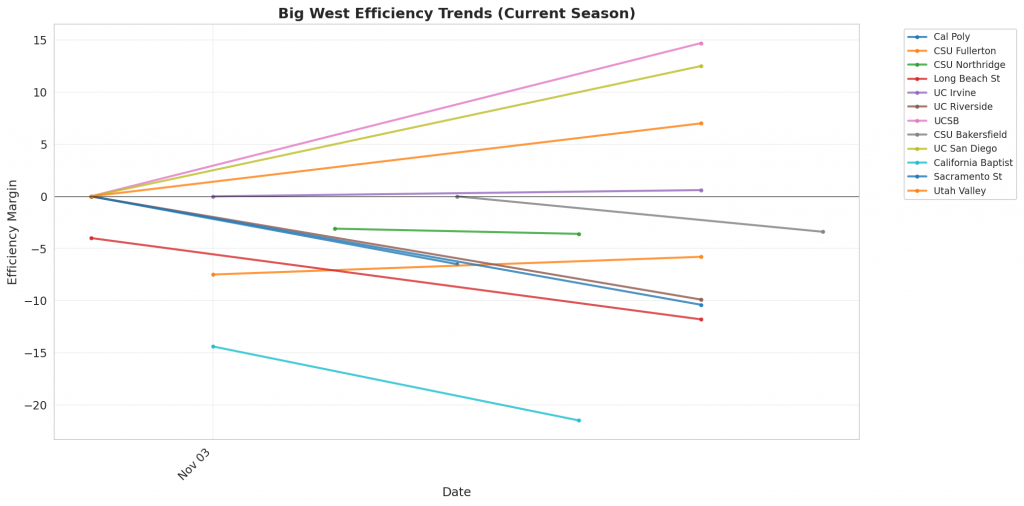
Figure 1: Efficiency margin trends for Big West teams throughout the season. Teams trending upward show improving performance, while downward trends indicate struggles.
Conference Snapshot
- Week Dates: November 02 – November 08, 2026
- Trending Up (Efficiency): Long Beach St, UC Irvine, UCSB, CSU Bakersfield, Utah Valley
- Trending Down (Efficiency): Cal Poly, CSU Fullerton, CSU Northridge, UC Riverside, UC San Diego
Team-by-Team Analysis
CSU Bakersfield
Record: 2-0 | Elo: 1378.4 (ranked 345 of 365) | Efficiency Margin: -3.43 (ranked 179 of 365)
Offensive Trends:
- Shooting (Shooting): Currently ranked 81 of 365 in D1. Trending up strongly 🟢.
- Off Reb Pct (Offensive Rebounding): Currently ranked 259 of 365 in D1. Trending up strongly 🟢.
Defensive Trends:
- Opp Shooting (Opp Shooting): Currently ranked 265 of 365 in D1. Trending up moderately 🔴.
- Opp Turnovers (Opp Turnovers): Currently ranked 239 of 365 in D1. Trending down moderately 🔴.
CSU Fullerton
Record: 1-1 | Elo: 1486.5 (ranked 213 of 365) | Efficiency Margin: -5.80 (ranked 197 of 365)
Offensive Trends:
- Off Reb Pct (Offensive Rebounding): Currently ranked 347 of 365 in D1. Trending down strongly 🔴.
- Turnovers (Turnovers): Currently ranked 58 of 365 in D1. Trending down moderately 🟢.
Defensive Trends:
- Opp Shooting (Opp Shooting): Currently ranked 225 of 365 in D1. Trending down strongly 🟢.
- Opp Turnovers (Opp Turnovers): Currently ranked 76 of 365 in D1. Trending up moderately 🟢.
CSU Northridge
Record: 0-2 | Elo: 1519.7 (ranked 151 of 365) | Efficiency Margin: -3.60 (ranked 181 of 365)
Offensive Trends:
- Shooting (Shooting): Currently ranked 326 of 365 in D1. Trending down strongly 🔴.
- Off Reb Pct (Offensive Rebounding): Currently ranked 204 of 365 in D1. Trending down moderately 🔴.
Defensive Trends:
- Opp Shooting (Opp Shooting): Currently ranked 227 of 365 in D1. Trending up moderately 🔴.
- Opp Turnovers (Opp Turnovers): Currently ranked 328 of 365 in D1. Trending down moderately 🔴.
Cal Poly
Record: 1-1 | Elo: 1456.8 (ranked 253 of 365) | Efficiency Margin: -6.47 (ranked 203 of 365)
Offensive Trends:
- Off Reb Pct (Offensive Rebounding): Currently ranked 228 of 365 in D1. Trending up strongly 🟢.
- Shooting (Shooting): Currently ranked 126 of 365 in D1. Trending down weakly 🔴.
Defensive Trends:
- Opp Shooting (Opp Shooting): Currently ranked 293 of 365 in D1. Trending down weakly 🟢.
- Opp Turnovers (Opp Turnovers): Currently ranked 217 of 365 in D1. Trending down weakly 🔴.
California Baptist
Record: 0-2 | Elo: 1556.3 (ranked 93 of 365) | Efficiency Margin: -21.53 (ranked 323 of 365)
Offensive Trends:
- Off Reb Pct (Offensive Rebounding): Currently ranked 291 of 365 in D1. Trending down strongly 🔴.
- Turnovers (Turnovers): Currently ranked 199 of 365 in D1. Trending down moderately 🟢.
Defensive Trends:
- Opp Shooting (Opp Shooting): Currently ranked 329 of 365 in D1. Trending up strongly 🔴.
- Def Reb Pct (Defensive Rebounding): Currently ranked 271 of 365 in D1. Trending down strongly 🔴.
Long Beach St
Record: 0-2 | Elo: 1385.3 (ranked 343 of 365) | Efficiency Margin: -11.82 (ranked 243 of 365)
Offensive Trends:
- Off Reb Pct (Offensive Rebounding): Currently ranked 362 of 365 in D1. Trending down strongly 🔴.
- Shooting (Shooting): Currently ranked 193 of 365 in D1. Trending up moderately 🟢.
Defensive Trends:
- Opp Shooting (Opp Shooting): Currently ranked 328 of 365 in D1. Trending up weakly 🔴.
- Opp Turnovers (Opp Turnovers): Currently ranked 88 of 365 in D1. Trending up weakly 🟢.
Sacramento St
Record: 1-1 | Elo: 1361.8 (ranked 356 of 365) | Efficiency Margin: -10.36 (ranked 237 of 365)
Offensive Trends:
- Shooting (Shooting): Currently ranked 260 of 365 in D1. Trending down moderately 🔴.
- Off Reb Pct (Offensive Rebounding): Currently ranked 341 of 365 in D1. Trending up moderately 🟢.
Defensive Trends:
- Opp Shooting (Opp Shooting): Currently ranked 188 of 365 in D1. Trending down strongly 🟢.
- Opp Turnovers (Opp Turnovers): Currently ranked 163 of 365 in D1. Trending up weakly 🟢.
UC Irvine
Record: 2-0 | Elo: 1599.4 (ranked 56 of 365) | Efficiency Margin: +0.57 (ranked 147 of 365)
Offensive Trends:
- Off Reb Pct (Offensive Rebounding): Currently ranked 20 of 365 in D1. Trending up strongly 🟢.
- Shooting (Shooting): Currently ranked 135 of 365 in D1. Trending up moderately 🟢.
Defensive Trends:
- Opp Shooting (Opp Shooting): Currently ranked 183 of 365 in D1. Trending up strongly 🔴.
- Def Reb Pct (Defensive Rebounding): Currently ranked 31 of 365 in D1. Trending up strongly 🟢.
UC Riverside
Record: 2-0 | Elo: 1451.8 (ranked 265 of 365) | Efficiency Margin: -9.90 (ranked 228 of 365)
Offensive Trends:
- Turnovers (Turnovers): Currently ranked 70 of 365 in D1. Trending down strongly 🟢.
- Off Reb Pct (Offensive Rebounding): Currently ranked 283 of 365 in D1. Trending up strongly 🟢.
Defensive Trends:
- Opp Shooting (Opp Shooting): Currently ranked 130 of 365 in D1. Trending down moderately 🟢.
- Opp Turnovers (Opp Turnovers): Currently ranked 84 of 365 in D1. Trending up moderately 🟢.
UC San Diego
Record: 2-0 | Elo: 1589.9 (ranked 63 of 365) | Efficiency Margin: +12.53 (ranked 90 of 365)
Offensive Trends:
- Turnovers (Turnovers): Currently ranked 37 of 365 in D1. Trending down moderately 🟢.
- Off Reb Pct (Offensive Rebounding): Currently ranked 239 of 365 in D1. Trending up moderately 🟢.
Defensive Trends:
- Opp Shooting (Opp Shooting): Currently ranked 95 of 365 in D1. Trending up weakly 🔴.
- Opp Turnovers (Opp Turnovers): Currently ranked 128 of 365 in D1. Trending up weakly 🟢.
UCSB
Record: 2-0 | Elo: 1515.0 (ranked 157 of 365) | Efficiency Margin: +14.66 (ranked 76 of 365)
Offensive Trends:
- Off Reb Pct (Offensive Rebounding): Currently ranked 165 of 365 in D1. Trending up strongly 🟢.
- Shooting (Shooting): Currently ranked 26 of 365 in D1. Trending up weakly 🟢.
Defensive Trends:
- Opp Turnovers (Opp Turnovers): Currently ranked 161 of 365 in D1. Trending down strongly 🔴.
- Def Reb Pct (Defensive Rebounding): Currently ranked 3 of 365 in D1. Trending up strongly 🟢.
Utah Valley
Record: 2-0 | Elo: 1611.6 (ranked 48 of 365) | Efficiency Margin: +7.01 (ranked 113 of 365)
Offensive Trends:
- Shooting (Shooting): Currently ranked 12 of 365 in D1. Trending up moderately 🟢.
- Off Reb Pct (Offensive Rebounding): Currently ranked 315 of 365 in D1. Trending up moderately 🟢.
Defensive Trends:
- Opp Shooting (Opp Shooting): Currently ranked 235 of 365 in D1. Trending up strongly 🔴.
- Opp Turnovers (Opp Turnovers): Currently ranked 98 of 365 in D1. Trending down moderately 🔴.
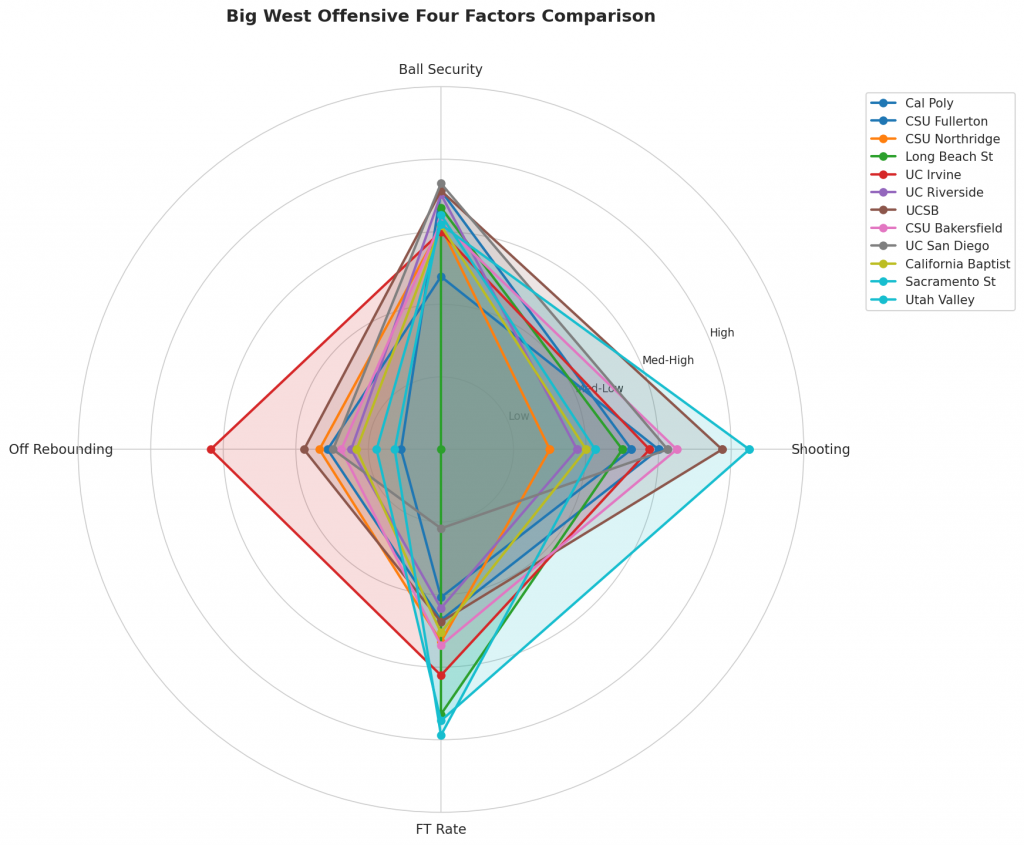
Figure 2: Offensive Four Factors comparison across Big West teams. The radar chart shows each team’s shooting efficiency (eFG%), ball security (TOV%), offensive rebounding (OREB%), and free throw generation (FT Rate).
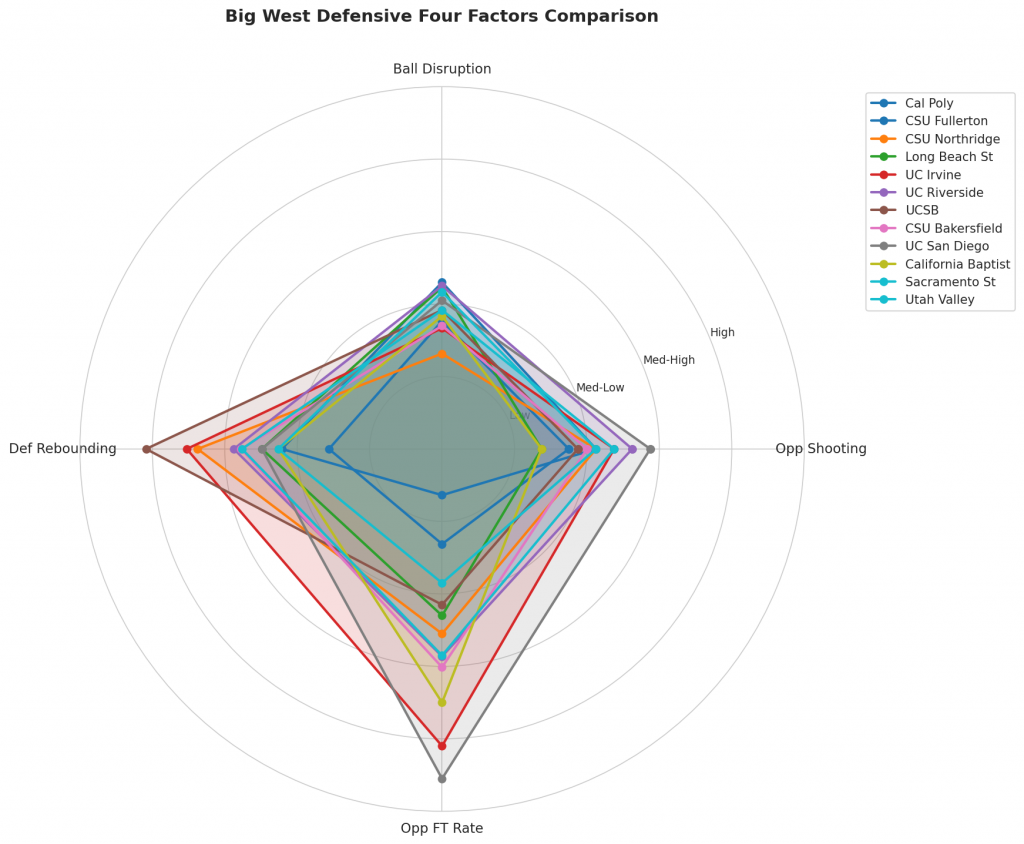
Figure 3: Defensive Four Factors comparison across Big West teams. The radar chart shows each team’s opponent shooting defense (Opp eFG%), ball disruption (forcing TOV%), defensive rebounding (DREB%), and opponent free throw prevention (Opp FT Rate).
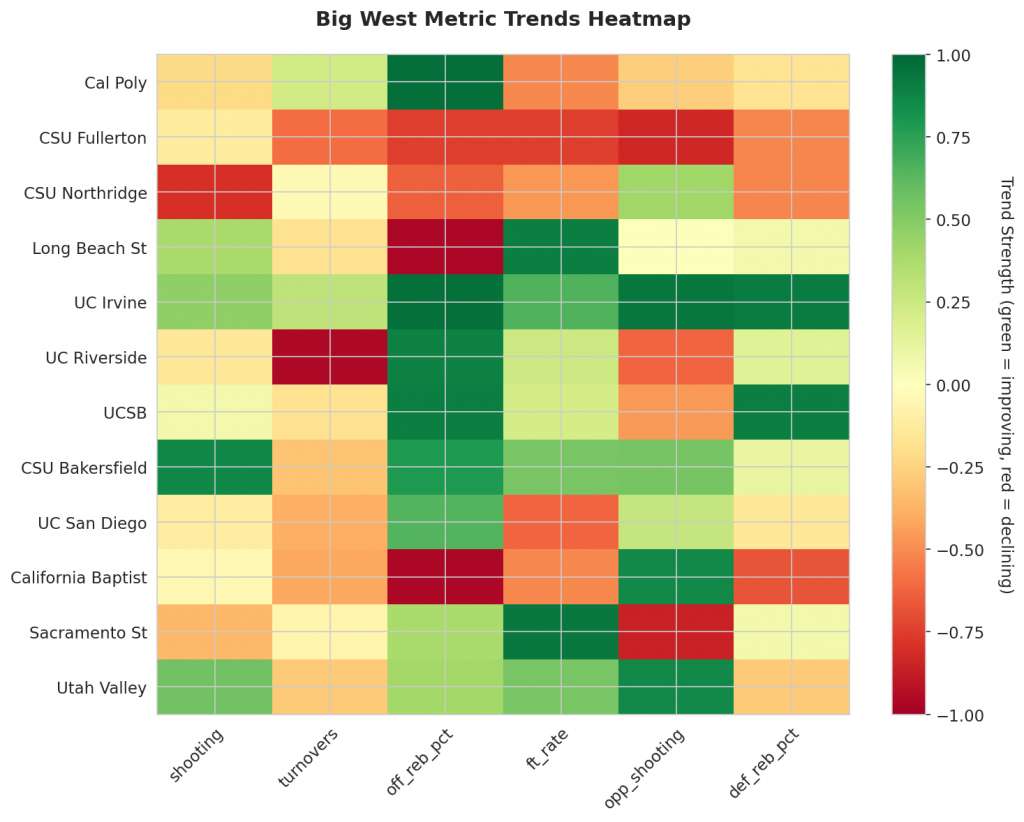
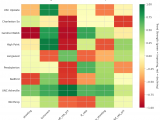
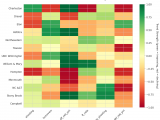
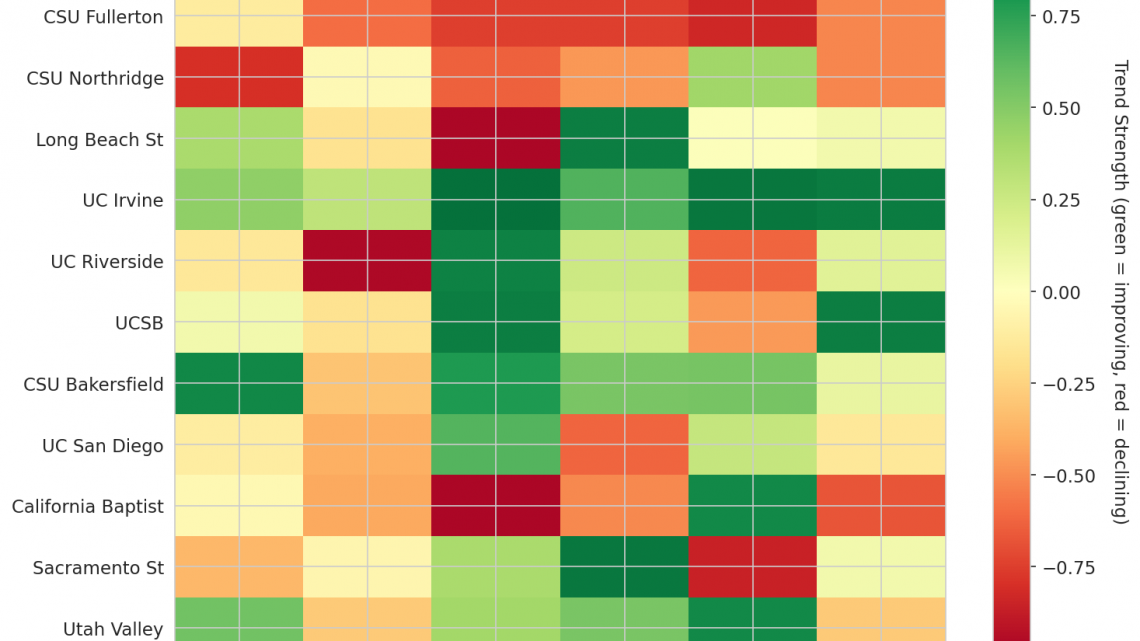
Figure 4: MACD trends heatmap showing which metrics are improving (green) or declining (red) for each team. Stronger colors indicate more pronounced trends.
Looking Ahead
MACD momentum indicators reveal which squads are building genuine trajectory versus those riding unsustainable trends through their early-season games. Cal Poly demonstrates clear promise with a strong upward trend in offensive rebounding percentage, currently sitting at 0.275. This suggests a value that is increasing as the Matadors consistently improve their ability to get second-chance points. Conversely, other teams are displaying signs of regression or inconsistency; CSU Fullerton has seen a strong downward trend in their offensive rebounding percentage, with a season average of approximately 0.194, indicating a worsening efficiency in securing the glass after misses. Similarly, Long Beach St is facing challenges as they exhibit a strong downward trend in this specific metric, currently averaging just 0.15 per game. Additionally, shooting percentages across the league are showing variance; CSU Northridge presents a notable concern with a strong downward trend in their overall shooting performance, currently holding a season average of 0.42.
On the defensive end, the data reveals a mixed picture regarding how teams handle opposing offenses and secure their own boards. CSU Fullerton stands out as a positive story among the defenses, displaying a strong downward trend in opponent shooting percentage. Since a lower opponent shooting percentage is beneficial for defense, this metric indicates they are effectively limiting opponents from making shots, representing an area of improvement. UC Irvine presents a complex dual-trend scenario. While the Anteaters are showing a strong upward trend in defensive rebounding percentage—currently averaging 0.782, which signifies an improvement in grabbing their own boards—they are simultaneously suffering a decline in other areas. Their opponent shooting percentage is trending strongly up, meaning they are allowing opponents to shoot more frequently, which represents a worsening of their defensive metrics. Furthermore, UCSB has encountered difficulties forcing turnovers; the Gauchos show a strong downward trend in opponent turnovers forced, currently averaging 0.165 per game. This indicates a degradation in their ability to disrupt the flow of opposing offenses. These foundational layers for evaluating team health highlight which programs have built resilient systems versus those struggling with early-season volatility in key statistical categories.
Metrics Glossary
Four Factors (Dean Oliver’s framework for basketball success):
- eFG% (Effective Field Goal %): Field goal percentage adjusted for 3-pointers being worth more (FGM + 0.5×3PM) / FGA. Higher is better offensively, lower is better defensively.
- TOV% (Turnover Rate): Turnovers per 100 possessions. Lower is better offensively (taking care of the ball), higher is better defensively (forcing turnovers).
- OREB% / DREB% (Offensive/Defensive Rebound Rate): Percentage of available rebounds grabbed. Offensive rebounds create second-chance points; defensive rebounds end opponent possessions.
- FTR (Free Throw Rate): Free throws made per field goal attempt (FTM/FGA). Measures ability to get to the line AND convert. Higher is better offensively, lower is better defensively.
Other Metrics:
- Elo Rating: Chess-style rating system that updates based on game results and opponent strength. Higher Elo indicates stronger team.
- Efficiency Margin: Point differential per 100 possessions (Offensive Efficiency – Defensive Efficiency). Accounts for pace of play.
- MACD (Moving Average Convergence Divergence): Trend indicator comparing 12-game and 26-game exponential moving averages. Positive MACD = improving trend, Negative MACD = declining trend.
Analysis powered by HoopSci’s advanced metrics and MACD trending indicators.