Ohio Valley Update: Week 1
November 9, 2026Strongest Offensive Trends
- SIUE, Off Reb Pct, Up, Trend Strength: 0.062 – SIUE is showing signs of improvement in their ability to secure rebounds offensively, a developing strength that should aid their overall defensive resilience as the season progresses.
- E Illinois, Off Reb Pct, Down, Trend Strength: -0.017 – E Illinois has been struggling with its performance on the boards as the team relies less frequently on second-chance opportunities, a developing concern that could hinder their overall offensive production in upcoming contests.
- SIUE, Shooting, Up, Trend Strength: 0.013 – The team’s shooting has shown marked improvement this season, contributing positively to their overall offensive performance.
- E Illinois, Turnovers, Up, Trend Strength: 0.011 – Turning the ball over at a rising rate is creating tangible issues for E Illinois’s offense by giving opponents easier opportunities to score.
- Morehead State, Turnovers, Down, Trend Strength: -0.008 – A decrease in turnover rate indicates that Morehead State is better protecting possession while setting themselves up for scoring opportunities.
Strongest Defensive Trends
- E Illinois, Opp Shooting, Up, Trend Strength: 0.026 – The defense of E Illinois has struggled to keep opposing shooting efforts contained this early in the season.
- E Illinois, Def Reb Pct, Down, Trend Strength: -0.025 – The defending rebound percentage for E Illinois is trending downward, signaling a growing difficulty in securing defensive boards while simultaneously ceding more offensive opportunities to opponents.
- Morehead State, Def Reb Pct, Down, Trend Strength: -0.02 – Morehead State is struggling defensively as its ability to secure rebounds has declined, allowing more offensive boards than desired.
- SE Missouri St, Opp Shooting, Down, Trend Strength: -0.012 – SE Missouri St has shown marked improvement in limiting opponent shooting efficiency throughout the early season, suggesting the team is finding more success in defensive schemes that stifle scoring opportunities for visitors.
- Morehead State, Opp Turnovers, Down, Trend Strength: -0.009 – Morehead State is experiencing a troubling regression in its defensive transition game, as the unit is failing to capitalize on opponent mistakes and force the necessary turnovers it needs to disrupt the flow of play.
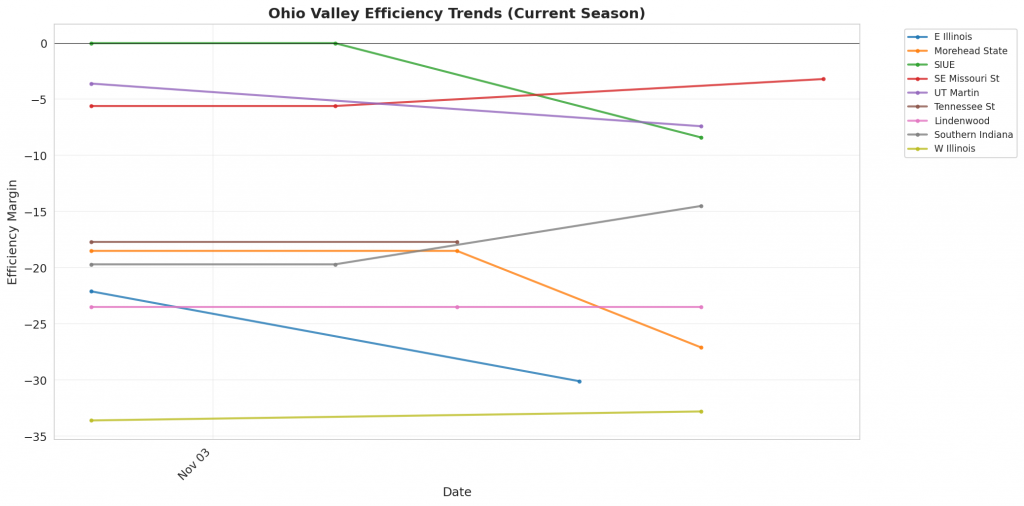
Figure 1: Efficiency margin trends for Ohio Valley teams throughout the season. Teams trending upward show improving performance, while downward trends indicate struggles.
Conference Snapshot
- Week Dates: November 02 – November 08, 2026
- Trending Up (Efficiency): SIUE, UT Martin, Lindenwood, Southern Indiana, W Illinois
- Trending Down (Efficiency): E Illinois, Morehead State, SE Missouri St, Tennessee St
Team-by-Team Analysis
E Illinois
Record: 0-2 | Elo: 1400.6 (ranked 322 of 365) | Efficiency Margin: -30.14 (ranked 354 of 365)
Offensive Trends:
- Turnovers (Turnovers): Currently ranked 356 of 365 in D1. Trending up strongly 🔴.
- Off Reb Pct (Offensive Rebounding): Currently ranked 298 of 365 in D1. Trending down strongly 🔴.
Defensive Trends:
- Opp Shooting (Opp Shooting): Currently ranked 363 of 365 in D1. Trending up strongly 🔴.
- Def Reb Pct (Defensive Rebounding): Currently ranked 354 of 365 in D1. Trending down strongly 🔴.
Lindenwood
Record: 2-1 | Elo: 1449.1 (ranked 268 of 365) | Efficiency Margin: -23.55 (ranked 332 of 365)
Offensive Trends:
- Turnovers (Turnovers): Currently ranked 354 of 365 in D1. Trending down strongly 🟢.
- Off Reb Pct (Offensive Rebounding): Currently ranked 92 of 365 in D1. Trending up strongly 🟢.
Defensive Trends:
- Opp Turnovers (Opp Turnovers): Currently ranked 167 of 365 in D1. Trending down moderately 🔴.
- Opp Shooting (Opp Shooting): Currently ranked 213 of 365 in D1. Trending down weakly 🟢.
Morehead State
Record: 1-2 | Elo: 1503.4 (ranked 184 of 365) | Efficiency Margin: -27.09 (ranked 346 of 365)
Offensive Trends:
- Turnovers (Turnovers): Currently ranked 154 of 365 in D1. Trending down strongly 🟢.
- Shooting (Shooting): Currently ranked 339 of 365 in D1. Trending down moderately 🔴.
Defensive Trends:
- Opp Turnovers (Opp Turnovers): Currently ranked 357 of 365 in D1. Trending down strongly 🔴.
- Def Reb Pct (Defensive Rebounding): Currently ranked 344 of 365 in D1. Trending down strongly 🔴.
SE Missouri St
Record: 2-1 | Elo: 1514.3 (ranked 161 of 365) | Efficiency Margin: -3.17 (ranked 178 of 365)
Offensive Trends:
- Off Reb Pct (Offensive Rebounding): Currently ranked 286 of 365 in D1. Trending up strongly 🟢.
- Shooting (Shooting): Currently ranked 154 of 365 in D1. Trending down moderately 🔴.
Defensive Trends:
- Opp Shooting (Opp Shooting): Currently ranked 144 of 365 in D1. Trending down strongly 🟢.
- Opp Turnovers (Opp Turnovers): Currently ranked 118 of 365 in D1. Trending down moderately 🔴.
SIUE
Record: 2-1 | Elo: 1491.2 (ranked 203 of 365) | Efficiency Margin: -8.44 (ranked 220 of 365)
Offensive Trends:
- Shooting (Shooting): Currently ranked 179 of 365 in D1. Trending up strongly 🟢.
- Off Reb Pct (Offensive Rebounding): Currently ranked 212 of 365 in D1. Trending up strongly 🟢.
Defensive Trends:
- Opp Shooting (Opp Shooting): Currently ranked 134 of 365 in D1. Trending up moderately 🔴.
- Opp Turnovers (Opp Turnovers): Currently ranked 210 of 365 in D1. Trending up weakly 🟢.
Southern Indiana
Record: 1-2 | Elo: 1334.9 (ranked 364 of 365) | Efficiency Margin: -14.52 (ranked 273 of 365)
Offensive Trends:
- Turnovers (Turnovers): Currently ranked 183 of 365 in D1. Trending down strongly 🟢.
- Off Reb Pct (Offensive Rebounding): Currently ranked 161 of 365 in D1. Trending up strongly 🟢.
Defensive Trends:
- Opp Shooting (Opp Shooting): Currently ranked 260 of 365 in D1. Trending up strongly 🔴.
- Def Reb Pct (Defensive Rebounding): Currently ranked 78 of 365 in D1. Trending up moderately 🟢.
Tennessee St
Record: 1-1 | Elo: 1537.4 (ranked 125 of 365) | Efficiency Margin: -17.68 (ranked 301 of 365)
Offensive Trends:
- Off Reb Pct (Offensive Rebounding): Currently ranked 155 of 365 in D1. Trending up strongly 🟢.
- Turnovers (Turnovers): Currently ranked 358 of 365 in D1. Trending up moderately 🔴.
Defensive Trends:
- Opp Shooting (Opp Shooting): Currently ranked 256 of 365 in D1. Trending down weakly 🟢.
- Opp Turnovers (Opp Turnovers): Currently ranked 61 of 365 in D1. Trending up weakly 🟢.
UT Martin
Record: 0-2 | Elo: 1475.4 (ranked 230 of 365) | Efficiency Margin: -7.40 (ranked 211 of 365)
Offensive Trends:
- Off Reb Pct (Offensive Rebounding): Currently ranked 80 of 365 in D1. Trending down strongly 🔴.
- Turnovers (Turnovers): Currently ranked 353 of 365 in D1. Trending up moderately 🔴.
Defensive Trends:
- Opp Turnovers (Opp Turnovers): Currently ranked 346 of 365 in D1. Trending down moderately 🔴.
- Opp Shooting (Opp Shooting): Currently ranked 121 of 365 in D1. Trending up weakly 🔴.
W Illinois
Record: 0-2 | Elo: 1313.6 (ranked 369 of 365) | Efficiency Margin: -32.78 (ranked 358 of 365)
Offensive Trends:
- Off Reb Pct (Offensive Rebounding): Currently ranked 321 of 365 in D1. Trending down strongly 🔴.
- Turnovers (Turnovers): Currently ranked 281 of 365 in D1. Trending up moderately 🔴.
Defensive Trends:
- Opp Shooting (Opp Shooting): Currently ranked 267 of 365 in D1. Trending up weakly 🔴.
- Opp Turnovers (Opp Turnovers): Currently ranked 206 of 365 in D1. Trending up weakly 🟢.
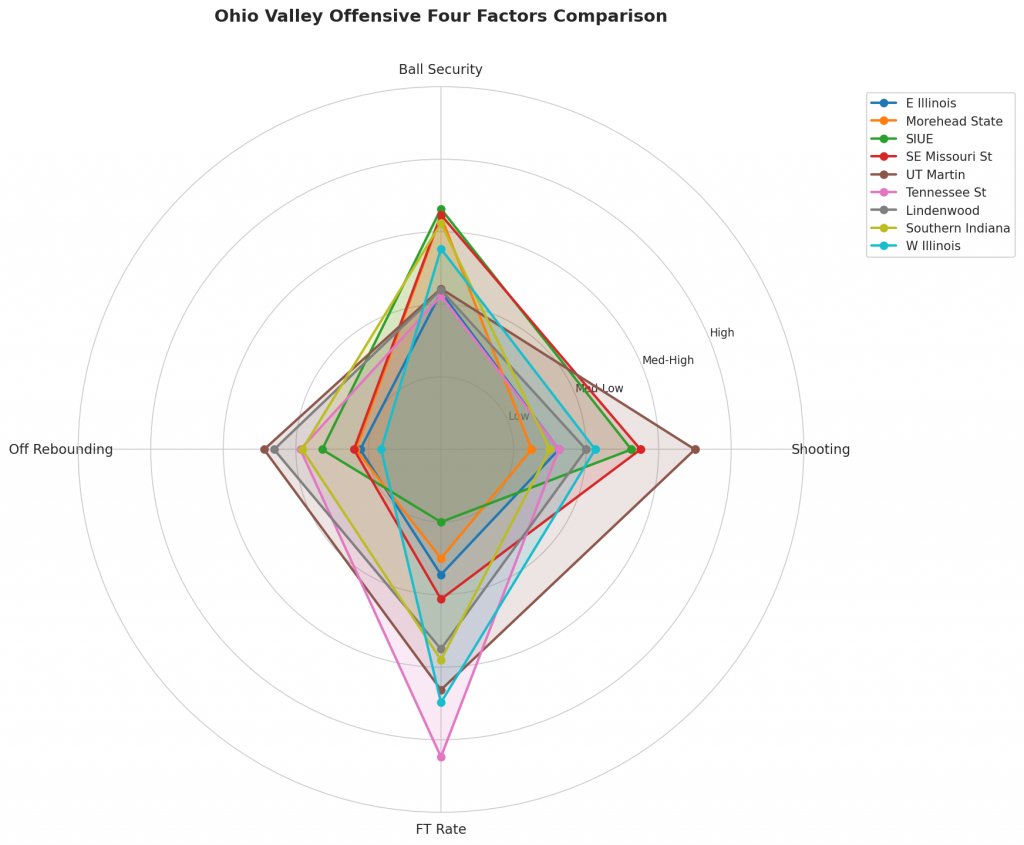
Figure 2: Offensive Four Factors comparison across Ohio Valley teams. The radar chart shows each team’s shooting efficiency (eFG%), ball security (TOV%), offensive rebounding (OREB%), and free throw generation (FT Rate).
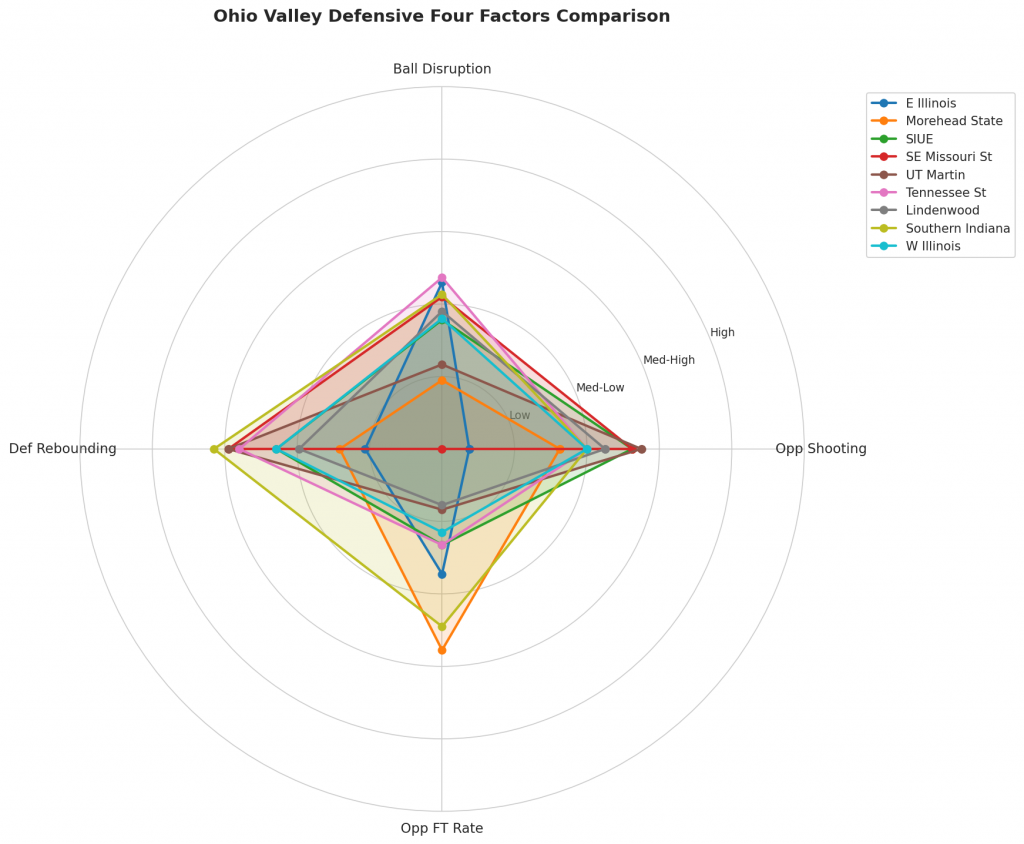
Figure 3: Defensive Four Factors comparison across Ohio Valley teams. The radar chart shows each team’s opponent shooting defense (Opp eFG%), ball disruption (forcing TOV%), defensive rebounding (DREB%), and opponent free throw prevention (Opp FT Rate).
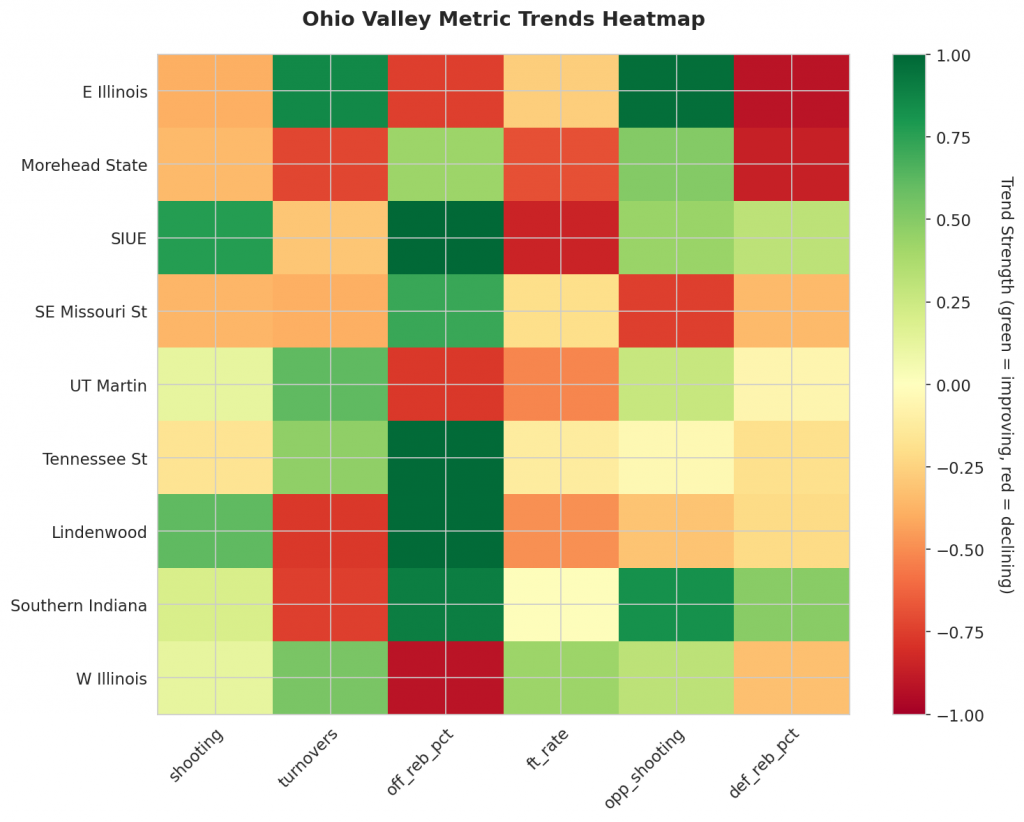
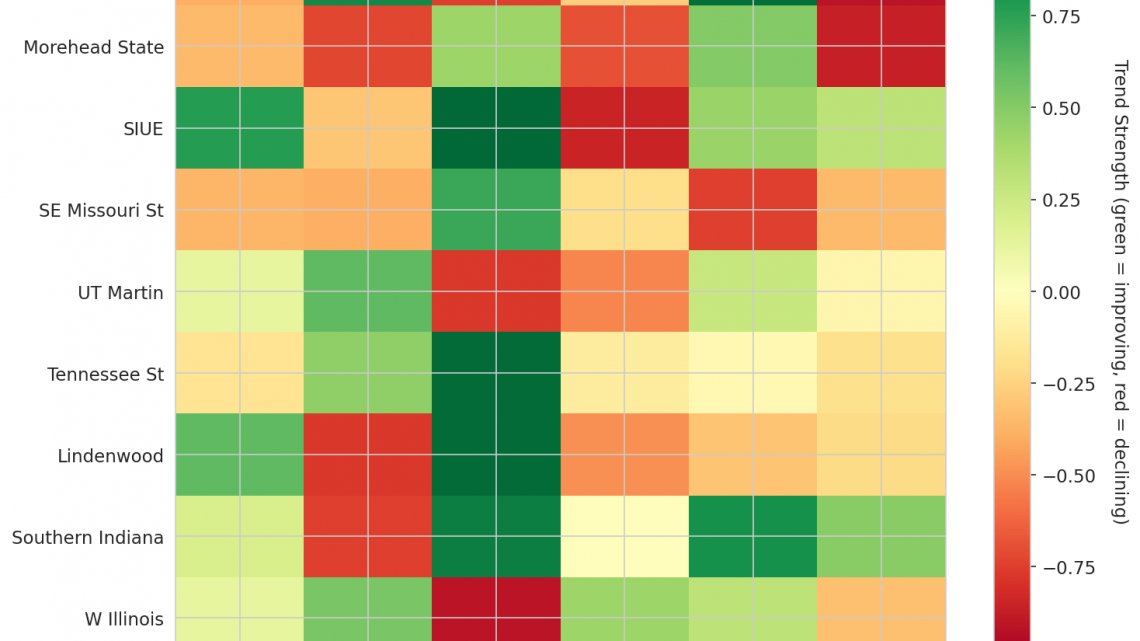
Figure 4: MACD trends heatmap showing which metrics are improving (green) or declining (red) for each team. Stronger colors indicate more pronounced trends.
Looking Ahead
As Ohio Valley teams continue their season, the MACD trending indicators will help identify which teams are genuinely improving versus those riding unsustainable momentum. Check back next week for updated analysis.
Metrics Glossary
Four Factors (Dean Oliver’s framework for basketball success):
- eFG% (Effective Field Goal %): Field goal percentage adjusted for 3-pointers being worth more (FGM + 0.5×3PM) / FGA. Higher is better offensively, lower is better defensively.
- TOV% (Turnover Rate): Turnovers per 100 possessions. Lower is better offensively (taking care of the ball), higher is better defensively (forcing turnovers).
- OREB% / DREB% (Offensive/Defensive Rebound Rate): Percentage of available rebounds grabbed. Offensive rebounds create second-chance points; defensive rebounds end opponent possessions.
- FTR (Free Throw Rate): Free throws made per field goal attempt (FTM/FGA). Measures ability to get to the line AND convert. Higher is better offensively, lower is better defensively.
Other Metrics:
- Elo Rating: Chess-style rating system that updates based on game results and opponent strength. Higher Elo indicates stronger team.
- Efficiency Margin: Point differential per 100 possessions (Offensive Efficiency – Defensive Efficiency). Accounts for pace of play.
- MACD (Moving Average Convergence Divergence): Trend indicator comparing 12-game and 26-game exponential moving averages. Positive MACD = improving trend, Negative MACD = declining trend.
Analysis powered by HoopSci’s advanced metrics and MACD trending indicators.