Southern Update: Week 1
November 9, 2026Strongest Offensive Trends
- ETSU, Off Reb Pct, Down, Trend Strength: -0.021 – ETSU’s ability to secure rebounds on offense has declined, creating a challenge for their possession management and limiting opportunities in the paint.
- Chattanooga, Shooting, Up, Trend Strength: 0.015 – Chattanooga is seeing marked improvement in its shooting, a development that contributes positively to its overall offensive efficiency.
- Furman, Shooting, Up, Trend Strength: 0.012 – Furman has seen its shooting proficiency climb, providing a marked boost to their offensive efficiency early in the season.
- Furman, Turnovers, Down, Trend Strength: -0.012 – As Furman continues to reduce turnovers throughout the early season schedule, fewer ball-handling mistakes are contributing to enhanced offensive efficiency.
- ETSU, Turnovers, Up, Trend Strength: 0.012 – ETSU is wrestling with a troubling upward trend in turnovers that is actively undermining their offensive consistency throughout the season’s opening weeks.
Strongest Defensive Trends
- ETSU, Def Reb Pct, Down, Trend Strength: -0.035 – ETSU faces a growing concern as their defensive rebounding percentage declines, allowing opponents to secure additional offensive glass opportunities.
- The Citadel, Def Reb Pct, Down, Trend Strength: -0.029 – The Citadel’s declining percentage of defensive rebounds indicates an emerging vulnerability that results in surrendering additional opportunities for their opponents on the offensive glass during the opening weeks of the season.
- Mercer, Def Reb Pct, Down, Trend Strength: -0.025 – Mercer is experiencing a troubling downward trajectory in its defensive rebounding percentage, a metric that signals an inability to limit opponent second-chance opportunities by securing fewer defensive boards than necessary.
- Mercer, Opp Turnovers, Down, Trend Strength: -0.017 – Mercer is currently facing a struggle as its ability to force opponent turnovers appears to be diminishing early this season.
- Chattanooga, Def Reb Pct, Down, Trend Strength: -0.016 – Chattanooga faces a defensive struggle with rebounding, as poor protection on the glass allows opponents to gain too many second-chance opportunities.
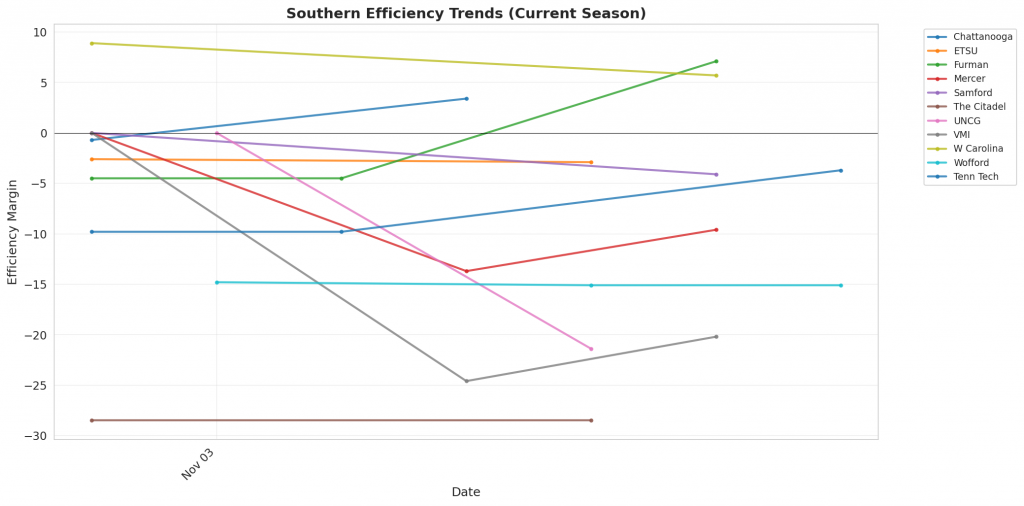
Figure 1: Efficiency margin trends for Southern teams throughout the season. Teams trending upward show improving performance, while downward trends indicate struggles.
Conference Snapshot
- Week Dates: November 02 – November 08, 2026
- Trending Up (Efficiency): Chattanooga, ETSU, Furman, Mercer, Samford
- Trending Down (Efficiency): VMI, W Carolina, Wofford
Team-by-Team Analysis
Chattanooga
Record: 0-2 | Elo: 1485.2 (ranked 215 of 365) | Efficiency Margin: +3.36 (ranked 134 of 365)
Offensive Trends:
- Shooting (Shooting): Currently ranked 65 of 365 in D1. Trending up strongly 🟢.
- Off Reb Pct (Offensive Rebounding): Currently ranked 234 of 365 in D1. Trending up moderately 🟢.
Defensive Trends:
- Def Reb Pct (Defensive Rebounding): Currently ranked 340 of 365 in D1. Trending down strongly 🔴.
- Opp Shooting (Opp Shooting): Currently ranked 182 of 365 in D1. Trending up moderately 🔴.
ETSU
Record: 0-2 | Elo: 1537.0 (ranked 126 of 365) | Efficiency Margin: -2.91 (ranked 176 of 365)
Offensive Trends:
- Turnovers (Turnovers): Currently ranked 297 of 365 in D1. Trending up strongly 🔴.
- Off Reb Pct (Offensive Rebounding): Currently ranked 277 of 365 in D1. Trending down strongly 🔴.
Defensive Trends:
- Def Reb Pct (Defensive Rebounding): Currently ranked 330 of 365 in D1. Trending down strongly 🔴.
- Opp Shooting (Opp Shooting): Currently ranked 245 of 365 in D1. Trending up moderately 🔴.
Furman
Record: 3-0 | Elo: 1577.8 (ranked 67 of 365) | Efficiency Margin: +7.05 (ranked 112 of 365)
Offensive Trends:
- Shooting (Shooting): Currently ranked 51 of 365 in D1. Trending up strongly 🟢.
- Turnovers (Turnovers): Currently ranked 100 of 365 in D1. Trending down strongly 🟢.
Defensive Trends:
- Opp Shooting (Opp Shooting): Currently ranked 144 of 365 in D1. Trending up moderately 🔴.
- Opp Turnovers (Opp Turnovers): Currently ranked 345 of 365 in D1. Trending down weakly 🔴.
Mercer
Record: 1-2 | Elo: 1490.9 (ranked 205 of 365) | Efficiency Margin: -9.65 (ranked 227 of 365)
Offensive Trends:
- Turnovers (Turnovers): Currently ranked 229 of 365 in D1. Trending up moderately 🔴.
- Off Reb Pct (Offensive Rebounding): Currently ranked 181 of 365 in D1. Trending up moderately 🟢.
Defensive Trends:
- Opp Turnovers (Opp Turnovers): Currently ranked 363 of 365 in D1. Trending down strongly 🔴.
- Def Reb Pct (Defensive Rebounding): Currently ranked 307 of 365 in D1. Trending down strongly 🔴.
Samford
Record: 1-1 | Elo: 1541.6 (ranked 116 of 365) | Efficiency Margin: -4.08 (ranked 188 of 365)
Offensive Trends:
- Shooting (Shooting): Currently ranked 141 of 365 in D1. Trending up strongly 🟢.
- Off Reb Pct (Offensive Rebounding): Currently ranked 355 of 365 in D1. Trending up moderately 🟢.
Defensive Trends:
- Def Reb Pct (Defensive Rebounding): Currently ranked 133 of 365 in D1. Trending up moderately 🟢.
- Opp Shooting (Opp Shooting): Currently ranked 240 of 365 in D1. Trending down weakly 🟢.
Tenn Tech
Record: 2-1 | Elo: 1426.3 (ranked 297 of 365) | Efficiency Margin: -3.65 (ranked 183 of 365)
Offensive Trends:
- Off Reb Pct (Offensive Rebounding): Currently ranked 222 of 365 in D1. Trending up strongly 🟢.
- Shooting (Shooting): Currently ranked 47 of 365 in D1. Trending up moderately 🟢.
Defensive Trends:
- Opp Shooting (Opp Shooting): Currently ranked 333 of 365 in D1. Trending up moderately 🔴.
- Def Reb Pct (Defensive Rebounding): Currently ranked 289 of 365 in D1. Trending up moderately 🟢.
The Citadel
Record: 1-1 | Elo: 1363.1 (ranked 354 of 365) | Efficiency Margin: -28.47 (ranked 350 of 365)
Offensive Trends:
- Shooting (Shooting): Currently ranked 270 of 365 in D1. Trending up strongly 🟢.
- Off Reb Pct (Offensive Rebounding): Currently ranked 162 of 365 in D1. Trending up strongly 🟢.
Defensive Trends:
- Def Reb Pct (Defensive Rebounding): Currently ranked 364 of 365 in D1. Trending down strongly 🔴.
- Opp Shooting (Opp Shooting): Currently ranked 270 of 365 in D1. Trending up moderately 🔴.
UNCG
Record: 1-1 | Elo: 1484.3 (ranked 217 of 365) | Efficiency Margin: -21.39 (ranked 322 of 365)
Offensive Trends:
- Shooting (Shooting): Currently ranked 189 of 365 in D1. Trending up moderately 🟢.
- Off Reb Pct (Offensive Rebounding): Currently ranked 359 of 365 in D1. Trending up moderately 🟢.
Defensive Trends:
- Opp Shooting (Opp Shooting): Currently ranked 237 of 365 in D1. Trending up weakly 🔴.
- Opp Turnovers (Opp Turnovers): Currently ranked 282 of 365 in D1. Trending up weakly 🟢.
VMI
Record: 1-2 | Elo: 1322.9 (ranked 366 of 365) | Efficiency Margin: -20.16 (ranked 314 of 365)
Offensive Trends:
- Off Reb Pct (Offensive Rebounding): Currently ranked 78 of 365 in D1. Trending up strongly 🟢.
- Shooting (Shooting): Currently ranked 351 of 365 in D1. Trending down moderately 🔴.
Defensive Trends:
- Def Reb Pct (Defensive Rebounding): Currently ranked 196 of 365 in D1. Trending up strongly 🟢.
- Opp Turnovers (Opp Turnovers): Currently ranked 179 of 365 in D1. Trending down moderately 🔴.
W Carolina
Record: 1-1 | Elo: 1487.3 (ranked 212 of 365) | Efficiency Margin: +5.71 (ranked 123 of 365)
Offensive Trends:
- Turnovers (Turnovers): Currently ranked 26 of 365 in D1. Trending down moderately 🟢.
- Shooting (Shooting): Currently ranked 259 of 365 in D1. Trending down weakly 🔴.
Defensive Trends:
- Opp Turnovers (Opp Turnovers): Currently ranked 282 of 365 in D1. Trending up moderately 🟢.
- Opp Shooting (Opp Shooting): Currently ranked 194 of 365 in D1. Trending down weakly 🟢.
Wofford
Record: 1-2 | Elo: 1512.5 (ranked 165 of 365) | Efficiency Margin: -15.13 (ranked 282 of 365)
Offensive Trends:
- Turnovers (Turnovers): Currently ranked 96 of 365 in D1. Trending up strongly 🔴.
- Off Reb Pct (Offensive Rebounding): Currently ranked 238 of 365 in D1. Trending up strongly 🟢.
Defensive Trends:
- Opp Shooting (Opp Shooting): Currently ranked 326 of 365 in D1. Trending up strongly 🔴.
- Opp Turnovers (Opp Turnovers): Currently ranked 339 of 365 in D1. Trending down moderately 🔴.
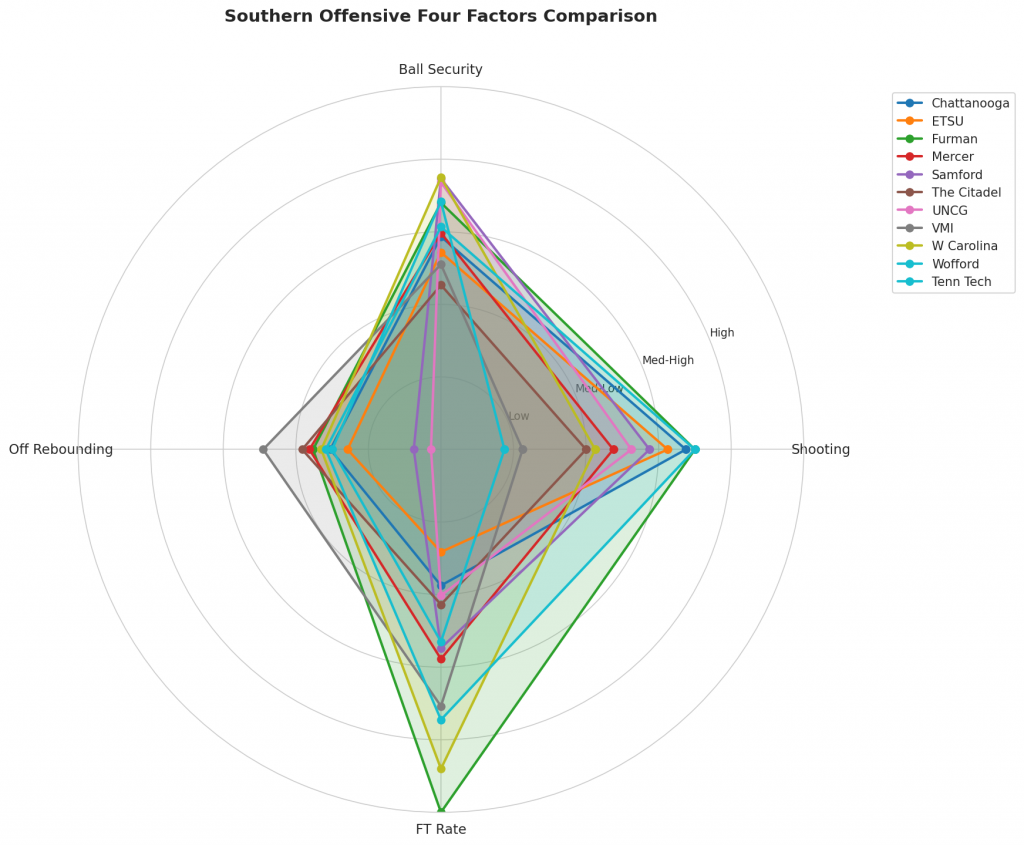
Figure 2: Offensive Four Factors comparison across Southern teams. The radar chart shows each team’s shooting efficiency (eFG%), ball security (TOV%), offensive rebounding (OREB%), and free throw generation (FT Rate).
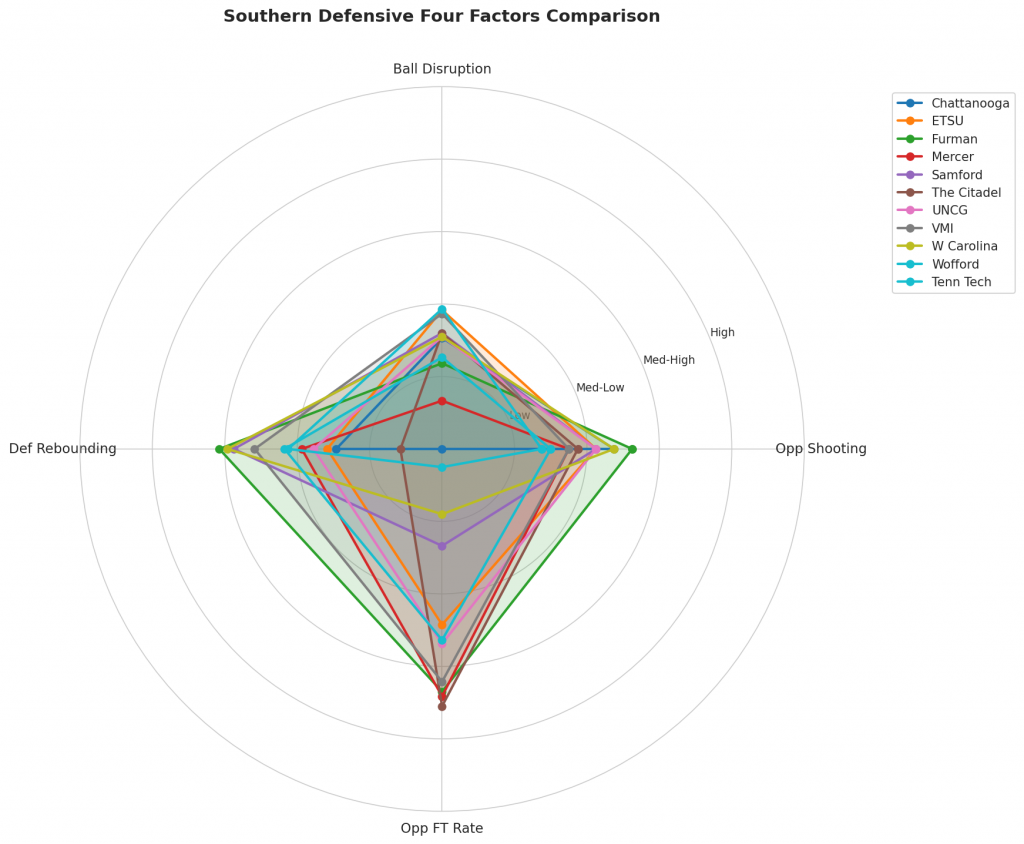
Figure 3: Defensive Four Factors comparison across Southern teams. The radar chart shows each team’s opponent shooting defense (Opp eFG%), ball disruption (forcing TOV%), defensive rebounding (DREB%), and opponent free throw prevention (Opp FT Rate).
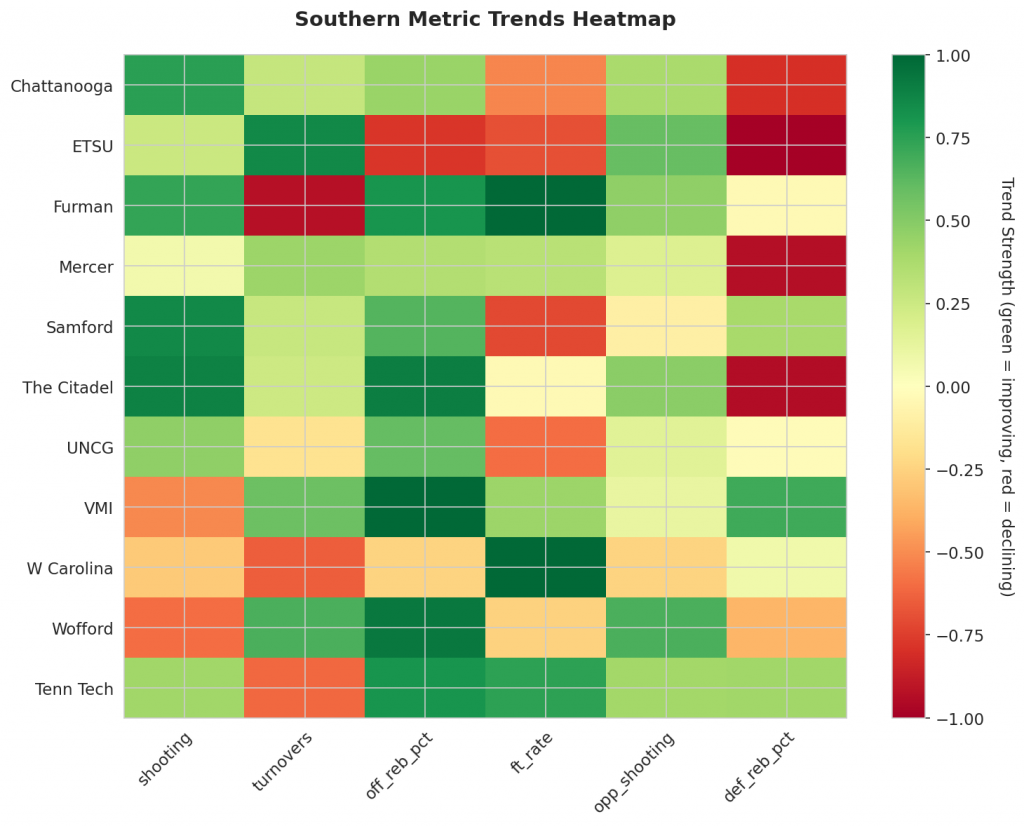
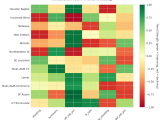
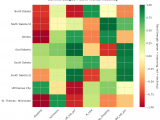
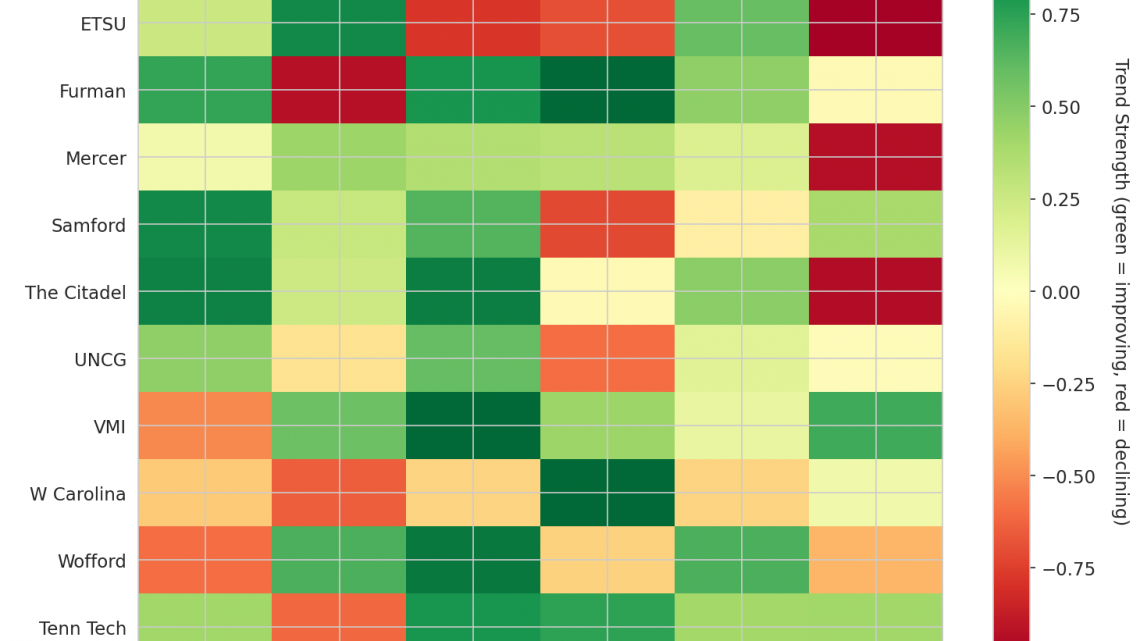
Figure 4: MACD trends heatmap showing which metrics are improving (green) or declining (red) for each team. Stronger colors indicate more pronounced trends.
Looking Ahead
Southern Basketball Analysis: Week 1 MACD Momentum Report
As Southern teams open their seasons, the Moving Average Convergence Divergence (MACD) trending indicators offer a critical lens for distinguishing between genuine improvement and unsustainable momentum. This analysis focuses strictly on the available data to highlight where performance is stabilizing and where underlying metrics are deteriorating across the region.
Offensive Trends: Strengths and Vulnerabilities
On the offensive end, shooting efficiency and ball security present diverging narratives among the tracked programs.
Chattanooga and Furman have both exhibited strong upward trends in shooting percentage since the start of the season. Chattanooga entered Week 1 with a season average of 0.57 shooting and is currently trending strongly up, indicating a significant increase in offensive value as the metric improves. Similarly, Furman displays comparable performance with a 0.58 season average, also showing a strong upward trend that signals enhanced scoring efficiency.
Conversely, East Tennessee State (ETSU) presents a cautionary tale regarding ball security. While their shooting output remains a separate variable, ETSU is experiencing a significant deterioration in turnover management. With a season average of 0.187, the team is trending strongly up in turnovers. In MACD terms, an increase in this value represents a worsening performance, suggesting that offensive opportunities are being squandered at a rate higher than the season average. This degradation is likely to diminish their overall offensive impact over time.
Defensive Trends: Rebounding and Ball Security
The defensive picture for the Southern teams reveals consistent struggles with rebounding dominance, alongside mixed results in forcing opponent mistakes.
Rebounding percentages are trending downward strongly for Chattanooga, Mercer, and ETSU, signaling a shared vulnerability in protecting the rim or controlling the glass. For all three squads—Chattanooga (0.617 season average), ETSU (0.627 season average), and Mercer (0.655 season average)—the strong downward trend in defensive rebounding percentage means they are allowing more offensive boards for opponents. This shift effectively cedes possession advantage to the opposition, representing a clear decline in defensive structure.
Mercer faces an additional issue regarding forced errors by their defense. Their season average for opponent turnovers is 0.09, and this metric is trending strongly down. Because a decrease in forced turnovers signifies a failure to disrupt offensive flow, this trend represents a worsening of defensive play. Mercer is generating fewer stoppages than their season average dictates, which will likely lead to higher efficiency on the other end of the floor for their opponents.
Outlook
This Week 1 wrap-up highlights that while Chattanooga and Furman are driving positive value through improved shooting, ETSU must address turnover issues quickly, and both Chattanooga, Mercer, and ETSU need to stabilize their rebounding efforts. The MACD indicators suggest these teams are not merely riding luck; rather, the data confirms specific areas where performance is either solidifying or deteriorating. Check back next week for updated analysis as the season progresses.
Metrics Glossary
Four Factors (Dean Oliver’s framework for basketball success):
- eFG% (Effective Field Goal %): Field goal percentage adjusted for 3-pointers being worth more (FGM + 0.5×3PM) / FGA. Higher is better offensively, lower is better defensively.
- TOV% (Turnover Rate): Turnovers per 100 possessions. Lower is better offensively (taking care of the ball), higher is better defensively (forcing turnovers).
- OREB% / DREB% (Offensive/Defensive Rebound Rate): Percentage of available rebounds grabbed. Offensive rebounds create second-chance points; defensive rebounds end opponent possessions.
- FTR (Free Throw Rate): Free throws made per field goal attempt (FTM/FGA). Measures ability to get to the line AND convert. Higher is better offensively, lower is better defensively.
Other Metrics:
- Elo Rating: Chess-style rating system that updates based on game results and opponent strength. Higher Elo indicates stronger team.
- Efficiency Margin: Point differential per 100 possessions (Offensive Efficiency – Defensive Efficiency). Accounts for pace of play.
- MACD (Moving Average Convergence Divergence): Trend indicator comparing 12-game and 26-game exponential moving averages. Positive MACD = improving trend, Negative MACD = declining trend.
Analysis powered by HoopSci’s advanced metrics and MACD trending indicators.