Summit League Update: Week 1
November 9, 2026Strongest Offensive Trends
- North Dakota, Off Reb Pct, Down, Trend Strength: -0.028 – North Dakota finds itself battling an unfavorable downward trajectory in their rebounding percentage, a troubling metric that indicates they are losing possession battles more often than desired during this early phase of the season.
- Omaha, Shooting, Down, Trend Strength: -0.026 – Omaha’s Shooting is trending down, a worsening trend.
- Omaha, Off Reb Pct, Up, Trend Strength: 0.019 – The improvement in rebounding percentage for Omaha suggests the team is becoming more effective at securing second chances, a shift that naturally bolsters their overall offensive opportunities without relying on high-volume shooting.
- North Dakota St, Shooting, Down, Trend Strength: -0.016 – North Dakota St faces a troubling decline in shooting performance that is significantly hampering their overall offensive efforts this season.
- North Dakota, Shooting, Down, Trend Strength: -0.014 – North Dakota has fallen into a troubling shooting slump that is undermining their offensive impact during the opening week of competition.
Strongest Defensive Trends
- North Dakota St, Opp Shooting, Up, Trend Strength: 0.03 – North Dakota St is facing troubling signs as the ability to shut down opposing offenses continues to decline, leaving the team vulnerable on the defensive end of the court.
- Oral Roberts, Def Reb Pct, Up, Trend Strength: 0.023 – As Oral Roberts strengthens its defensive rebounding, the team effectively curtails opponent second-chance points throughout their first few contests of the season.
- South Dakota, Def Reb Pct, Up, Trend Strength: 0.021 – The South Dakota program has shown promising signs of improvement by securing more defensive rebounds, which effectively stifles opponent scoring opportunities while establishing a stronger defensive foundation.
- Omaha, Opp Shooting, Up, Trend Strength: 0.016 – Omaha faces concerns as its ability to suppress opponent shooting has deteriorated throughout the early phase of the season.
- Oral Roberts, Opp Shooting, Down, Trend Strength: -0.014 – The defense is effectively stifling opponents, which serves to elevate their opponent shooting percentage despite recent improvements in that same metric.
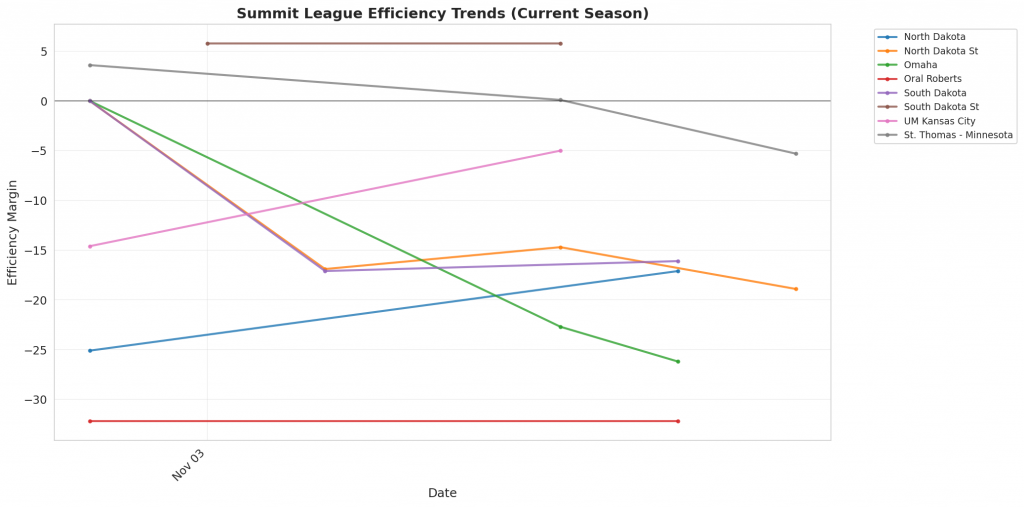
Figure 1: Efficiency margin trends for Summit League teams throughout the season. Teams trending upward show improving performance, while downward trends indicate struggles.
Conference Snapshot
- Week Dates: November 02 – November 08, 2026
- Trending Up (Efficiency): Oral Roberts, South Dakota, UM Kansas City
- Trending Down (Efficiency): North Dakota, North Dakota St, Omaha, South Dakota St, St. Thomas – Minnesota
Team-by-Team Analysis
North Dakota
Record: 1-1 | Elo: 1483.0 (ranked 219 of 365) | Efficiency Margin: -17.10 (ranked 300 of 365)
Offensive Trends:
- Shooting (Shooting): Currently ranked 343 of 365 in D1. Trending down strongly 🔴.
- Off Reb Pct (Offensive Rebounding): Currently ranked 188 of 365 in D1. Trending down strongly 🔴.
Defensive Trends:
- Opp Turnovers (Opp Turnovers): Currently ranked 166 of 365 in D1. Trending down moderately 🔴.
- Def Reb Pct (Defensive Rebounding): Currently ranked 238 of 365 in D1. Trending down moderately 🔴.
North Dakota St
Record: 1-3 | Elo: 1566.3 (ranked 83 of 365) | Efficiency Margin: -18.93 (ranked 306 of 365)
Offensive Trends:
- Shooting (Shooting): Currently ranked 264 of 365 in D1. Trending down strongly 🔴.
- Turnovers (Turnovers): Currently ranked 75 of 365 in D1. Trending down weakly 🟢.
Defensive Trends:
- Opp Shooting (Opp Shooting): Currently ranked 365 of 365 in D1. Trending up strongly 🔴.
- Def Reb Pct (Defensive Rebounding): Currently ranked 39 of 365 in D1. Trending up moderately 🟢.
Omaha
Record: 1-2 | Elo: 1481.8 (ranked 224 of 365) | Efficiency Margin: -26.15 (ranked 342 of 365)
Offensive Trends:
- Shooting (Shooting): Currently ranked 328 of 365 in D1. Trending down strongly 🔴.
- Off Reb Pct (Offensive Rebounding): Currently ranked 307 of 365 in D1. Trending up strongly 🟢.
Defensive Trends:
- Opp Shooting (Opp Shooting): Currently ranked 361 of 365 in D1. Trending up strongly 🔴.
- Opp Turnovers (Opp Turnovers): Currently ranked 323 of 365 in D1. Trending down moderately 🔴.
Oral Roberts
Record: 1-1 | Elo: 1374.9 (ranked 349 of 365) | Efficiency Margin: -32.23 (ranked 357 of 365)
Offensive Trends:
- Off Reb Pct (Offensive Rebounding): Currently ranked 171 of 365 in D1. Trending up strongly 🟢.
- Shooting (Shooting): Currently ranked 323 of 365 in D1. Trending up moderately 🟢.
Defensive Trends:
- Opp Shooting (Opp Shooting): Currently ranked 272 of 365 in D1. Trending down strongly 🟢.
- Def Reb Pct (Defensive Rebounding): Currently ranked 57 of 365 in D1. Trending up strongly 🟢.
South Dakota
Record: 1-2 | Elo: 1436.1 (ranked 279 of 365) | Efficiency Margin: -16.11 (ranked 294 of 365)
Offensive Trends:
- Off Reb Pct (Offensive Rebounding): Currently ranked 269 of 365 in D1. Trending up moderately 🟢.
- Shooting (Shooting): Currently ranked 95 of 365 in D1. Trending up weakly 🟢.
Defensive Trends:
- Def Reb Pct (Defensive Rebounding): Currently ranked 35 of 365 in D1. Trending up strongly 🟢.
- Opp Turnovers (Opp Turnovers): Currently ranked 237 of 365 in D1. Trending down moderately 🔴.
South Dakota St
Record: 2-0 | Elo: 1491.9 (ranked 201 of 365) | Efficiency Margin: +5.85 (ranked 120 of 365)
Offensive Trends:
- Off Reb Pct (Offensive Rebounding): Currently ranked 308 of 365 in D1. Trending up strongly 🟢.
- Shooting (Shooting): Currently ranked 156 of 365 in D1. Trending down moderately 🔴.
Defensive Trends:
- Def Reb Pct (Defensive Rebounding): Currently ranked 28 of 365 in D1. Trending up strongly 🟢.
- Opp Shooting (Opp Shooting): Currently ranked 174 of 365 in D1. Trending up moderately 🔴.
St. Thomas – Minnesota
Record: 1-2 | Elo: 1544.6 (ranked 111 of 365) | Efficiency Margin: -5.33 (ranked 194 of 365)
Offensive Trends:
- Shooting (Shooting): Currently ranked 176 of 365 in D1. Trending down strongly 🔴.
- Turnovers (Turnovers): Currently ranked 72 of 365 in D1. Trending up strongly 🔴.
Defensive Trends:
- Opp Turnovers (Opp Turnovers): Currently ranked 284 of 365 in D1. Trending down strongly 🔴.
- Opp Shooting (Opp Shooting): Currently ranked 154 of 365 in D1. Trending down moderately 🟢.
UM Kansas City
Record: 1-1 | Elo: 1331.4 (ranked 365 of 365) | Efficiency Margin: -4.98 (ranked 192 of 365)
Offensive Trends:
- Shooting (Shooting): Currently ranked 17 of 365 in D1. Trending up strongly 🟢.
- Off Reb Pct (Offensive Rebounding): Currently ranked 312 of 365 in D1. Trending down strongly 🔴.
Defensive Trends:
- Opp Shooting (Opp Shooting): Currently ranked 216 of 365 in D1. Trending up moderately 🔴.
- Opp Turnovers (Opp Turnovers): Currently ranked 289 of 365 in D1. Trending down weakly 🔴.
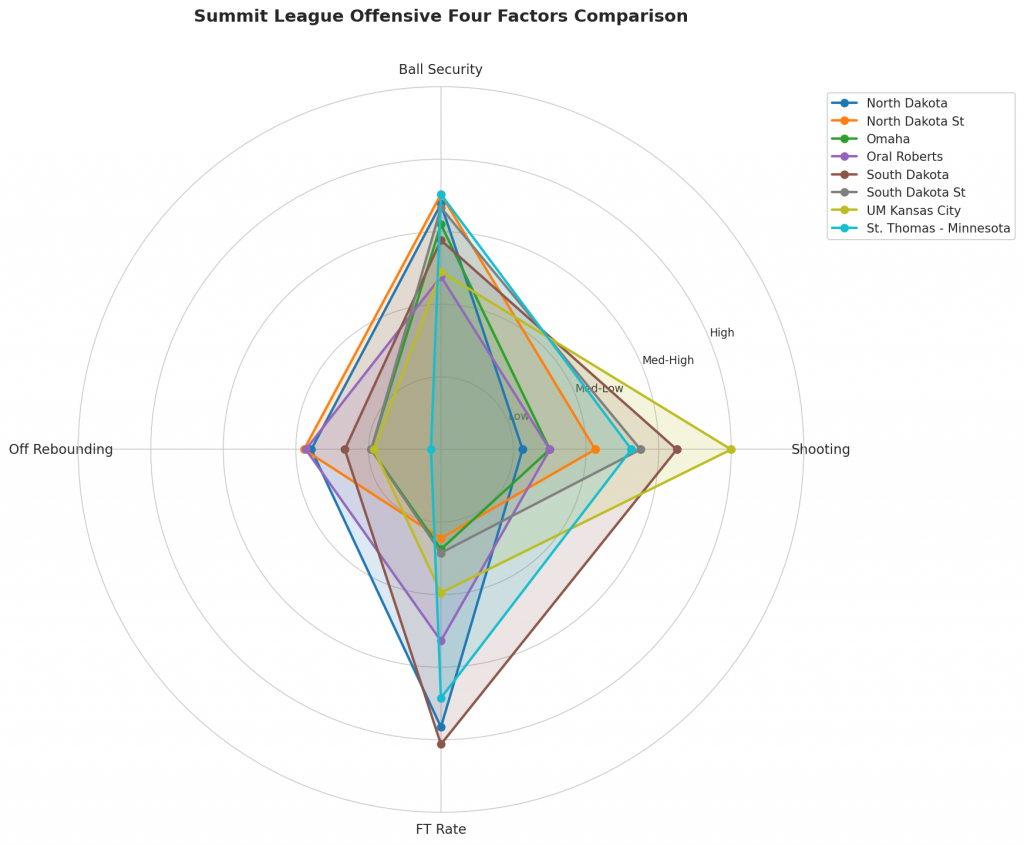
Figure 2: Offensive Four Factors comparison across Summit League teams. The radar chart shows each team’s shooting efficiency (eFG%), ball security (TOV%), offensive rebounding (OREB%), and free throw generation (FT Rate).
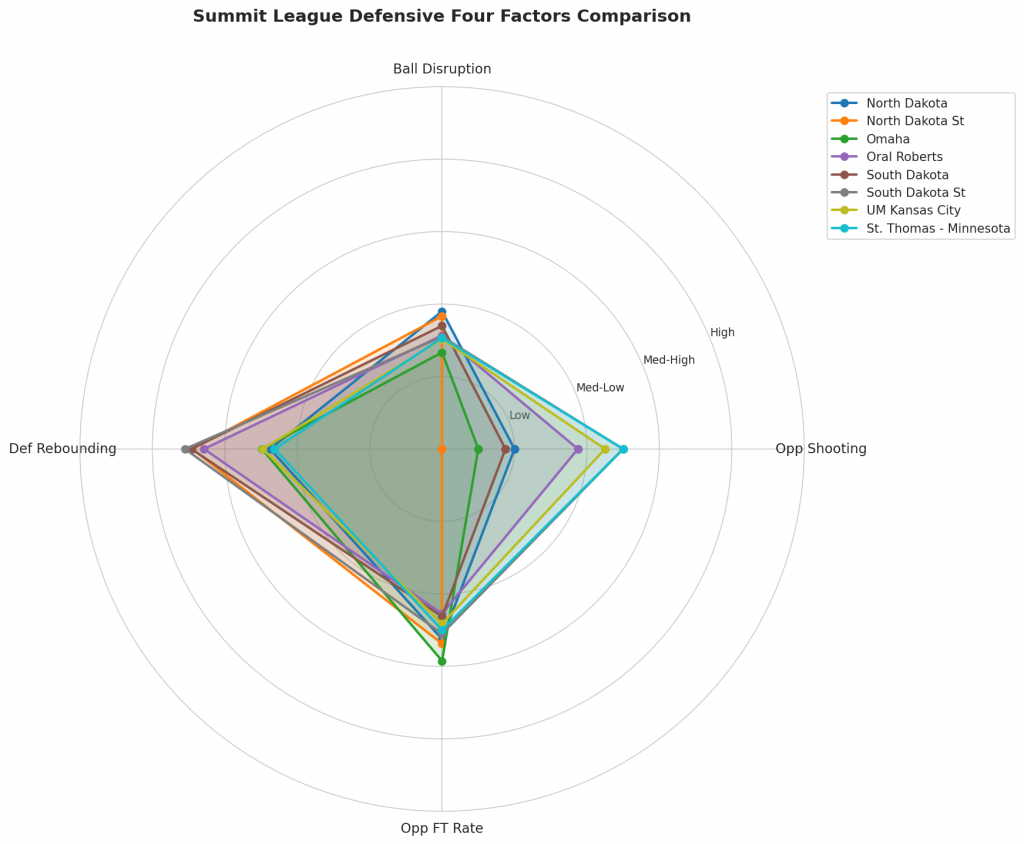
Figure 3: Defensive Four Factors comparison across Summit League teams. The radar chart shows each team’s opponent shooting defense (Opp eFG%), ball disruption (forcing TOV%), defensive rebounding (DREB%), and opponent free throw prevention (Opp FT Rate).
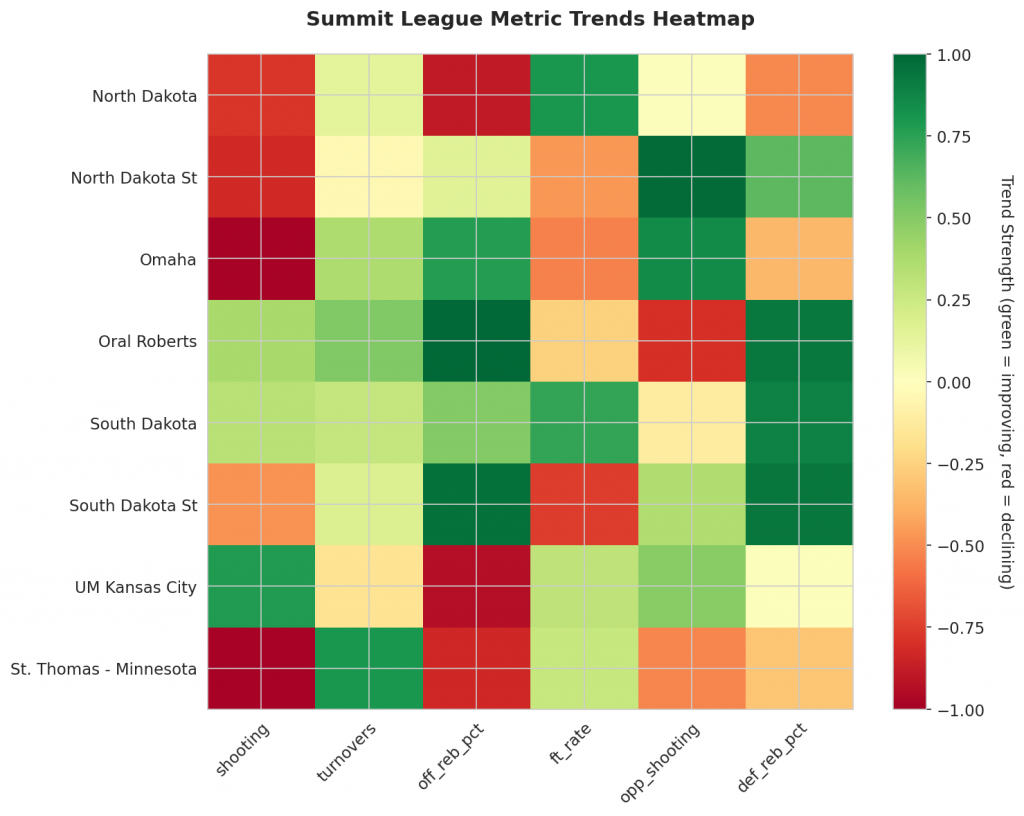
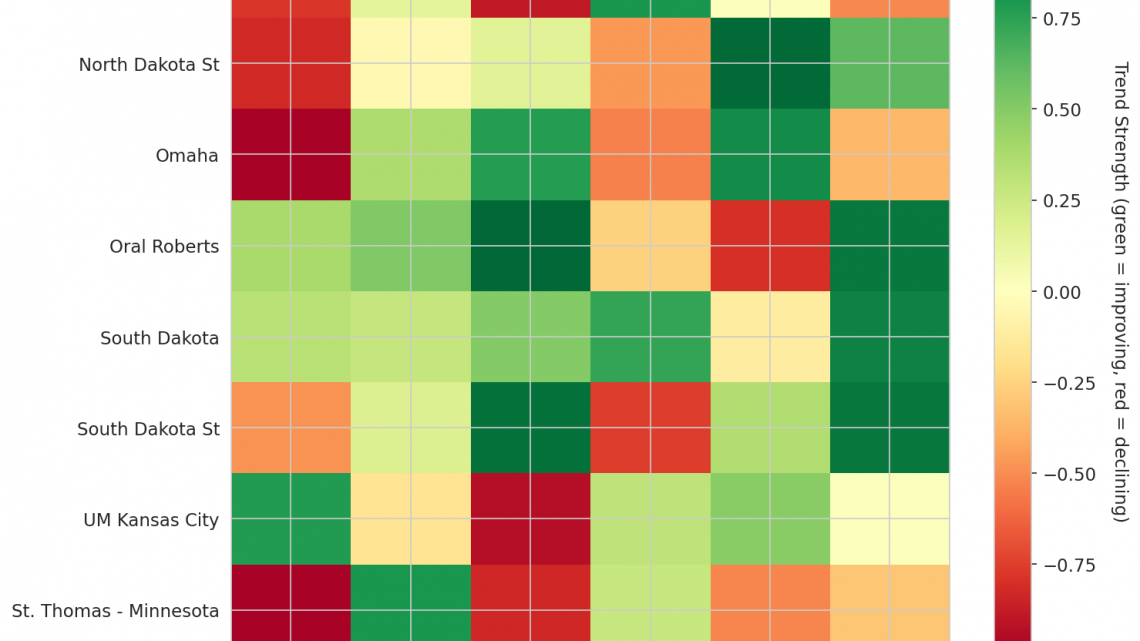
Figure 4: MACD trends heatmap showing which metrics are improving (green) or declining (red) for each team. Stronger colors indicate more pronounced trends.
Looking Ahead
Analysis of team momentum through the season’s initial games highlights distinct trajectories in offensive efficiency and defensive stability across the league. On the offensive end, shooting accuracy presents significant challenges for several programs. North Dakota is averaging 0.39 on the season with a strongly downward trend in field goal percentage, indicating a worsening trajectory where shooting efficiency is decreasing. Similarly, North Dakota State (averaging 0.47) and Omaha (averaging 0.42) are both trending down strongly in shooting efficiency, suggesting these values may continue to decrease as more games are played. Beyond raw shooting, rebounding activity on the offensive glass also presents a specific challenge for one squad; North Dakota is facing a strongly downward trend in offensive rebound percentage, currently sitting at 0.293 for the season. This decline suggests a potential difficulty in securing second-chance opportunities that could otherwise offset lower field goal percentages.
Defensively, the landscape varies with some teams struggling to hold opponents at bay while others show signs of tightening their defensive structure. North Dakota State faces a significant challenge in this area; despite allowing an average of 0.71 in opponent shooting, the trend is moving strongly upward. This strong deterioration indicates that their ability to suppress opponents’ shot-making efficiency is declining. Omaha is facing a similar issue, with an opponent shooting average of 0.66 also trending strongly upward, signaling a worsening defensive performance relative to early season standards. Conversely, Oral Roberts stands out as improving defensively in two key areas. Their ability to limit opponent shooting is moving in the right direction, with the metric showing a strong downward trend (meaning opponents are shooting less), currently averaging 0.55 against them. Furthermore, Oral Roberts is demonstrating strength on the defensive glass. They are grabbing more defensive boards, evidenced by an average of 0.763 for the season that is trending up strongly. This improvement in defensive rebounding percentage suggests a more cohesive effort to end possessions favorably and prevent easy transition opportunities for opponents.
The early momentum indicators reveal distinct paths for North Dakota, North Dakota State, Omaha, Oral Roberts, South Dakota, South Dakota St, UM Kansas City, and St. Thomas – Minnesota. While the teams within this group share a league affiliation, their current trends tell different stories. Some are experiencing value decreases that require correction, specifically regarding shooting and rebounding metrics, while others are showing signs of stabilization or improvement in critical defensive areas. As the sample size grows, these early momentum indicators will serve as a baseline to track which squads can reverse negative trends or maintain positive ones over a longer span of games.
Metrics Glossary
Four Factors (Dean Oliver’s framework for basketball success):
- eFG% (Effective Field Goal %): Field goal percentage adjusted for 3-pointers being worth more (FGM + 0.5×3PM) / FGA. Higher is better offensively, lower is better defensively.
- TOV% (Turnover Rate): Turnovers per 100 possessions. Lower is better offensively (taking care of the ball), higher is better defensively (forcing turnovers).
- OREB% / DREB% (Offensive/Defensive Rebound Rate): Percentage of available rebounds grabbed. Offensive rebounds create second-chance points; defensive rebounds end opponent possessions.
- FTR (Free Throw Rate): Free throws made per field goal attempt (FTM/FGA). Measures ability to get to the line AND convert. Higher is better offensively, lower is better defensively.
Other Metrics:
- Elo Rating: Chess-style rating system that updates based on game results and opponent strength. Higher Elo indicates stronger team.
- Efficiency Margin: Point differential per 100 possessions (Offensive Efficiency – Defensive Efficiency). Accounts for pace of play.
- MACD (Moving Average Convergence Divergence): Trend indicator comparing 12-game and 26-game exponential moving averages. Positive MACD = improving trend, Negative MACD = declining trend.
Analysis powered by HoopSci’s advanced metrics and MACD trending indicators.