WAC Update: Week 1
November 9, 2026Strongest Offensive Trends
- Austin Peay, Off Reb Pct, Up, Trend Strength: 0.038 – The improvement observed in Austin Peay’s offensive rebounding percentage suggests an emerging tactical advantage that is helping to sustain possession and generate additional scoring opportunities early in the season.
- Abil Christian, Off Reb Pct, Down, Trend Strength: -0.028 – Abil Christian is facing a concerning decline in its ability to grab rebounds off the opponent, a struggle that could negatively impact their overall defensive stability as the season unfolds.
- Cent Arkansas, Off Reb Pct, Down, Trend Strength: -0.024 – Cent Arkansas is struggling with a declining tendency on offensive rebounds throughout the season opener, indicating a difficulty in securing second-chance possessions that contributes negatively to their overall performance evaluation.
- UT Arlington, Off Reb Pct, Up, Trend Strength: 0.018 – UT Arlington has shown marked improvement in its ability to secure rebounds off the glass.
- E Kentucky, Shooting, Up, Trend Strength: 0.015 – East Kentucky is showing a promising upward trend in shooting that serves to boost their overall offensive efficiency throughout the season’s early games.
Strongest Defensive Trends
- Tarleton, Opp Turnovers, Down, Trend Strength: -0.019 – As Tarleton begins its season, a concerning rhythm has taken hold where rival teams consistently escape turning the ball over, highlighting a defensive vulnerability that demands immediate correction before the slate of contests intensifies.
- E Kentucky, Opp Shooting, Up, Trend Strength: 0.019 – E Kentucky is facing growing concerns as their defense struggles to contain opponents, allowing increased offensive production from opposing teams throughout the season’s initial slate of games.
- Cent Arkansas, Def Reb Pct, Down, Trend Strength: -0.012 – Cent Arkansas is finding itself in trouble defensively as its ability to secure rebounds on the glass deteriorates, allowing the opposition to generate second chances with greater frequency.
- Cent Arkansas, Opp Shooting, Down, Trend Strength: -0.011 – Cent Arkansas is demonstrating improvement by increasingly suppressing their opponents’ offensive efficiency.
- E Kentucky, Opp Turnovers, Down, Trend Strength: -0.009 – East Kentucky is struggling with ball security, as their ability to force opponent turnovers has declined while they continue to surrender more live-ball mistakes.
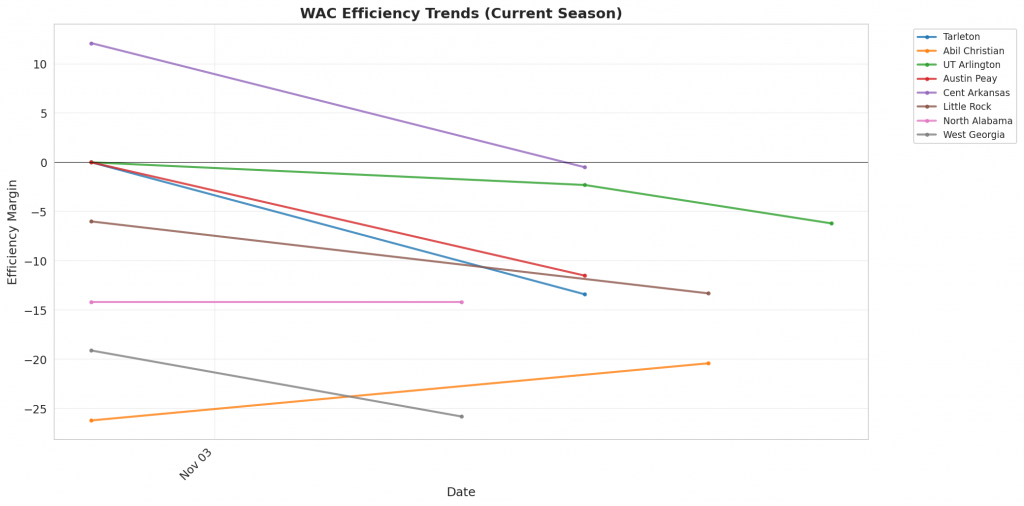
Figure 1: Efficiency margin trends for WAC teams throughout the season. Teams trending upward show improving performance, while downward trends indicate struggles.
Conference Snapshot
- Week Dates: November 02 – November 08, 2026
- Trending Up (Efficiency): Tarleton, Abil Christian, E Kentucky, North Alabama
- Trending Down (Efficiency): UT Arlington, Austin Peay, Cent Arkansas, Little Rock, West Georgia
Team-by-Team Analysis
Abil Christian
Record: 1-1 | Elo: 1455.3 (ranked 256 of 365) | Efficiency Margin: -20.45 (ranked 317 of 365)
Offensive Trends:
- Off Reb Pct (Offensive Rebounding): Currently ranked 251 of 365 in D1. Trending down strongly 🔴.
- Turnovers (Turnovers): Currently ranked 268 of 365 in D1. Trending down moderately 🟢.
Defensive Trends:
- Opp Shooting (Opp Shooting): Currently ranked 353 of 365 in D1. Trending up moderately 🔴.
- Opp Turnovers (Opp Turnovers): Currently ranked 66 of 365 in D1. Trending down moderately 🔴.
Austin Peay
Record: 1-1 | Elo: 1523.7 (ranked 143 of 365) | Efficiency Margin: -11.53 (ranked 241 of 365)
Offensive Trends:
- Off Reb Pct (Offensive Rebounding): Currently ranked 318 of 365 in D1. Trending up strongly 🟢.
- Shooting (Shooting): Currently ranked 261 of 365 in D1. Trending down moderately 🔴.
Defensive Trends:
- Opp Shooting (Opp Shooting): Currently ranked 158 of 365 in D1. Trending up moderately 🔴.
- Opp Turnovers (Opp Turnovers): Currently ranked 43 of 365 in D1. Trending down moderately 🔴.
Cent Arkansas
Record: 1-1 | Elo: 1501.5 (ranked 188 of 365) | Efficiency Margin: -0.47 (ranked 164 of 365)
Offensive Trends:
- Off Reb Pct (Offensive Rebounding): Currently ranked 351 of 365 in D1. Trending down strongly 🔴.
- Turnovers (Turnovers): Currently ranked 264 of 365 in D1. Trending up moderately 🔴.
Defensive Trends:
- Opp Shooting (Opp Shooting): Currently ranked 96 of 365 in D1. Trending down strongly 🟢.
- Def Reb Pct (Defensive Rebounding): Currently ranked 165 of 365 in D1. Trending down strongly 🔴.
E Kentucky
Record: 2-0 | Elo: 1411.5 (ranked 290 of 365) | Efficiency Margin: -16.72 (ranked 308 of 365)
Offensive Trends:
- Shooting (Shooting): Currently ranked 34 of 365 in D1. Trending up strongly 🟢.
- Off Reb Pct (Offensive Rebounding): Currently ranked 1 of 365 in D1. Trending up strongly 🟢.
Defensive Trends:
- Opp Shooting (Opp Shooting): Currently ranked 307 of 365 in D1. Trending up strongly 🔴.
- Opp Turnovers (Opp Turnovers): Currently ranked 302 of 365 in D1. Trending down strongly 🔴.
Little Rock
Record: 0-2 | Elo: 1416.7 (ranked 314 of 365) | Efficiency Margin: -13.31 (ranked 255 of 365)
Offensive Trends:
- Turnovers (Turnovers): Currently ranked 233 of 365 in D1. Trending down moderately 🟢.
- Shooting (Shooting): Currently ranked 222 of 365 in D1. Trending down weakly 🔴.
Defensive Trends:
- Opp Turnovers (Opp Turnovers): Currently ranked 103 of 365 in D1. Trending down strongly 🔴.
- Opp Shooting (Opp Shooting): Currently ranked 303 of 365 in D1. Trending down moderately 🟢.
North Alabama
Record: 2-0 | Elo: 1443.9 (ranked 273 of 365) | Efficiency Margin: -14.18 (ranked 270 of 365)
Offensive Trends:
- Turnovers (Turnovers): Currently ranked 334 of 365 in D1. Trending up strongly 🔴.
- Off Reb Pct (Offensive Rebounding): Currently ranked 292 of 365 in D1. Trending up strongly 🟢.
Defensive Trends:
- Def Reb Pct (Defensive Rebounding): Currently ranked 149 of 365 in D1. Trending up moderately 🟢.
- Opp Shooting (Opp Shooting): Currently ranked 196 of 365 in D1. Trending down weakly 🟢.
Tarleton
Record: 1-1 | Elo: 1432.1 (ranked 289 of 365) | Efficiency Margin: -13.36 (ranked 257 of 365)
Offensive Trends:
- Shooting (Shooting): Currently ranked 105 of 365 in D1. Trending up moderately 🟢.
- Off Reb Pct (Offensive Rebounding): Currently ranked 167 of 365 in D1. Trending up moderately 🟢.
Defensive Trends:
- Opp Turnovers (Opp Turnovers): Currently ranked 97 of 365 in D1. Trending down strongly 🔴.
- Opp Shooting (Opp Shooting): Currently ranked 180 of 365 in D1. Trending down moderately 🟢.
UT Arlington
Record: 2-1 | Elo: 1506.0 (ranked 176 of 365) | Efficiency Margin: -6.21 (ranked 202 of 365)
Offensive Trends:
- Off Reb Pct (Offensive Rebounding): Currently ranked 191 of 365 in D1. Trending up strongly 🟢.
- Turnovers (Turnovers): Currently ranked 293 of 365 in D1. Trending down moderately 🟢.
Defensive Trends:
- Opp Turnovers (Opp Turnovers): Currently ranked 91 of 365 in D1. Trending up moderately 🟢.
- Opp Shooting (Opp Shooting): Currently ranked 207 of 365 in D1. Trending up weakly 🔴.
West Georgia
Record: 0-2 | Elo: 1433.9 (ranked 286 of 365) | Efficiency Margin: -25.78 (ranked 340 of 365)
Offensive Trends:
- Shooting (Shooting): Currently ranked 363 of 365 in D1. Trending down strongly 🔴.
- Turnovers (Turnovers): Currently ranked 263 of 365 in D1. Trending up moderately 🔴.
Defensive Trends:
- Opp Shooting (Opp Shooting): Currently ranked 197 of 365 in D1. Trending down moderately 🟢.
- Def Reb Pct (Defensive Rebounding): Currently ranked 94 of 365 in D1. Trending up moderately 🟢.
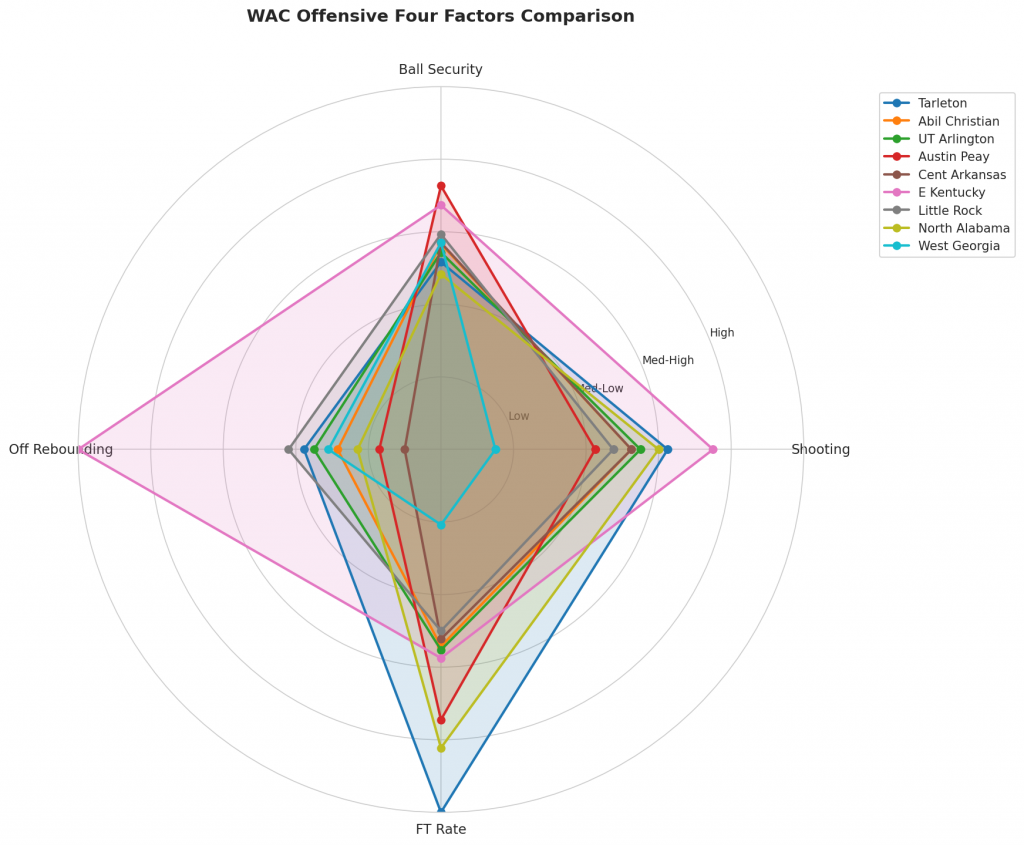
Figure 2: Offensive Four Factors comparison across WAC teams. The radar chart shows each team’s shooting efficiency (eFG%), ball security (TOV%), offensive rebounding (OREB%), and free throw generation (FT Rate).
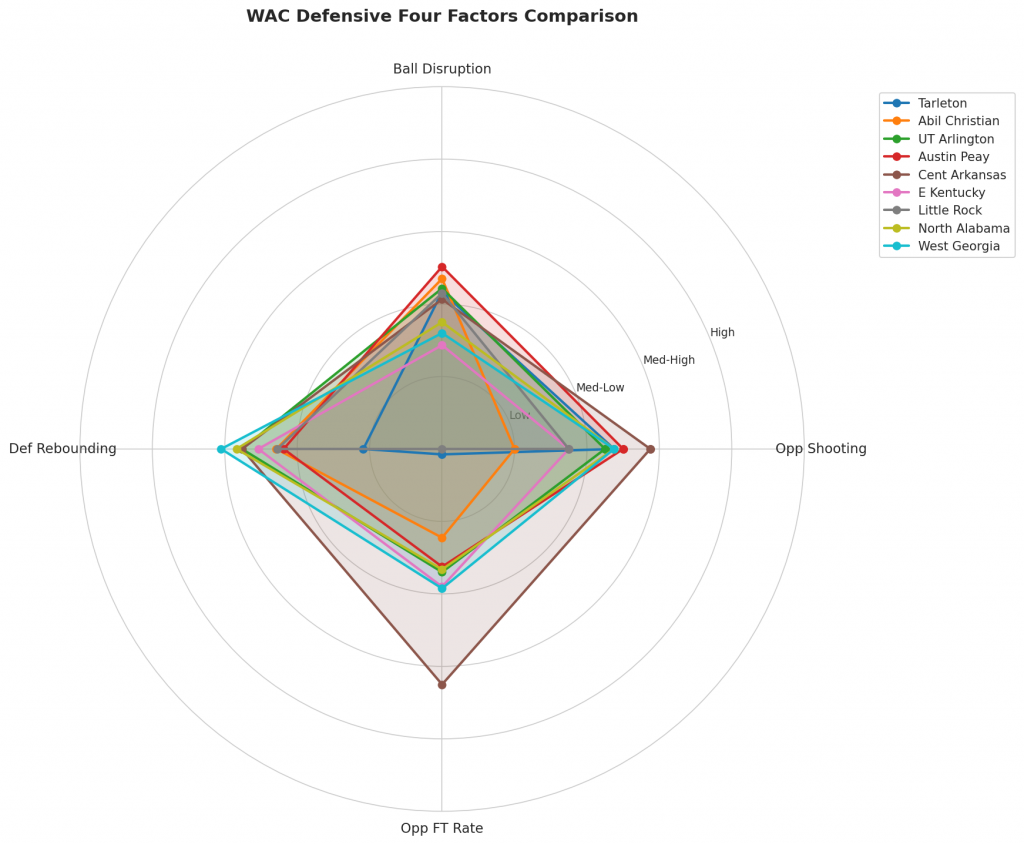
Figure 3: Defensive Four Factors comparison across WAC teams. The radar chart shows each team’s opponent shooting defense (Opp eFG%), ball disruption (forcing TOV%), defensive rebounding (DREB%), and opponent free throw prevention (Opp FT Rate).
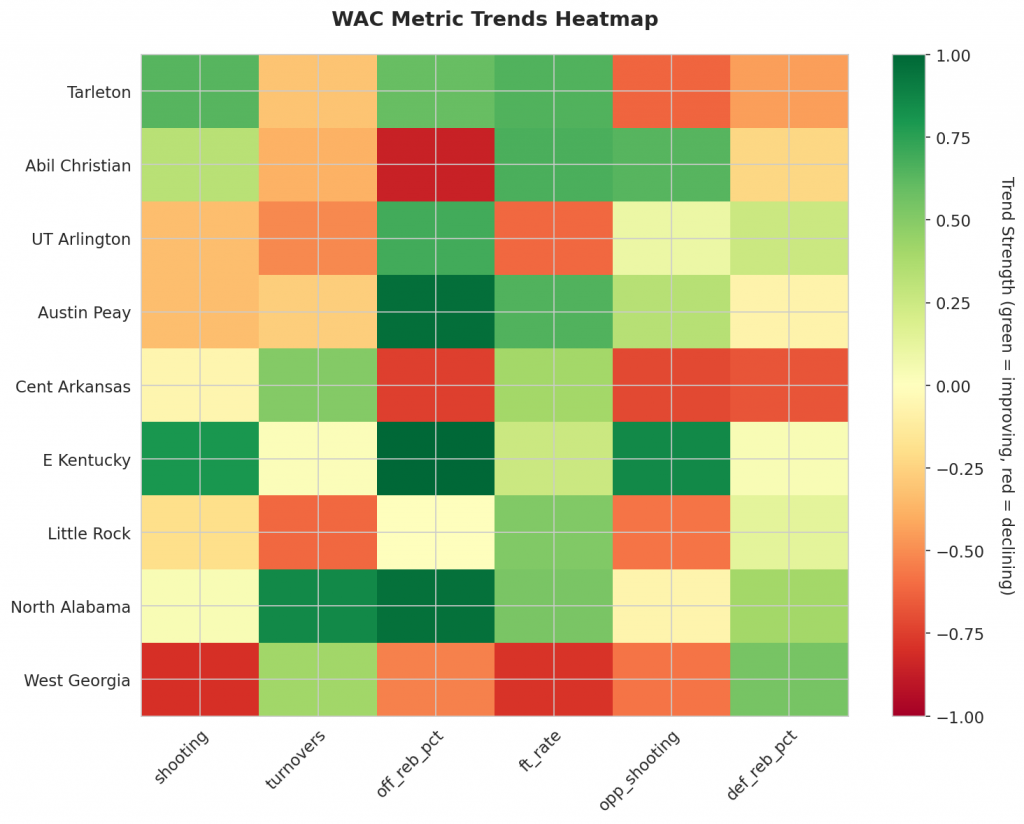
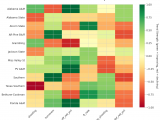
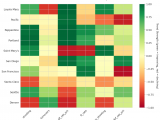
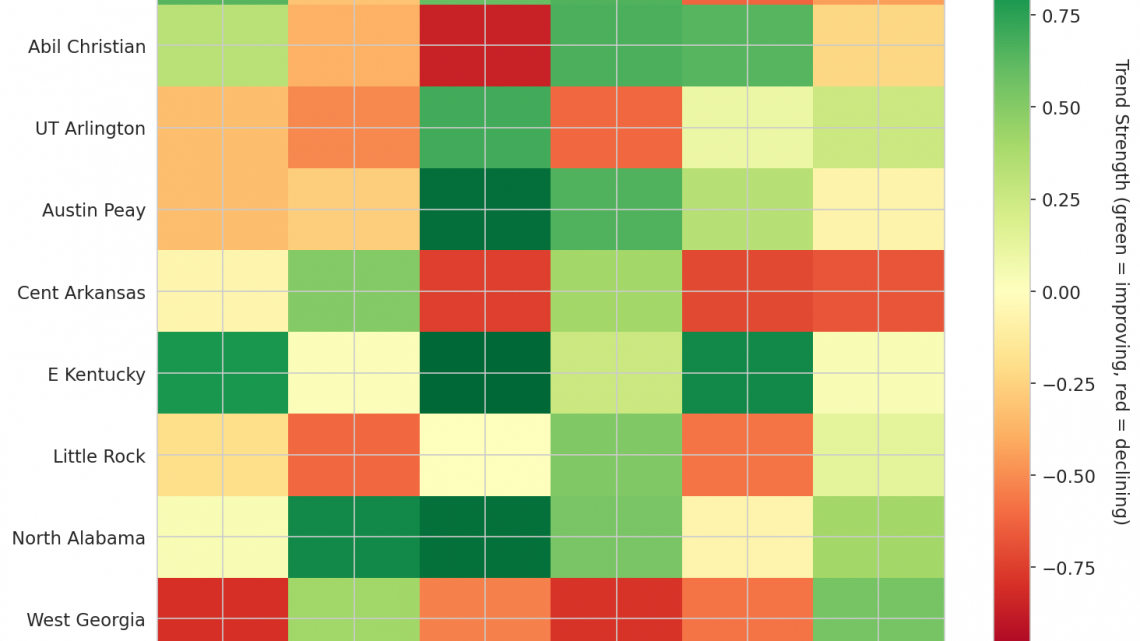
Figure 4: MACD trends heatmap showing which metrics are improving (green) or declining (red) for each team. Stronger colors indicate more pronounced trends.
Looking Ahead
As Western Athletic Conference teams continue their seasons, the MACD trending indicators serve as a vital diagnostic tool, separating genuine team improvement from unsustainable momentum. This Week 1 analysis evaluates specific metrics across the conference to determine which programs are building sustainable advantages and which are facing regression.
On the offensive front, rebounding efficiency proves to be a divergent metric across the league. UT Arlington stands out with its Offensive Rebounding Percentage trending strongly upward from a season average of 0.29, indicating a significant improvement in second-chance opportunities. Similarly, Austin Peay displays strong positive momentum in the same category, averaging 0.218 per game while improving its board-winning rate. Conversely, the trends are less favorable for Abil Christian and Cent Arkansas. Abil Christian’s Offensive Rebounding Percentage is trending strongly down from an average of 0.264, suggesting a worsening capability to secure extra possessions. Cent Arkansas faces an identical trajectory in this metric, with its average of 0.19 showing a strong downward trend that points to declining offensive rebounding value.
Defensively, the landscape reveals mixed signals regarding turnover generation and shot prevention. Tarleton shows a concerning trend where forcing opponent turnovers is moving strongly down from a season average of 0.18; this indicates a deterioration in their ability to disrupt opposing ball-handlers. In terms of allowing shooting percentage, Cent Arkansas has improved its defensive identity, with Opponent Shooting trending strongly down from an average of 0.47, though the magnitude of the MACD implies a high volume of change is driving this downward movement. However, they have compromised in the glass on the defensive end, as their Defensive Rebounding Percentage is trending strongly down from 0.721, meaning they are allowing significantly more offensive rebounds than their baseline suggests. Finally, Eastern Kentucky’s defense faces a negative outlook regarding shot suppression, with Opponent Shooting trending strongly up from a season average of 0.56, signaling that the team is currently giving up a high volume of shots as a percentage of field goal attempts.
These metrics provide a snapshot of early-season volatility. While some teams are finding rhythm in key areas like rebounding or shot prevention, others are exposing weaknesses in turnover generation and defensive efficiency. Investors and analysts should monitor how these strong trends stabilize or reverse as the season progresses.
Metrics Glossary
Four Factors (Dean Oliver’s framework for basketball success):
- eFG% (Effective Field Goal %): Field goal percentage adjusted for 3-pointers being worth more (FGM + 0.5×3PM) / FGA. Higher is better offensively, lower is better defensively.
- TOV% (Turnover Rate): Turnovers per 100 possessions. Lower is better offensively (taking care of the ball), higher is better defensively (forcing turnovers).
- OREB% / DREB% (Offensive/Defensive Rebound Rate): Percentage of available rebounds grabbed. Offensive rebounds create second-chance points; defensive rebounds end opponent possessions.
- FTR (Free Throw Rate): Free throws made per field goal attempt (FTM/FGA). Measures ability to get to the line AND convert. Higher is better offensively, lower is better defensively.
Other Metrics:
- Elo Rating: Chess-style rating system that updates based on game results and opponent strength. Higher Elo indicates stronger team.
- Efficiency Margin: Point differential per 100 possessions (Offensive Efficiency – Defensive Efficiency). Accounts for pace of play.
- MACD (Moving Average Convergence Divergence): Trend indicator comparing 12-game and 26-game exponential moving averages. Positive MACD = improving trend, Negative MACD = declining trend.
Analysis powered by HoopSci’s advanced metrics and MACD trending indicators.