West Coast Update: Week 1
November 9, 2026Strongest Offensive Trends
- Loyola Mary, Off Reb Pct, Up, Trend Strength: 0.072 – Loyola Mary is showing improvement in its offensive rebounding percentage, which should contribute to greater ball possession opportunities for the squad as the season progresses.
- Pacific, Off Reb Pct, Up, Trend Strength: 0.043 – The team at Pacific is demonstrating positive development in rebounding performance, which contributes to improved possession advantages throughout the early season slate.
- Pepperdine, Shooting, Up, Trend Strength: 0.023 – Pepperdine has shown marked improvement in its shooting metrics early in the season, contributing positively to overall offensive efficiency.
- Loyola Mary, Shooting, Up, Trend Strength: 0.01 – Loyola Mary has demonstrated a clear upward trajectory in its shooting performance, a factor that is actively contributing to improved offensive efficiency throughout the season.
- Loyola Mary, Turnovers, Down, Trend Strength: -0.01 – Loyola Mary has shown signs of improvement by reducing turnovers, a positive development that contributes to their growing offensive efficiency throughout the season.
Strongest Defensive Trends
- Pacific, Def Reb Pct, Down, Trend Strength: -0.022 – Pacific’s defense is facing a troubling struggle on the boards, where declining rebounding efforts are gifting opponents extra chances to secure offensive rebounds and effectively stifling their ability to maintain possession after shot attempts.
- San Diego, Def Reb Pct, Up, Trend Strength: 0.019 – San Diego has demonstrated an upward trajectory in its ability to secure defensive rebounds, showing clear progress in limiting opponents’ second-chance opportunities while stabilizing its own transition game.
- Saint Mary’s, Opp Shooting, Up, Trend Strength: 0.019 – Saint Mary’s has found it difficult to shut down opponents on defense, allowing them too much ease early in the season.
- Loyola Mary, Opp Shooting, Up, Trend Strength: 0.018 – Loyola Mary is grappling with a troubling decline in its defensive stability, as opponents are increasingly able to find their way through the line for scores that signal a concerning vulnerability ahead.
- San Diego, Opp Turnovers, Down, Trend Strength: -0.007 – San Diego is struggling with a troubling inability to force opponent turnovers, marking a negative trend in their offensive pressure since the start of the season.
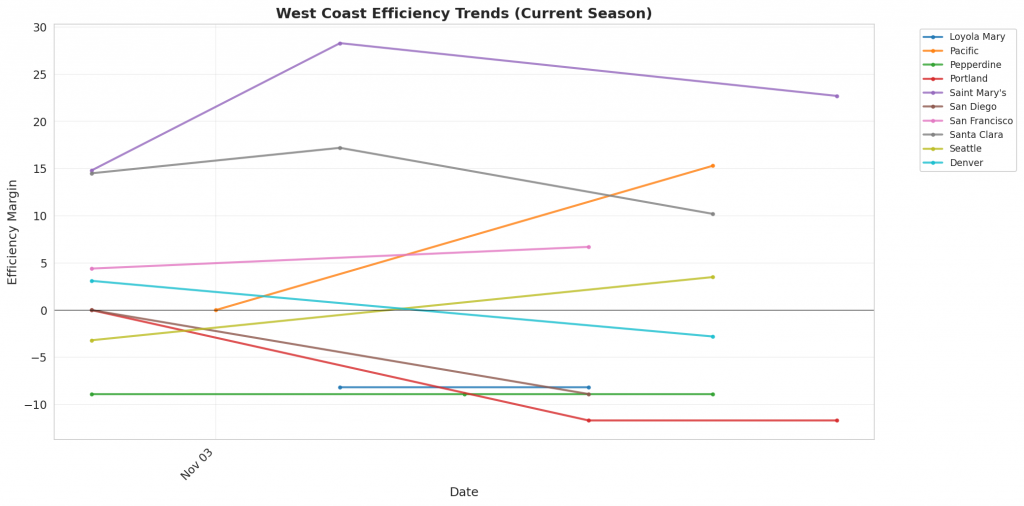
Figure 1: Efficiency margin trends for West Coast teams throughout the season. Teams trending upward show improving performance, while downward trends indicate struggles.
Conference Snapshot
- Week Dates: November 02 – November 08, 2026
- Trending Up (Efficiency): Loyola Mary, Pepperdine, Portland, Saint Mary’s, San Diego
- Trending Down (Efficiency): Pacific, Santa Clara, Denver
Team-by-Team Analysis
Denver
Record: 0-2 | Elo: 1432.1 (ranked 290 of 365) | Efficiency Margin: -2.76 (ranked 175 of 365)
Offensive Trends:
- Shooting (Shooting): Currently ranked 271 of 365 in D1. Trending down strongly 🔴.
- Turnovers (Turnovers): Currently ranked 305 of 365 in D1. Trending up strongly 🔴.
Defensive Trends:
- Opp Shooting (Opp Shooting): Currently ranked 76 of 365 in D1. Trending down strongly 🟢.
- Opp Turnovers (Opp Turnovers): Currently ranked 350 of 365 in D1. Trending down moderately 🔴.
Loyola Mary
Record: 1-1 | Elo: 1452.8 (ranked 262 of 365) | Efficiency Margin: -8.21 (ranked 219 of 365)
Offensive Trends:
- Shooting (Shooting): Currently ranked 80 of 365 in D1. Trending up strongly 🟢.
- Turnovers (Turnovers): Currently ranked 204 of 365 in D1. Trending down strongly 🟢.
Defensive Trends:
- Opp Shooting (Opp Shooting): Currently ranked 305 of 365 in D1. Trending up strongly 🔴.
- Opp Turnovers (Opp Turnovers): Currently ranked 277 of 365 in D1. Trending down moderately 🔴.
Pacific
Record: 2-0 | Elo: 1470.7 (ranked 237 of 365) | Efficiency Margin: +15.34 (ranked 73 of 365)
Offensive Trends:
- Off Reb Pct (Offensive Rebounding): Currently ranked 58 of 365 in D1. Trending up strongly 🟢.
- Shooting (Shooting): Currently ranked 190 of 365 in D1. Trending down weakly 🔴.
Defensive Trends:
- Def Reb Pct (Defensive Rebounding): Currently ranked 220 of 365 in D1. Trending down strongly 🔴.
- Opp Shooting (Opp Shooting): Currently ranked 38 of 365 in D1. Trending down moderately 🟢.
Pepperdine
Record: 2-1 | Elo: 1386.1 (ranked 342 of 365) | Efficiency Margin: -8.85 (ranked 224 of 365)
Offensive Trends:
- Shooting (Shooting): Currently ranked 218 of 365 in D1. Trending up strongly 🟢.
- Off Reb Pct (Offensive Rebounding): Currently ranked 74 of 365 in D1. Trending up strongly 🟢.
Defensive Trends:
- Opp Shooting (Opp Shooting): Currently ranked 327 of 365 in D1. Trending up moderately 🔴.
- Opp Turnovers (Opp Turnovers): Currently ranked 87 of 365 in D1. Trending up moderately 🟢.
Portland
Record: 2-1 | Elo: 1438.5 (ranked 277 of 365) | Efficiency Margin: -11.67 (ranked 242 of 365)
Offensive Trends:
- Shooting (Shooting): Currently ranked 68 of 365 in D1. Trending up strongly 🟢.
- Off Reb Pct (Offensive Rebounding): Currently ranked 278 of 365 in D1. Trending up strongly 🟢.
Defensive Trends:
- Opp Turnovers (Opp Turnovers): Currently ranked 186 of 365 in D1. Trending down moderately 🔴.
- Opp Shooting (Opp Shooting): Currently ranked 298 of 365 in D1. Trending down weakly 🟢.
Saint Mary’s
Record: 2-1 | Elo: 1677.5 (ranked 13 of 365) | Efficiency Margin: +22.72 (ranked 40 of 365)
Offensive Trends:
- Shooting (Shooting): Currently ranked 16 of 365 in D1. Trending up strongly 🟢.
- Off Reb Pct (Offensive Rebounding): Currently ranked 232 of 365 in D1. Trending down strongly 🔴.
Defensive Trends:
- Opp Shooting (Opp Shooting): Currently ranked 262 of 365 in D1. Trending up strongly 🔴.
- Opp Turnovers (Opp Turnovers): Currently ranked 189 of 365 in D1. Trending up moderately 🟢.
San Diego
Record: 2-0 | Elo: 1403.7 (ranked 320 of 365) | Efficiency Margin: -8.87 (ranked 225 of 365)
Offensive Trends:
- Off Reb Pct (Offensive Rebounding): Currently ranked 47 of 365 in D1. Trending up strongly 🟢.
- Shooting (Shooting): Currently ranked 210 of 365 in D1. Trending up weakly 🟢.
Defensive Trends:
- Opp Turnovers (Opp Turnovers): Currently ranked 62 of 365 in D1. Trending down strongly 🔴.
- Def Reb Pct (Defensive Rebounding): Currently ranked 282 of 365 in D1. Trending up strongly 🟢.
San Francisco
Record: 2-0 | Elo: 1553.3 (ranked 96 of 365) | Efficiency Margin: +6.74 (ranked 114 of 365)
Offensive Trends:
- Shooting (Shooting): Currently ranked 109 of 365 in D1. Trending up moderately 🟢.
- Turnovers (Turnovers): Currently ranked 142 of 365 in D1. Trending down weakly 🟢.
Defensive Trends:
- Opp Turnovers (Opp Turnovers): Currently ranked 105 of 365 in D1. Trending up strongly 🟢.
- Def Reb Pct (Defensive Rebounding): Currently ranked 205 of 365 in D1. Trending down strongly 🔴.
Santa Clara
Record: 3-0 | Elo: 1633.3 (ranked 37 of 365) | Efficiency Margin: +10.25 (ranked 103 of 365)
Offensive Trends:
- Shooting (Shooting): Currently ranked 133 of 365 in D1. Trending down strongly 🔴.
- Off Reb Pct (Offensive Rebounding): Currently ranked 134 of 365 in D1. Trending down moderately 🔴.
Defensive Trends:
- Opp Shooting (Opp Shooting): Currently ranked 56 of 365 in D1. Trending down moderately 🟢.
- Opp Turnovers (Opp Turnovers): Currently ranked 67 of 365 in D1. Trending down moderately 🔴.
Seattle
Record: 1-1 | Elo: 1525.6 (ranked 141 of 365) | Efficiency Margin: +3.53 (ranked 132 of 365)
Offensive Trends:
- Shooting (Shooting): Currently ranked 82 of 365 in D1. Trending up strongly 🟢.
- Off Reb Pct (Offensive Rebounding): Currently ranked 267 of 365 in D1. Trending down strongly 🔴.
Defensive Trends:
- Def Reb Pct (Defensive Rebounding): Currently ranked 92 of 365 in D1. Trending up moderately 🟢.
- Opp Shooting (Opp Shooting): Currently ranked 119 of 365 in D1. Trending up weakly 🔴.
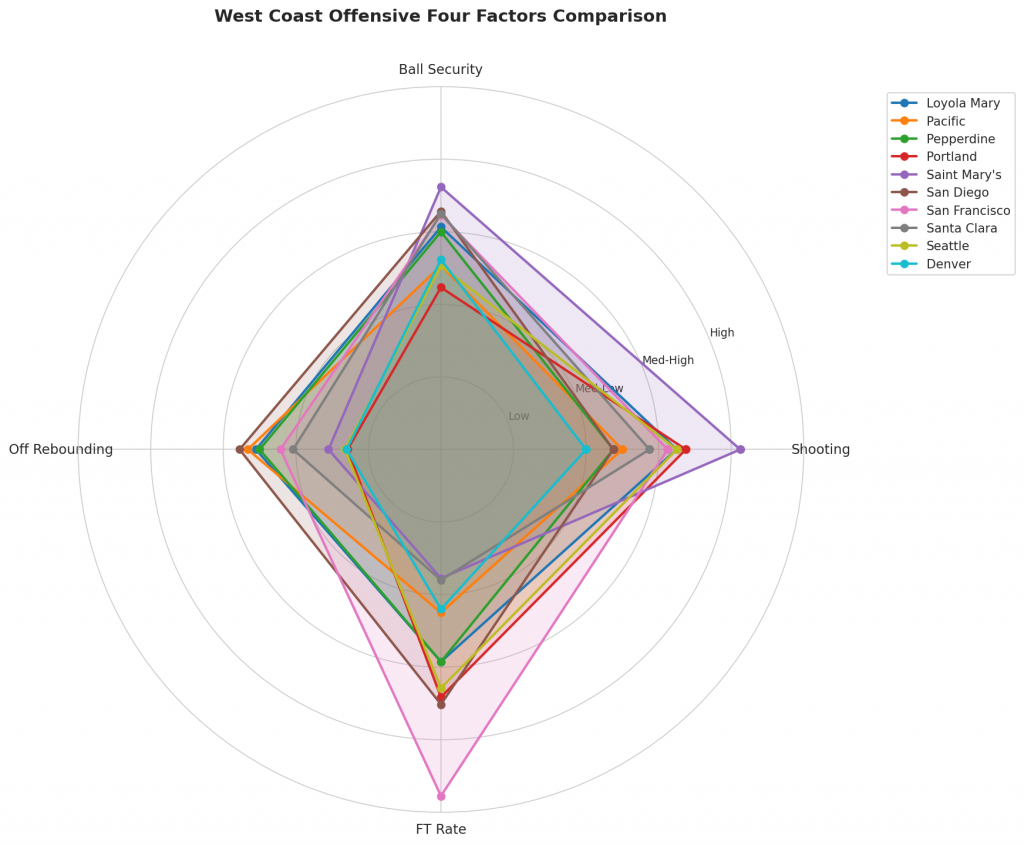
Figure 2: Offensive Four Factors comparison across West Coast teams. The radar chart shows each team’s shooting efficiency (eFG%), ball security (TOV%), offensive rebounding (OREB%), and free throw generation (FT Rate).
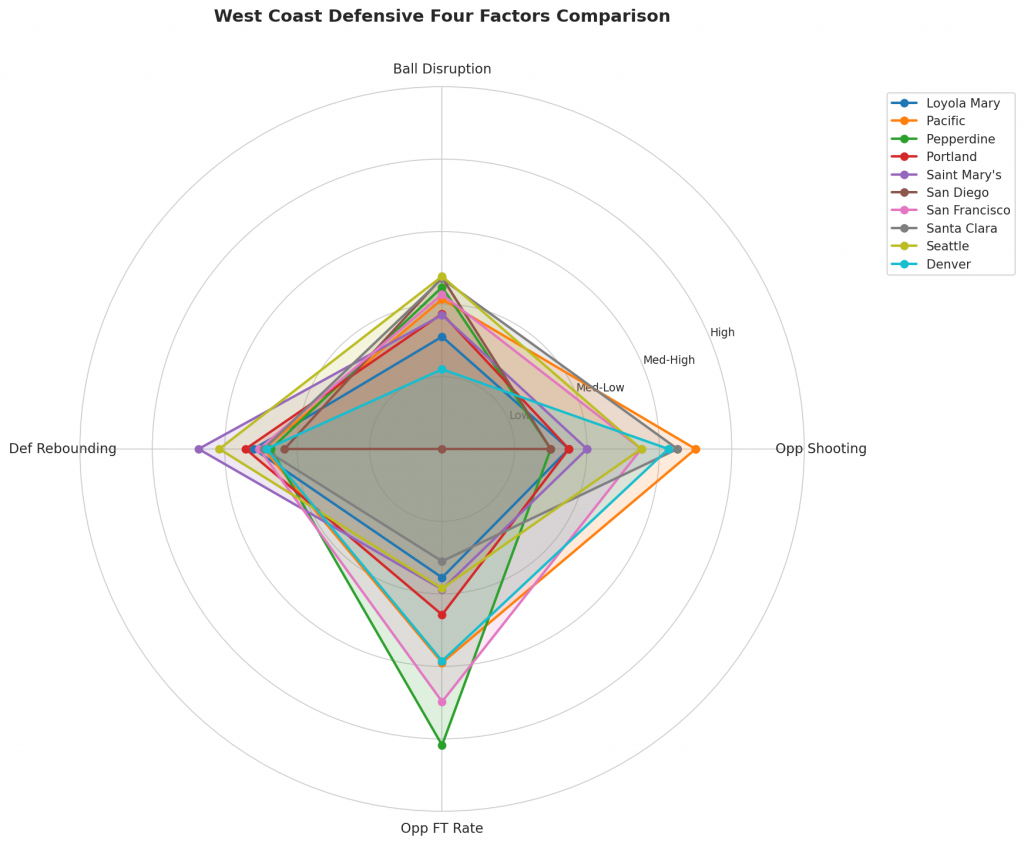
Figure 3: Defensive Four Factors comparison across West Coast teams. The radar chart shows each team’s opponent shooting defense (Opp eFG%), ball disruption (forcing TOV%), defensive rebounding (DREB%), and opponent free throw prevention (Opp FT Rate).
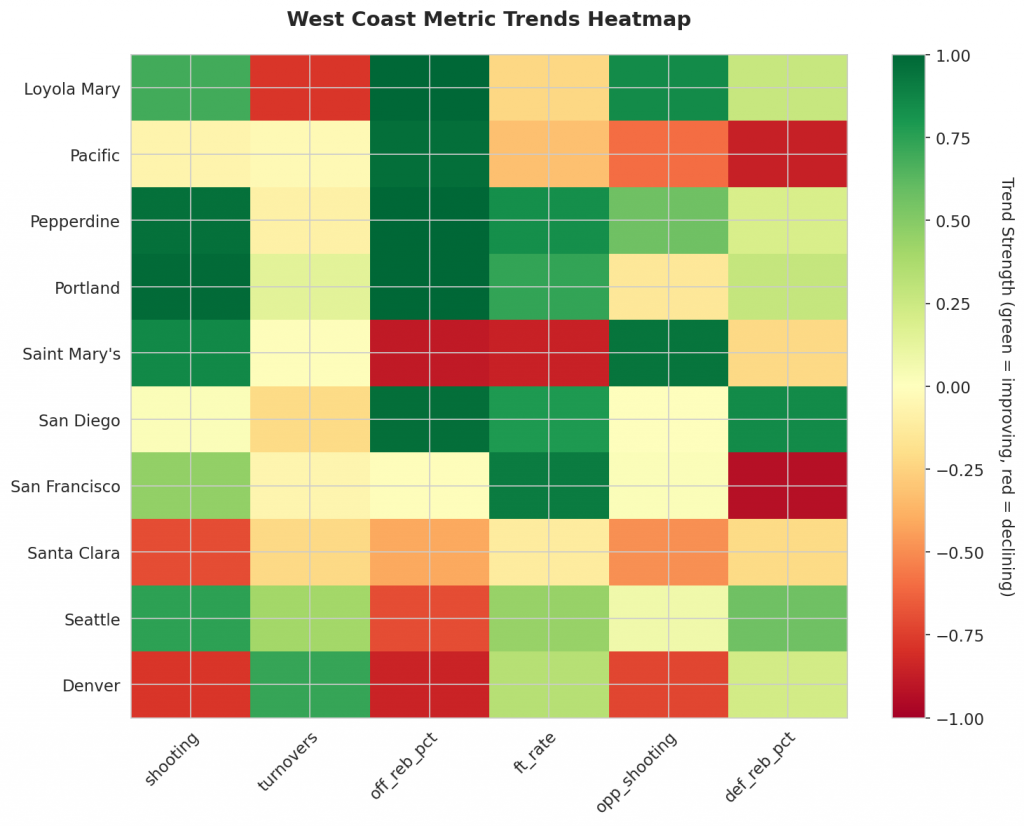
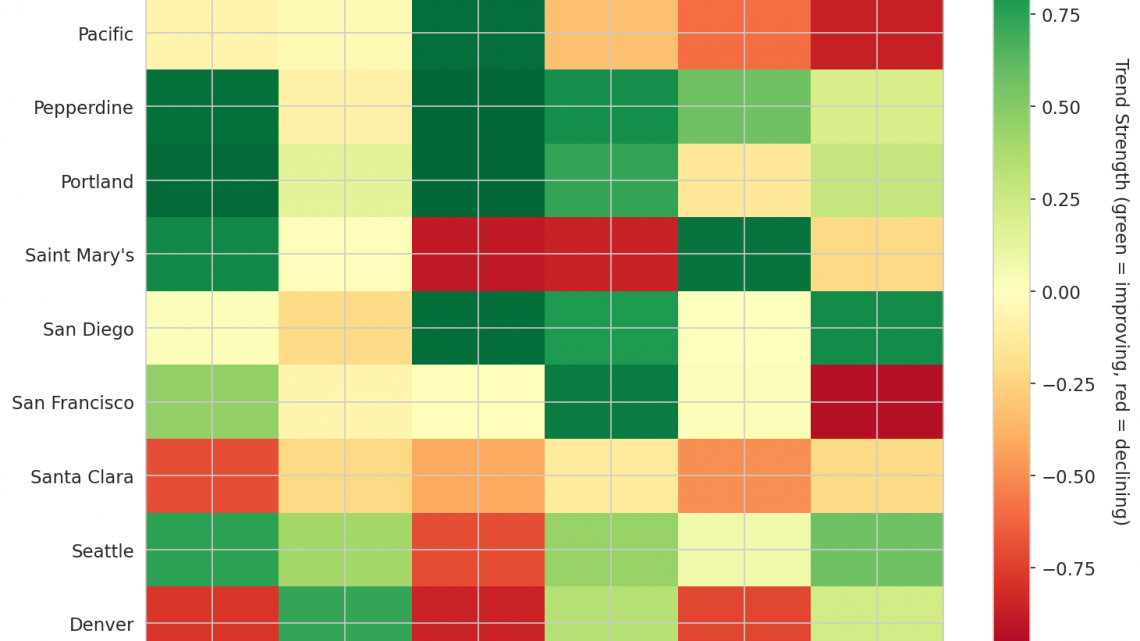
Figure 4: MACD trends heatmap showing which metrics are improving (green) or declining (red) for each team. Stronger colors indicate more pronounced trends.
Looking Ahead
The Mid-American Conference Data (MACD) trending indicators have provided a critical lens through which to evaluate the West Coast teams’ early-season performances. As these programs continue their campaigns, distinguishing between genuine improvement and unsustainable momentum becomes essential. The following analysis prioritizes key offensive and defensive metrics that define the trajectory for each squad.
Loyola Mary: Offensive Stability and Improvement
Loyola Mary presents a compelling case of multifaceted improvement. The team’s shooting efficiency sits at a season average of 0.56, with the MACD indicator showing a strong upward trend, signaling that offensive production is increasing rather than fading. Concurrently, ball security has reached new heights; turnovers are trending strongly downward from a season average of 0.166, indicating effective poise and decision-making. On the glass, Loyola Mary continues to dominate second-chance opportunities, with offensive rebound percentage trending strongly up from a 0.354 season average. This combination of enhanced shooting, reduced turnovers, and improved rebounding suggests a sustainable rise in overall team capability.
Pacific: Offensive Rebounding Strength
Pacific has focused heavily on interior presence, evidenced by their offensive rebound percentage trend. Starting from a season average of 0.363, this metric is trending strongly upward. This persistent pressure on the opposing paint provides Pacific with additional scoring chances and limits the opponent’s field goal opportunities, marking a significant positive development in their game plan.
Saint Mary’s: Defensive Concerns
While offensive output can fluctuate, defensive consistency is paramount for late-season success. Saint Mary’s faces a challenging trend regarding opponent efficiency. Their opponents’ shooting percentage sits at 0.54 but is trending strongly upward. This deterioration suggests that the defense is becoming less effective at limiting high-percentage shots, potentially leaving gaps in the scheme that must be addressed to avoid stagnation.
San Diego: Defensive Decline in Turnover Generation
Contrastingly, San Diego is grappling with a specific defensive issue regarding forcing turnovers. Their season average for opponent turnover generation stands at 0.192, yet this metric is trending strongly downward. This trend means the team is currently forcing fewer turnovers than their baseline performance would suggest. While forcing turnovers remains an intangible asset, the declining rate indicates a potential erosion in defensive pressure that could be exploited by opponents in tight contests.
Pacific: Defensive Rebounding Slump
Finally, Pacific shows weakness on the other end of the floor. Their defensive rebound percentage is high at 0.697 but is trending strongly downward. This shift means the team is allowing more offensive boards to their opponents, which directly leads to increased second-chance points for foes and reduced efficiency for Pacific’s own defense.
Conclusion
The MACD metrics reveal a clear divergence between teams riding sustainable improvements and those facing emerging liabilities. While Loyola Mary benefits from simultaneous gains in shooting, turnover reduction, and rebounding, other programs must monitor their defensive stability. Teams trending up strongly in positive metrics are generally on a path to sustained success, whereas trends showing worsening efficiency, such as increased opponent shooting or decreased forced turnovers, serve as early warning signs for upcoming challenges.
Metrics Glossary
Four Factors (Dean Oliver’s framework for basketball success):
- eFG% (Effective Field Goal %): Field goal percentage adjusted for 3-pointers being worth more (FGM + 0.5×3PM) / FGA. Higher is better offensively, lower is better defensively.
- TOV% (Turnover Rate): Turnovers per 100 possessions. Lower is better offensively (taking care of the ball), higher is better defensively (forcing turnovers).
- OREB% / DREB% (Offensive/Defensive Rebound Rate): Percentage of available rebounds grabbed. Offensive rebounds create second-chance points; defensive rebounds end opponent possessions.
- FTR (Free Throw Rate): Free throws made per field goal attempt (FTM/FGA). Measures ability to get to the line AND convert. Higher is better offensively, lower is better defensively.
Other Metrics:
- Elo Rating: Chess-style rating system that updates based on game results and opponent strength. Higher Elo indicates stronger team.
- Efficiency Margin: Point differential per 100 possessions (Offensive Efficiency – Defensive Efficiency). Accounts for pace of play.
- MACD (Moving Average Convergence Divergence): Trend indicator comparing 12-game and 26-game exponential moving averages. Positive MACD = improving trend, Negative MACD = declining trend.
Analysis powered by HoopSci’s advanced metrics and MACD trending indicators.