Week 1: The Dial-Up Report
November 9, 2026Weekly Feature: Identifying the “Dial-Up” Teams in Division I Basketball
In the landscape of Division I basketball, performance inconsistency is a recurring narrative. Some squads exhibit a distinct dichotomy in their output: they rise to meet top-tier competition with tournament-caliber intensity only to seemingly sleepwalk against inferior opponents. This week’s analysis from HoopSci.com isolates these anomalies within the weekly standings.
The focus remains on the “Dial-Up” designation, applied to teams that effectively overperform against strong adversaries while underperforming when facing weaker ones. By strictly examining this metric, we can assess which squads play strictly to the level of their competition, regardless of whether that performance aligns with their potential ceiling.
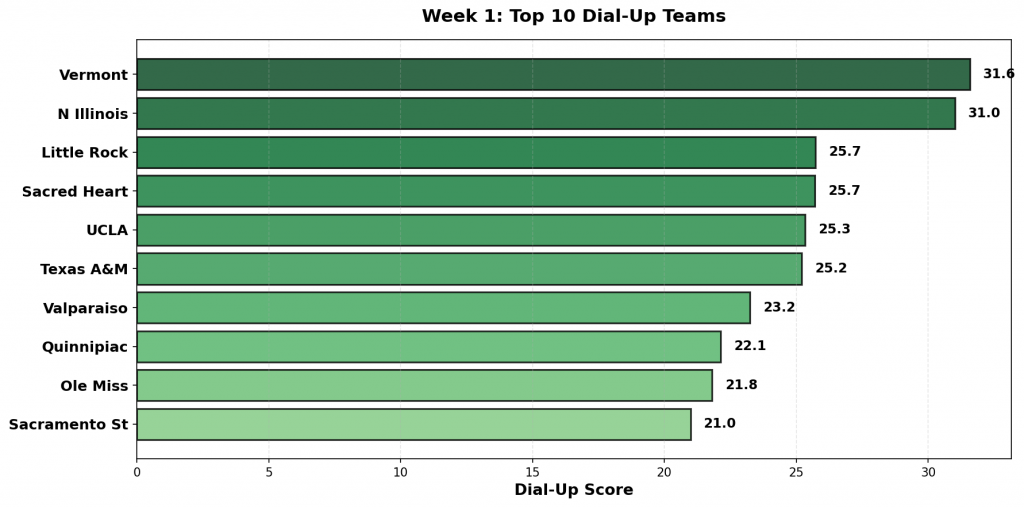
According to the weekly data for Week 1, three programs currently lead the rankings as the top “Dial-Up” teams: Vermont, N Illinois, and Little Rock. These entries indicate a pattern where the outcome of the game is heavily influenced by the perceived strength of the opposing roster rather than a consistent baseline of execution.
Figure 1: Top 10 teams with the highest Dial-Up scores in Week 1. Scores reflect the combination of overperformance against strong opponents and underperformance against weak ones.
#1: Vermont (1-2)
Against #177 Fairfield, #124 Vermont pulled off a big win, 79-67. The model expected a margin of 3, but they performed 9 points better than projected. Facing #187 Quinnipiac, #124 Vermont suffered a bad loss, 76-79. Favored by 19, they underperformed by 22 points.
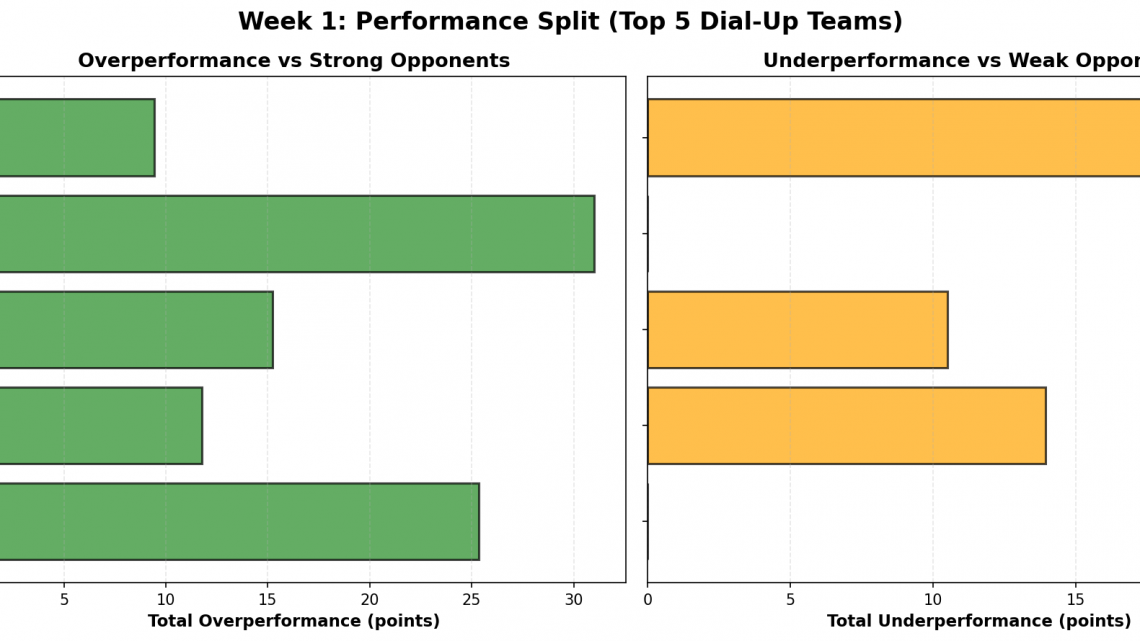
Dial-Up Metrics: Exceeded projections by 9.4 total points against strong opponents (1 games); underperformed by 22.1 points against weak competition (1 games).
#2: N Illinois (1-2)
Against #138 Dayton, #208 N Illinois pulled off a big win, 81-76. The model expected a margin of -26, but they performed outpacing the projection by 31.
Dial-Up Metrics: Exceeded projections by 31.0 total points against strong opponents (1 games).
#3: Little Rock (0-2)
Against #113 VCU, #224 Little Rock battled tough in a 72-82 loss. The model expected a margin of -25, but they performed beating the line by 15. Facing #239 SE Louisiana, #224 Little Rock suffered a bad loss, 79-83. Favored by 6, they underperformed by 10 points.
Dial-Up Metrics: Exceeded projections by 15.2 total points against strong opponents (1 games); underperformed by 10.5 points against weak competition (1 games).
#4: Sacred Heart (2-1)
Against #143 New Hampshire, #245 Sacred Heart pulled off a big win, 81-76. The model expected a margin of -7, but they performed +12 versus projection. Facing #252 Maine, #245 Sacred Heart suffered a bad loss, 72-74. Favored by 12, they underperformed by 14 points.
Dial-Up Metrics: Exceeded projections by 11.8 total points against strong opponents (1 games); underperformed by 14.0 points against weak competition (1 games).
#5: UCLA (2-0)
Against #111 Arizona, #14 UCLA pulled off a big win, 84-75. The model expected a margin of -16, but they performed 25 points better than projected.
Dial-Up Metrics: Exceeded projections by 25.3 total points against strong opponents (1 games).
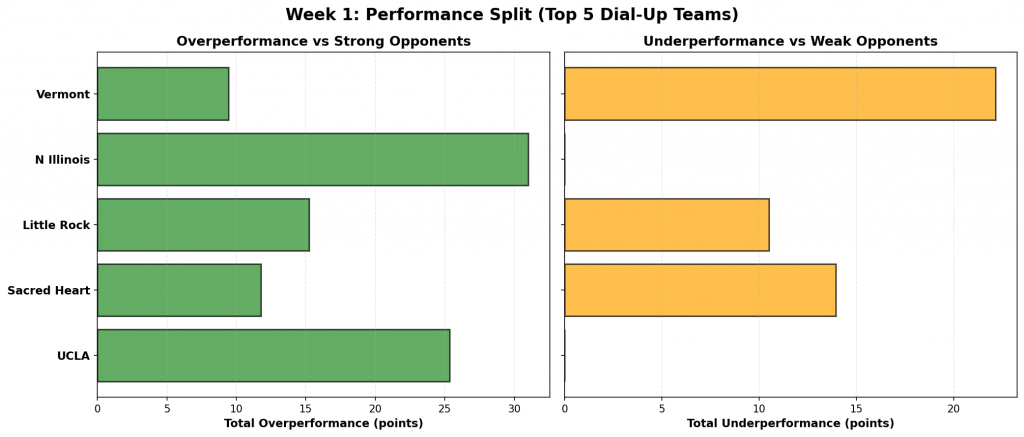
Figure 2: Performance comparison for the top 5 Dial-Up teams. Green bars show total overperformance against strong opponents; orange bars show total underperformance against weak opponents.
#6: Texas A&M (2-0)
Against #168 Northern Kentucky, #45 Texas A&M pulled off a big win, 104-67. The model expected a margin of 12, but they performed outpacing the projection by 25.
Dial-Up Metrics: Exceeded projections by 25.2 total points against strong opponents (1 games).
#7: Valparaiso (2-0)
Against #126 Purdue, #63 Valparaiso pulled off a big win, 83-80. The model expected a margin of -18, but they performed beating the line by 22. Facing #339 Western Illinois, #63 Valparaiso struggled to put away Western Illinois, winning just 80-58. Favored by 24, they underperformed by 2 points.
Dial-Up Metrics: Exceeded projections by 21.5 total points against strong opponents (1 games); underperformed by 1.7 points against weak competition (1 games).
#8: Quinnipiac (2-1)
Against #124 Vermont, #187 Quinnipiac pulled off a big win, 79-76. The model expected a margin of -19, but they performed +22 versus projection.
Dial-Up Metrics: Exceeded projections by 22.1 total points against strong opponents (1 games).
#9: Ole Miss (2-0)
Against #153 Central Arkansas, #64 Ole Miss pulled off a big win, 92-60. The model expected a margin of 10, but they performed 22 points better than projected.
Dial-Up Metrics: Exceeded projections by 21.8 total points against strong opponents (1 games).
#10: Sacramento St (1-1)
Against #117 Santa Clara, #180 Sacramento St battled tough in a 77-83 loss. The model expected a margin of -27, but they performed outpacing the projection by 21.
Dial-Up Metrics: Exceeded projections by 21.0 total points against strong opponents (1 games).
#11: Boston College (2-0)
Against #158 Massachusetts, #36 Boston College pulled off a big win, 71-55. The model expected a margin of -3, but they performed beating the line by 19.
Dial-Up Metrics: Exceeded projections by 18.8 total points against strong opponents (1 games).
#12: North Texas (2-0)
Against #103 McNeese, #130 North Texas pulled off a big win, 77-67. The model expected a margin of -7, but they performed +17 versus projection.
Dial-Up Metrics: Exceeded projections by 17.2 total points against strong opponents (1 games).
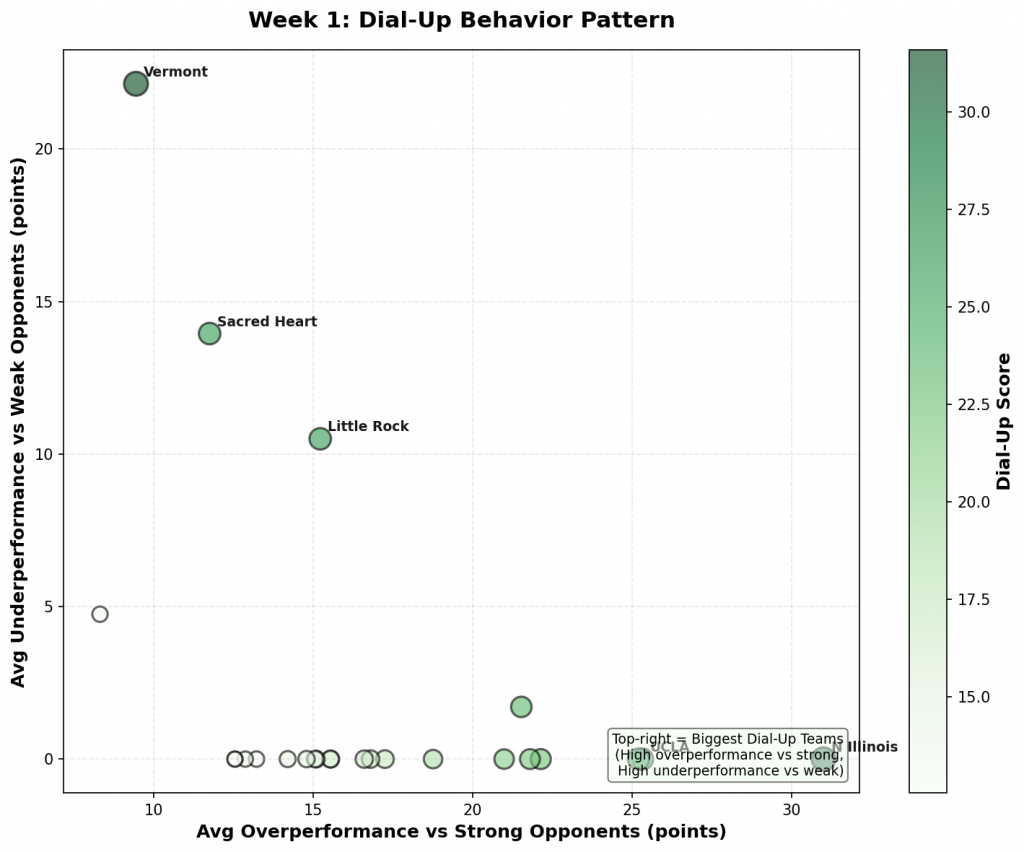
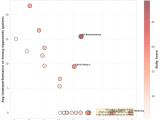
Figure 3: Scatter plot showing the relationship between overperformance against strong opponents (x-axis) and underperformance against weak opponents (y-axis). Bubble size and color indicate Dial-Up score magnitude. Top-right quadrant represents the biggest Dial-Up teams.
#13: Boise State (2-0)
Against #91 Butler, #19 Boise State pulled off a big win, 100-81. The model expected a margin of 2, but they performed 17 points better than projected.
Dial-Up Metrics: Exceeded projections by 16.8 total points against strong opponents (1 games).
#14: Bellarmine (0-3)
Against #122 Miami (OH), #312 Bellarmine battled tough in a 73-80 loss. The model expected a margin of -32, but they performed outpacing the projection by 25.
Dial-Up Metrics: Exceeded projections by 33.2 total points against strong opponents (2 games).
#15: Youngstown St (1-1)
Against #72 St. Bonaventure, #131 Youngstown St pulled off a big win, 79-71. The model expected a margin of -8, but they performed beating the line by 16.
Dial-Up Metrics: Exceeded projections by 15.5 total points against strong opponents (1 games).
#16: Lafayette (1-2)
Against #182 Saint Joseph’s, #241 Lafayette battled tough in a 57-67 loss. The model expected a margin of -26, but they performed +16 versus projection.
Dial-Up Metrics: Exceeded projections by 15.5 total points against strong opponents (1 games).
#17: USC (2-0)
Against #142 Wichita State, #37 USC pulled off a big win, 93-86. The model expected a margin of -8, but they performed 15 points better than projected.
Dial-Up Metrics: Exceeded projections by 15.1 total points against strong opponents (1 games).
#18: FGCU (1-1)
Against #160 UCF, #109 FGCU battled tough in a 95-96 loss. The model expected a margin of -16, but they performed outpacing the projection by 15.
Dial-Up Metrics: Exceeded projections by 15.1 total points against strong opponents (1 games).
#19: Memphis (2-0)
Against #68 Iowa State, #82 Memphis pulled off a big win, 80-76. The model expected a margin of -20, but they performed beating the line by 24.
Dial-Up Metrics: Exceeded projections by 29.6 total points against strong opponents (2 games).
#20: Denver (0-2)
Against #164 Wisconsin, #157 Denver battled tough in a 68-75 loss. The model expected a margin of -21, but they performed +14 versus projection.
Dial-Up Metrics: Exceeded projections by 14.2 total points against strong opponents (1 games).
#21: W Carolina (1-1)
Against #85 North Carolina, #92 W Carolina battled tough in a 72-80 loss. The model expected a margin of -21, but they performed 13 points better than projected.
Dial-Up Metrics: Exceeded projections by 13.2 total points against strong opponents (1 games).
#22: Longwood (2-1)
Against #182 Saint Joseph’s, #217 Longwood battled tough in a 73-82 loss. The model expected a margin of -17, but they performed outpacing the projection by 8. Facing #249 North Carolina Central, #217 Longwood struggled to put away North Carolina Central, winning just 80-75. Favored by 10, they underperformed by 5 points.
Dial-Up Metrics: Exceeded projections by 8.3 total points against strong opponents (1 games); underperformed by 4.8 points against weak competition (1 games).
#23: Gonzaga (2-0)
Against #126 Purdue, #16 Gonzaga pulled off a big win, 78-72. The model expected a margin of -7, but they performed beating the line by 13.
Dial-Up Metrics: Exceeded projections by 12.9 total points against strong opponents (1 games).
#24: Kansas State (1-1)
Against #166 Cal State Northridge, #151 Kansas State pulled off a big win, 95-78. The model expected a margin of 4, but they performed +12 versus projection.
Dial-Up Metrics: Exceeded projections by 12.5 total points against strong opponents (1 games).
#25: Kansas (2-0)
Against #133 Fordham, #4 Kansas pulled off a big win, 95-65. The model expected a margin of 18, but they performed 12 points better than projected.
Dial-Up Metrics: Exceeded projections by 12.5 total points against strong opponents (1 games).
The Volatility of Class: Analyzing the “Dial-Up” Tier in College Basketball
Recent analytics identify a specific cohort of programs that sit at a precarious equilibrium between elite potential and significant susceptibility. These squads possess the offensive ceiling to dismantle any opponent in the nation, yet they exhibit a floor capable of yielding losses against virtually any caliber of opposition. This dichotomy creates a unique betting landscape defined by high variance, often categorized as “Dial-Up” performance where execution can swing dramatically based on game script and external pressure.
Strategic Implications for Underdog Bets
The most compelling value propositions emerge when these teams serve as underdogs. The data suggests that the “Dial-Up” label is often a misconception; rather, it indicates a team capable of elevating its performance intensity specifically under bright lights. When facing Top 50 ranked competition, these programs do not simply play better, they actively cover spreads and secure moneyline upsets more frequently than typical models predict. Investors seeking high-return wagers should prioritize these squads when the point spread places them as favorites against elite tiers or as legitimate threats on the road against ranked opponents. Their ability to close out games suggests that traditional metrics may underestimate their defensive versatility and late-game execution.
The Perils of Backing Favorites
Conversely, the risk profile shifts sharply when these teams are installed as double-digit favorites against opponents with low overall rankings (sub-200). Historical trends indicate a tendency for these programs to lower their tempo or intensity in such mismatches. This phenomenon, often described as playing below their standard effort level, allows inferior defenses to accumulate points and stay within striking distance long enough to cover the spread. For bettors looking to lock in profits on these specific matchups, caution is paramount. The analytics suggest that the point spreads offered for these favorites are likely too wide to accommodate their diminished effort levels against non-competitive foes.
Betting Philosophy for Variable Teams
The overarching lesson for wagering on this tier of basketball is recognizing the distinction between capability and consistency. “Dial-Up” teams thrive in high-stakes environments where motivation dictates output. The actionable strategy involves exploiting market inefficiencies by backing these squads when they are undervalued against top-tier competition, while avoiding the trap of assuming they will maintain elite execution during blowout scenarios. Understanding that their performance is less about a fixed talent gap and more about situational adaptability allows for more precise risk management.
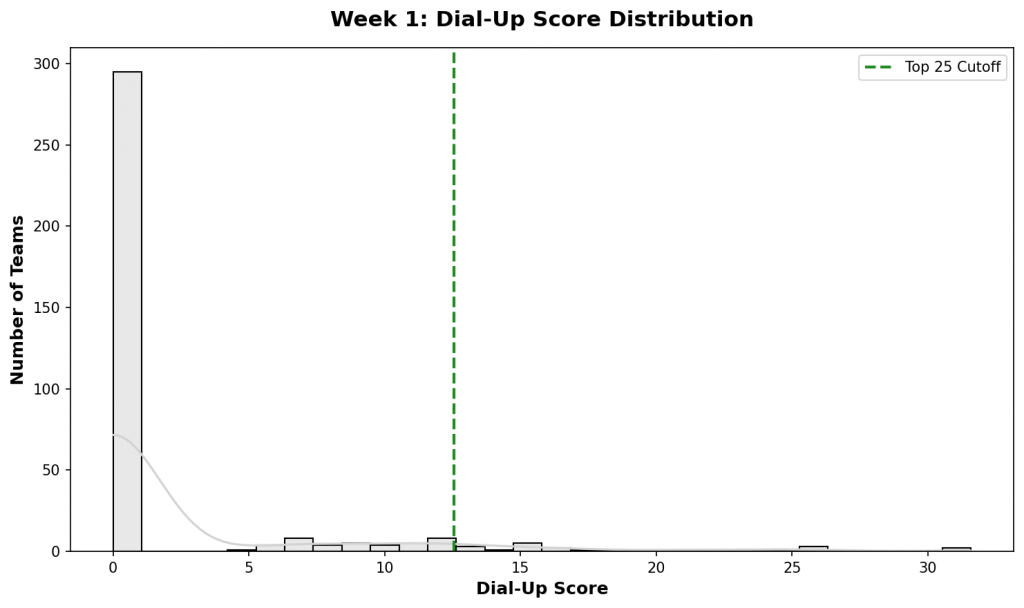
Figure 4: Distribution of Dial-Up scores across all Division I teams. The top 25 teams (highlighted in green) represent those with the most extreme performance splits based on opponent quality.
Check back next week for updated rankings.