Week 1: 2027’s Biggest Bullies
November 9, 2026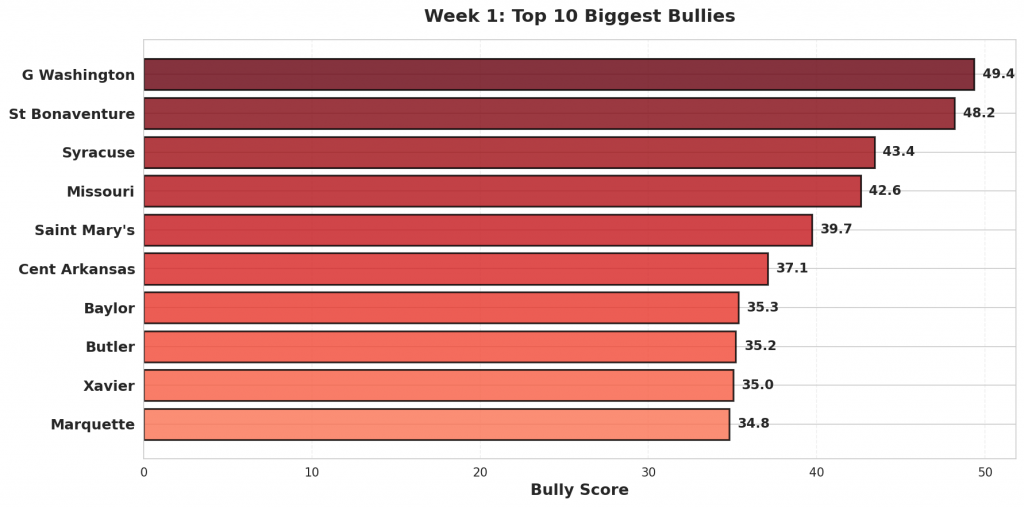
In the early stages of the Division I season, specific metrics can obscure a team’s true competitive profile, particularly when evaluating performance against opponents of varying strength. This weekly analysis identifies the top three “bullies”—teams that artificially inflate their efficiency rankings by dominating weaker squads while failing to meet projections against quality competition. At the forefront is G Washington, which exceeded expectations by +49.4 points total versus weaker competition while remaining perfectly aligned with projections against stronger competition, registering -0.0 points of underperformance. St Bonaventure follows as the second-ranked team on this list, exceeding expectations by +32.6 points total versus weaker competition but showing a discrepancy of -15.5 points when facing stronger opponents. Rounding out the top three is Syracuse, which demonstrated an overperformance of +43.4 points total versus weaker competition and no underperformance whatsoever against stronger competition with a -0.0 point total. These figures highlight a distinct disparity in how these programs translate dominance into wins depending on their opponent’s caliber.
Figure 1: Top 10 teams with the highest bully scores in Week 1. Bully scores reflect the combination of overperformance against weak opponents and underperformance against quality competition.
#1: G Washington (2-0)
#15 G Washington was projected to beat #357 Navy by 3. They cruised to a 91-39 victory, 49 points better than projected.
Bully Metrics: Exceeded projections by 49.4 total points against weak opponents (1 games).
#2: St Bonaventure (1-1)
Against #361 Canisius, #72 St Bonaventure rolled to a 39-point win, 88-49. The model had them winning by 6; the actual margin was 39, outpacing the projection by 33. Facing #131 Youngstown State, St Bonaventure came up short, losing 79-71 after being projected to win by 8.
Bully Metrics: Exceeded projections by 32.6 total points against weak opponents (1 games); underperformed by 15.5 points against quality competition (1 games).
#3: Syracuse (2-0)
#33 Syracuse faced #284 Central Connecticut as 10-point favorites and won handily 102-49, 43 points above the spread.
Bully Metrics: Exceeded projections by 43.4 total points against weak opponents (1 games).
#4: Missouri (1-1)
Expected to win by 18 over #365 Cleveland State, #10 Missouri coasted to a 111-50 win—beating the line by 43. To their credit, Missouri met expectations against stronger #51 Saint Louis, suggesting they may simply be that good rather than inflating numbers against weak competition.
Bully Metrics: Exceeded projections by 42.6 total points against weak opponents (1 games); underperformed by 0.0 points against quality competition (1 games).
#5: Saint Mary’s (2-1)
#56 Saint Mary’s cruised to a 105-64 victory against #323 North Dakota State. Favored by 11, the 41-point margin was +30 versus projection. Against #23 Nevada, Saint Mary’s lost 96-95. They were projected to win by 9.
Bully Metrics: Exceeded projections by 30.3 total points against weak opponents (1 games); underperformed by 18.8 points against quality competition (2 games).
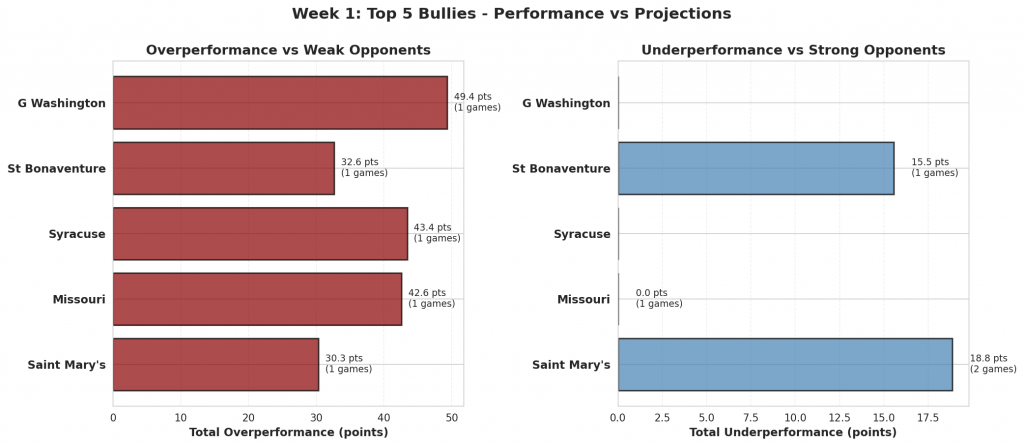
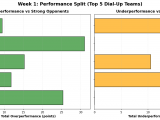
Figure 2: Performance comparison for the top 5 biggest bullies. Red bars show total overperformance against weak opponents; blue bars show total underperformance against strong opponents.
#6: Cent Arkansas (1-1)
The model gave #153 Cent Arkansas a 15-point edge over #362 Oral Roberts. They rolled to a 30-point win, 85-55, finishing 15 beyond the expected margin. Facing #64 Ole Miss, Cent Arkansas came up short, losing 92-60 after being projected to lose by 10.
Bully Metrics: Exceeded projections by 15.3 total points against weak opponents (1 games); underperformed by 21.8 points against quality competition (1 games).
#7: Baylor (2-0)
#52 Baylor handled #360 Arkansas-Pine Bluff, winning 109-53. That 56-point margin was a 35-point swing from the projection.
Bully Metrics: Exceeded projections by 35.3 total points against weak opponents (1 games).
#8: Butler (2-1)
Facing #241 Lafayette, #91 Butler coasted to a 96-60 win. With a projected spread of 18, the result was 18 points past expectations. The model had Butler losing by 2 against #19 Boise State. Instead, they lost 100-81.
Bully Metrics: Exceeded projections by 18.4 total points against weak opponents (1 games); underperformed by 16.8 points against quality competition (1 games).
#9: Xavier (2-0)
#13 Xavier was projected to beat #288 Mount St. Mary’s by 10. They cruised to a 97-52 victory, 35 points better than projected.
Bully Metrics: Exceeded projections by 35.0 total points against weak opponents (1 games).
#10: Marquette (2-0)
Against #364 Detroit Mercy, #2 Marquette rolled to a 61-point win, 93-32. The model had them winning by 14; the actual margin was 61, outpacing the projection by 47.
Bully Metrics: Exceeded projections by 69.6 total points against weak opponents (2 games).
#11: UNC (2-0)
#85 UNC faced #291 Wofford as 19-point favorites and won handily 109-70, 20 points above the spread. Favored by 21 over #92 Western Carolina, UNC won by just 8, 80-72.
Bully Metrics: Exceeded projections by 20.2 total points against weak opponents (1 games); underperformed by 13.2 points against quality competition (1 games).
#12: Duke (2-0)
Expected to win by 28 over #278 Coastal Carolina, #8 Duke coasted to a 113-52 win—beating the line by 32.
Bully Metrics: Exceeded projections by 32.5 total points against weak opponents (1 games).
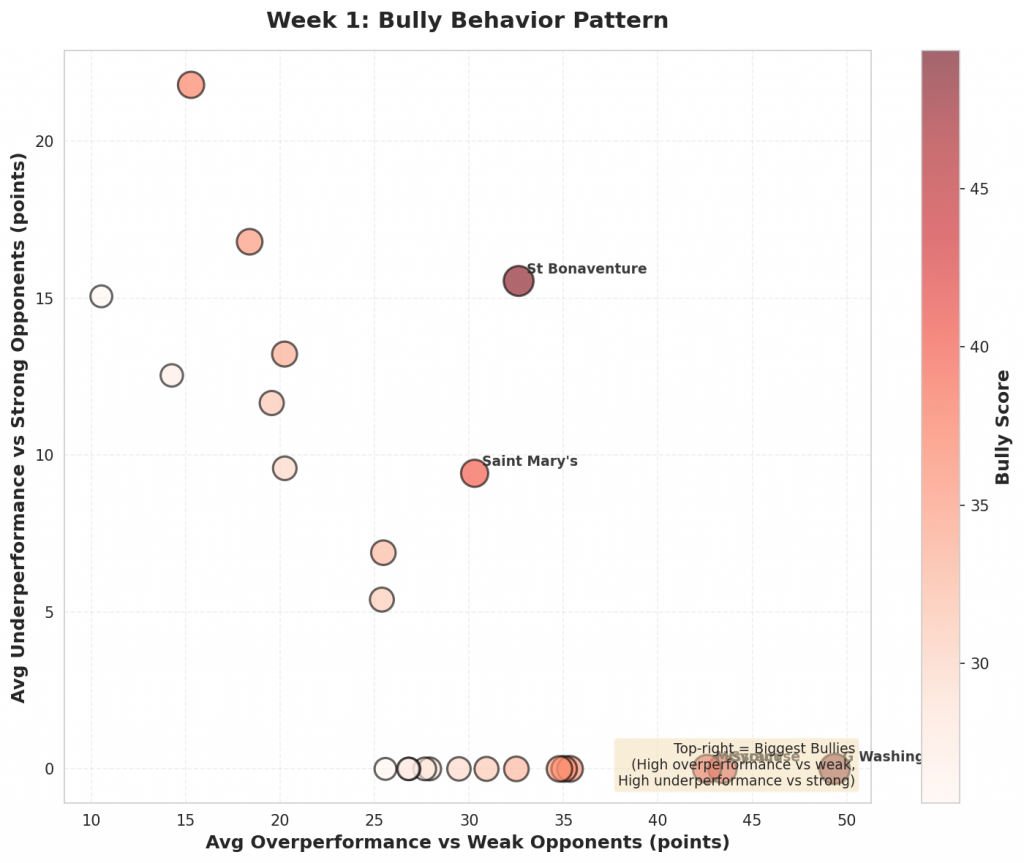
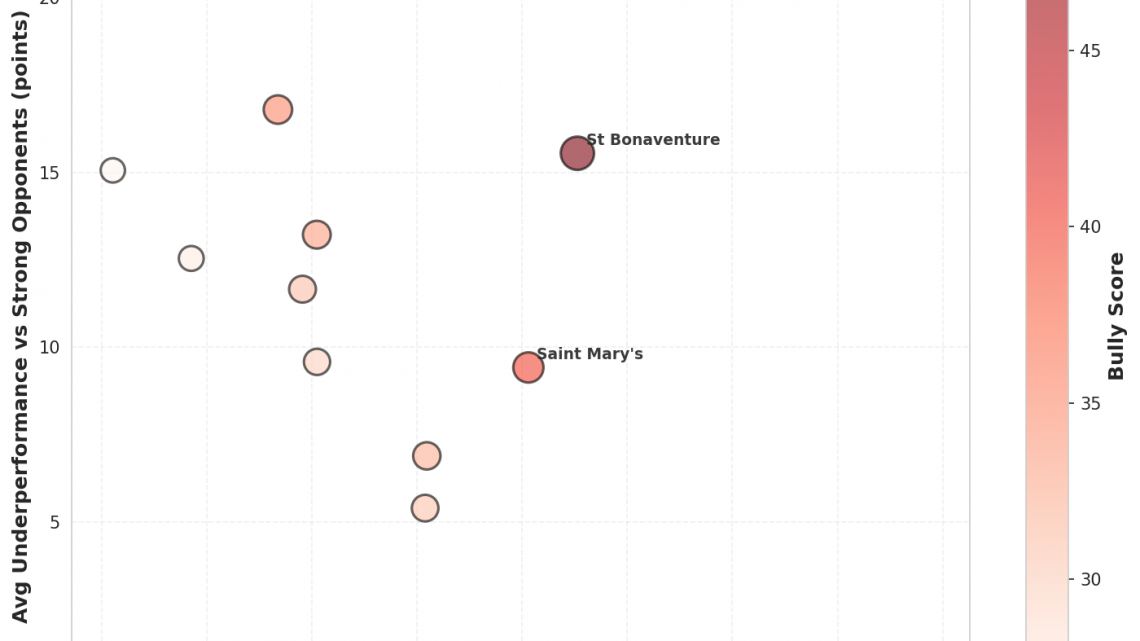
Figure 3: Scatter plot showing the relationship between overperformance against weak opponents (x-axis) and underperformance against strong opponents (y-axis). Bubble size and color indicate bully score magnitude. Top-right quadrant represents the biggest bullies.
#13: Louisville (2-0)
#27 Louisville cruised to a 107-57 victory against #347 Morehead State. Favored by 24, the 50-point margin was +26 versus projection. Against #115 Chattanooga, Louisville won 84-70 but fell 7 points short of the 21-point projection.
Bully Metrics: Exceeded projections by 25.5 total points against weak opponents (1 games); underperformed by 6.9 points against quality competition (1 games).
#14: Colorado (1-1)
The model gave #75 Colorado a 15-point edge over #305 Abilene Christian. They rolled to a 35-point win, 94-59, finishing 20 beyond the expected margin. Facing #69 San Diego State, Colorado came up short, losing 77-66 after being projected to win by 1.
Bully Metrics: Exceeded projections by 19.6 total points against weak opponents (1 games); underperformed by 11.7 points against quality competition (1 games).
#15: URI (2-0)
#31 URI handled #336 Holy Cross, winning 103-59. That 44-point margin was a 31-point swing from the projection.
Bully Metrics: Exceeded projections by 30.9 total points against weak opponents (1 games).
#16: Penn State (2-1)
Facing #361 Canisius, #80 Penn State coasted to a 97-57 win. With a projected spread of 15, the result was 25 points past expectations. Penn State squeaked past #115 Chattanooga 97-93, underperforming the 14-point line by 10.
Bully Metrics: Exceeded projections by 25.4 total points against weak opponents (1 games); underperformed by 10.8 points against quality competition (2 games).
#17: Arkansas (1-1)
#105 Arkansas was projected to beat #360 Arkansas-Pine Bluff by 25. They cruised to a 106-61 victory, 20 points better than projected. Against #30 Virginia, Arkansas lost 91-72. They were projected to lose by 9.
Bully Metrics: Exceeded projections by 20.2 total points against weak opponents (1 games); underperformed by 9.6 points against quality competition (1 games).
#18: Oregon State (2-0)
Against #344 Weber State, #17 Oregon State rolled to a 41-point win, 102-61. The model had them winning by 8; the actual margin was 41, outpacing the projection by 33.
Bully Metrics: Exceeded projections by 58.9 total points against weak opponents (2 games).
#19: Oklahoma State (2-0)
#22 Oklahoma State faced #270 Queens University as 7-point favorites and won handily 118-68, 43 points above the spread.
Bully Metrics: Exceeded projections by 55.8 total points against weak opponents (2 games).
#20: Nevada (2-0)
Expected to win by 9 over #358 Robert Morris, #23 Nevada coasted to a 86-49 win—beating the line by 28. To their credit, Nevada met expectations against stronger #56 Saint Mary’s, suggesting they may simply be that good rather than inflating numbers against weak competition.
Bully Metrics: Exceeded projections by 27.7 total points against weak opponents (1 games); underperformed by 0.0 points against quality competition (1 games).
#21: LSU (2-0)
#26 LSU cruised to a 100-57 victory against #352 LSU New Orleans. Favored by 16, the 43-point margin was +27 versus projection.
Bully Metrics: Exceeded projections by 53.7 total points against weak opponents (2 games).
#22: Fordham (1-1)
The model gave #133 Fordham a 6-point edge over #346 Stonehill. They pulled away for a 83-63 win, finishing 14 beyond the expected margin. Facing #4 Kansas, Fordham came up short, losing 95-65 after being projected to lose by 18.
Bully Metrics: Exceeded projections by 14.3 total points against weak opponents (1 games); underperformed by 12.5 points against quality competition (1 games).
#23: Illinois (2-0)
#1 Illinois handled #363 Fairleigh Dickinson, winning 120-45. That 75-point margin was a 43-point swing from the projection.
Bully Metrics: Exceeded projections by 53.6 total points against weak opponents (2 games).
#24: UCF (2-0)
Facing #205 Yale, #160 UCF finished with a 87-75 victory. With a projected spread of 2, the result was 10 points past expectations. UCF squeaked past #109 Florida Gulf Coast 96-95, underperforming the 16-point line by 15.
Bully Metrics: Exceeded projections by 10.5 total points against weak opponents (1 games); underperformed by 15.1 points against quality competition (1 games).
#25: Kansas (2-0)
#4 Kansas was projected to beat #355 Middle Tennessee by 18. They cruised to a 89-45 victory, 26 points better than projected. To their credit, Kansas met expectations against stronger #133 Fordham, suggesting they may simply be that good rather than inflating numbers against weak competition.
Bully Metrics: Exceeded projections by 25.6 total points against weak opponents (1 games); underperformed by 0.0 points against quality competition (1 games).
The Illusion of Efficiency: Decoding the “Bully” Team Profile
In college basketball analytics, efficiency numbers are often treated as absolute truths. However, a critical layer of nuance exists between raw metrics and actual game performance. Teams that consistently dominate inferior opponents while simultaneously underperforming against quality competition display a specific behavioral anomaly. When a roster crushes weaker foes far beyond statistical projections but fails to generate commensurate results against elite teams, their efficiency metrics are artificially inflated. This disparity suggests a reliance on opponent weakness rather than sustained dominance, creating a misleading picture of overall team strength.
The “Flat-Track Bully” Phenomenon
These specific profiles represent what we call “flat-track bullies.” Their playing style is characterized by an unwavering intensity that extends throughout all 40 minutes of regulation, regardless of the scoreboard differential. Against inferior competition, these teams are formidable forces; they do not let up and often secure victories with wide margins.
For handicappers and analysts, this behavior offers a clear strategic framework:
- Covering Spreads vs. Weak Opposition: These teams are reliable favorites when facing weaker opponents. Their refusal to back off allows them to cover large point spreads consistently. The data supports backing these matchups, as the gap between projected performance and actual results tends to widen in their favor against lower-tier competition.
- Avoiding Overvalued Favorites vs. Quality Teams: The danger emerges when these teams are matched up against quality opponents. Here, their inflated efficiency metrics become a liability. While they may appear as heavy favorites due to their dominant resume against inferior foes, they often lack the tactical adjustment or defensive versatility required to punch back against strong defenses. In these scenarios, relying on them as locks is a significant risk; their performance frequently regresses to a level that does not match the hype generated by their win-loss record alone.
Strategic Conclusion
The core takeaway from analyzing this subset of teams is the dichotomy in their performance curve. They are built for domination over the weak but struggle to maintain parity or overcome elite units. Successful wagering and game planning around these rosters requires a binary approach: leverage their aggressive output when they face weaker squads, but exercise extreme caution when they are set to play against established contenders. In those latter scenarios, the market often overvalues them, pricing in results that their underlying metrics against tough competition simply cannot support.
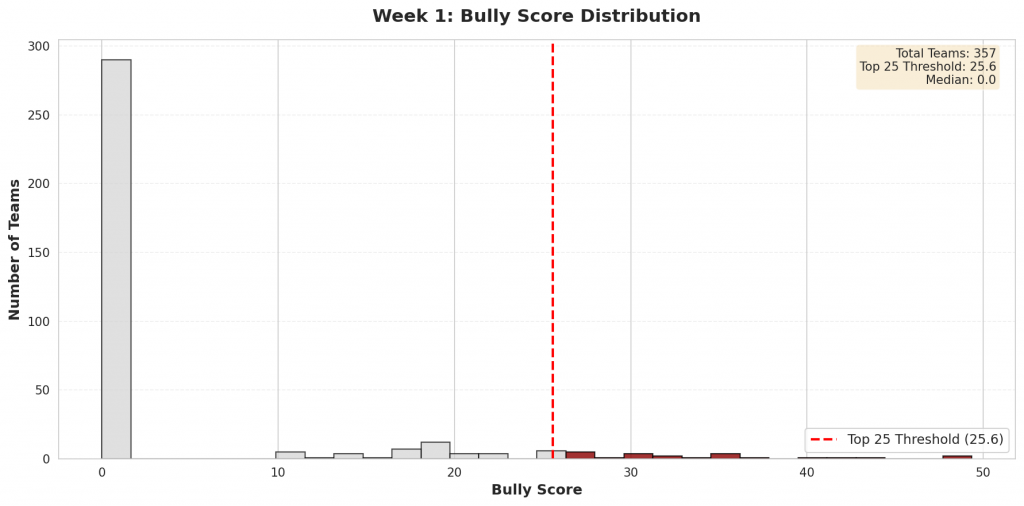
Figure 4: Distribution of bully scores across all Division I teams. The top 25 bullies (highlighted in red) represent teams whose efficiency metrics are most inflated by their performance patterns.
Check back next week for updated bully rankings.