Pac-12 Conference Update: Week 2
November 16, 2026Strongest Offensive Trends
- Colorado State, Off Reb Pct, Down, Trend Strength: -0.042 – Colorado State is experiencing a troubling decline in its ability to secure rebounds on offense, a deficiency that directly undermines their chances of maintaining possession and fueling scoring opportunities.
- Fresno State, Off Reb Pct, Up, Trend Strength: 0.031 – As Fresno State shows steady improvement in its ability to grab loose balls off rebounds, this development contributes positively to their overall offensive efficiency throughout the season.
- Texas State, Shooting, Up, Trend Strength: 0.028 – Texas State is demonstrating an encouraging upward trajectory in its shooting performance that points toward improved offensive efficiency for the remainder of the season.
- Colorado State, Shooting, Down, Trend Strength: -0.018 – Colorado State’s Shooting is trending down, a worsening trend.
- Oregon State, Shooting, Up, Trend Strength: 0.017 – Oregon State has shown signs of improvement from the field as their shooting mechanics evolve, contributing positively to their overall offensive output during the current season.
Strongest Defensive Trends
- Boise State, Opp Shooting, Up, Trend Strength: 0.018 – Boise State faces a troubling inability to shut down opposing scoring opportunities, as their defensive performance has noticeably slipped in early-season contests.
- Fresno State, Opp Turnovers, Down, Trend Strength: -0.016 – As Fresno State encounters difficulty translating defensive pressure into takeaways, this troubling shift signals that the team’s capacity to create easy scoring opportunities by provoking errors has noticeably declined.
- Colorado State, Opp Shooting, Down, Trend Strength: -0.012 – Defensive efforts are yielding improved results as opponents struggle to maintain shooting efficiency.
- Colorado State, Opp Turnovers, Up, Trend Strength: 0.01 – Colorado State is successfully forcing more turnovers from its opponents, a defensive adjustment that directly stifles the opposition’s ability to maintain possession and advance the ball down the court.
- Boise State, Opp Turnovers, Up, Trend Strength: 0.009 – Boise State is showing marked improvement in pressuring defenders into committing mistakes, indicating a growing ability to generate easy scoring opportunities from turnovers as they progress through their season.
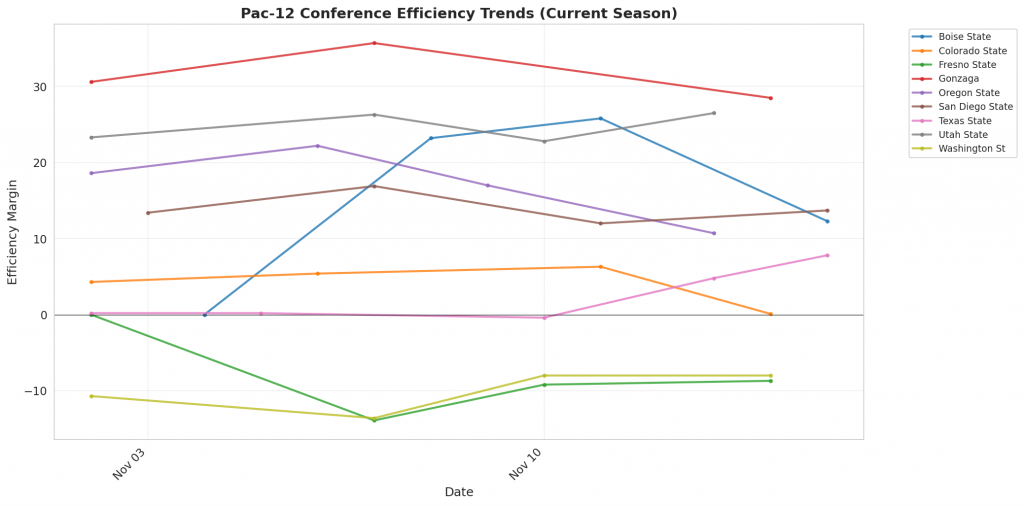
Figure 1: Efficiency margin trends for Pac-12 Conference teams throughout the season. Teams trending upward show improving performance, while downward trends indicate struggles.
Conference Snapshot
- Week Dates: November 09 – November 15, 2026
- Trending Up (Efficiency):Boise State, Fresno State, Oregon State, San Diego State, Texas State
- Trending Down (Efficiency):Colorado State, Gonzaga
Team-by-Team Analysis
Boise State
Record: 3-1 | Elo: 1610.4 (ranked 49 of 365) | Efficiency Margin: +12.29 (ranked 86 of 365)
Offensive Trends:
- Shooting (Shooting): Currently ranked 52 of 365 in D1. Trending up moderately 🟢.
- Turnovers (Turnovers): Currently ranked 35 of 365 in D1. Trending down moderately 🟢.
Defensive Trends:
- Opp Shooting (Opp Shooting): Currently ranked 340 of 365 in D1. Trending up strongly 🔴.
- Opp Turnovers (Opp Turnovers): Currently ranked 52 of 365 in D1. Trending up strongly 🟢.
Colorado State
Record: 3-1 | Elo: 1590.2 (ranked 59 of 365) | Efficiency Margin: +0.12 (ranked 146 of 365)
Offensive Trends:
- Shooting (Shooting): Currently ranked 88 of 365 in D1. Trending down strongly 🔴.
- Off Reb Pct (Offensive Rebounding): Currently ranked 360 of 365 in D1. Trending down strongly 🔴.
Defensive Trends:
- Opp Shooting (Opp Shooting): Currently ranked 121 of 365 in D1. Trending down strongly 🟢.
- Opp Turnovers (Opp Turnovers): Currently ranked 160 of 365 in D1. Trending up strongly 🟢.
Fresno State
Record: 3-1 | Elo: 1443.2 (ranked 271 of 365) | Efficiency Margin: -8.66 (ranked 229 of 365)
Offensive Trends:
- Off Reb Pct (Offensive Rebounding): Currently ranked 179 of 365 in D1. Trending up strongly 🟢.
- Turnovers (Turnovers): Currently ranked 123 of 365 in D1. Trending down moderately 🟢.
Defensive Trends:
- Opp Turnovers (Opp Turnovers): Currently ranked 349 of 365 in D1. Trending down strongly 🔴.
- Def Reb Pct (Defensive Rebounding): Currently ranked 140 of 365 in D1. Trending up moderately 🟢.
Gonzaga
Record: 2-1 | Elo: 1706.0 (ranked 10 of 365) | Efficiency Margin: +28.45 (ranked 19 of 365)
Offensive Trends:
- Shooting (Shooting): Currently ranked 62 of 365 in D1. Trending down moderately 🔴.
- Turnovers (Turnovers): Currently ranked 3 of 365 in D1. Trending down moderately 🟢.
Defensive Trends:
- Def Reb Pct (Defensive Rebounding): Currently ranked 184 of 365 in D1. Trending down strongly 🔴.
- Opp Shooting (Opp Shooting): Currently ranked 176 of 365 in D1. Trending up moderately 🔴.
Oregon State
Record: 4-0 | Elo: 1536.8 (ranked 124 of 365) | Efficiency Margin: +10.71 (ranked 94 of 365)
Offensive Trends:
- Shooting (Shooting): Currently ranked 30 of 365 in D1. Trending up strongly 🟢.
- Off Reb Pct (Offensive Rebounding): Currently ranked 190 of 365 in D1. Trending up moderately 🟢.
Defensive Trends:
- Opp Shooting (Opp Shooting): Currently ranked 61 of 365 in D1. Trending down moderately 🟢.
- Opp Turnovers (Opp Turnovers): Currently ranked 262 of 365 in D1. Trending up moderately 🟢.
San Diego State
Record: 4-0 | Elo: 1649.3 (ranked 30 of 365) | Efficiency Margin: +13.68 (ranked 81 of 365)
Offensive Trends:
- Shooting (Shooting): Currently ranked 41 of 365 in D1. Trending up moderately 🟢.
- Turnovers (Turnovers): Currently ranked 261 of 365 in D1. Trending up moderately 🔴.
Defensive Trends:
- Def Reb Pct (Defensive Rebounding): Currently ranked 209 of 365 in D1. Trending down moderately 🔴.
- Opp Shooting (Opp Shooting): Currently ranked 87 of 365 in D1. Trending down weakly 🟢.
Texas State
Record: 5-0 | Elo: 1542.8 (ranked 116 of 365) | Efficiency Margin: +7.80 (ranked 108 of 365)
Offensive Trends:
- Shooting (Shooting): Currently ranked 25 of 365 in D1. Trending up strongly 🟢.
- Turnovers (Turnovers): Currently ranked 339 of 365 in D1. Trending up strongly 🔴.
Defensive Trends:
- Opp Shooting (Opp Shooting): Currently ranked 98 of 365 in D1. Trending down moderately 🟢.
- Def Reb Pct (Defensive Rebounding): Currently ranked 188 of 365 in D1. Trending down moderately 🔴.
Utah State
Record: 4-0 | Elo: 1694.9 (ranked 11 of 365) | Efficiency Margin: +26.47 (ranked 27 of 365)
Offensive Trends:
- Shooting (Shooting): Currently ranked 3 of 365 in D1. Trending up strongly 🟢.
- Turnovers (Turnovers): Currently ranked 11 of 365 in D1. Trending down strongly 🟢.
Defensive Trends:
- Def Reb Pct (Defensive Rebounding): Currently ranked 59 of 365 in D1. Trending up strongly 🟢.
- Opp Shooting (Opp Shooting): Currently ranked 69 of 365 in D1. Trending down moderately 🟢.
Washington St
Record: 1-3 | Elo: 1452.2 (ranked 260 of 365) | Efficiency Margin: -8.02 (ranked 216 of 365)
Offensive Trends:
- Off Reb Pct (Offensive Rebounding): Currently ranked 60 of 365 in D1. Trending up strongly 🟢.
- Shooting (Shooting): Currently ranked 183 of 365 in D1. Trending up weakly 🟢.
Defensive Trends:
- Opp Shooting (Opp Shooting): Currently ranked 360 of 365 in D1. Trending up strongly 🔴.
- Opp Turnovers (Opp Turnovers): Currently ranked 79 of 365 in D1. Trending up strongly 🟢.
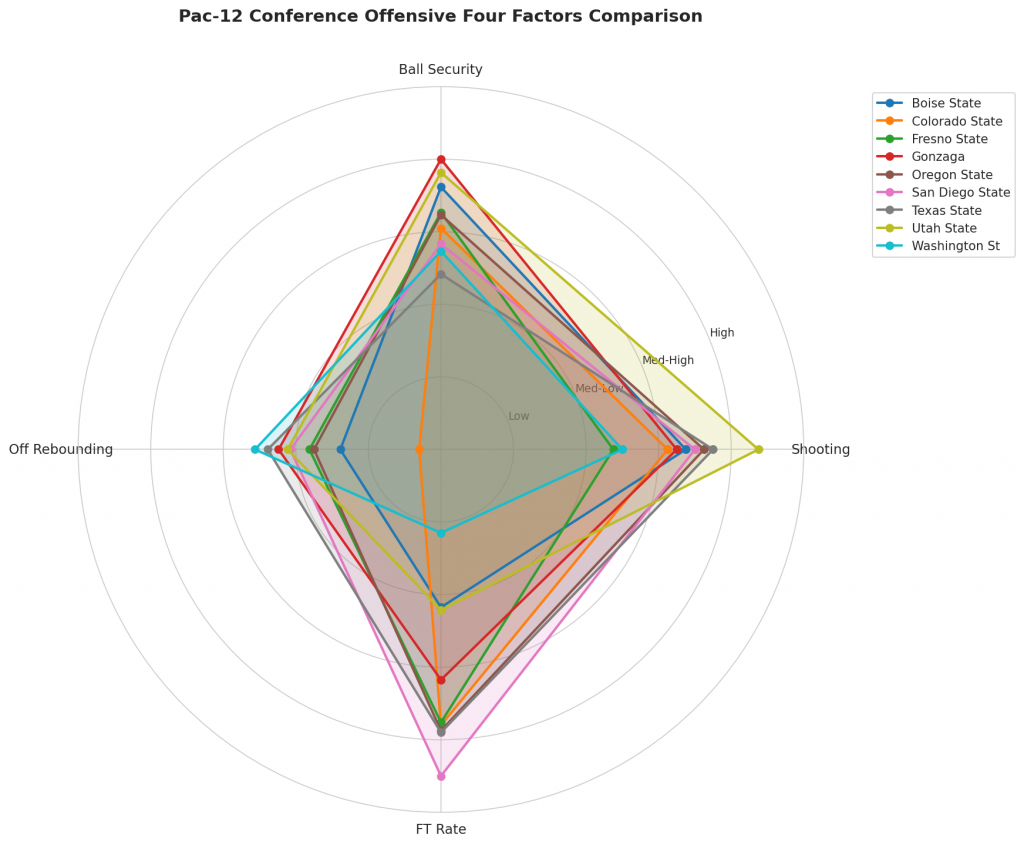
Figure 2: Offensive Four Factors comparison across Pac-12 Conference teams. The radar chart shows each team’s shooting efficiency (eFG%), ball security (TOV%), offensive rebounding (OREB%), and free throw generation (FT Rate).
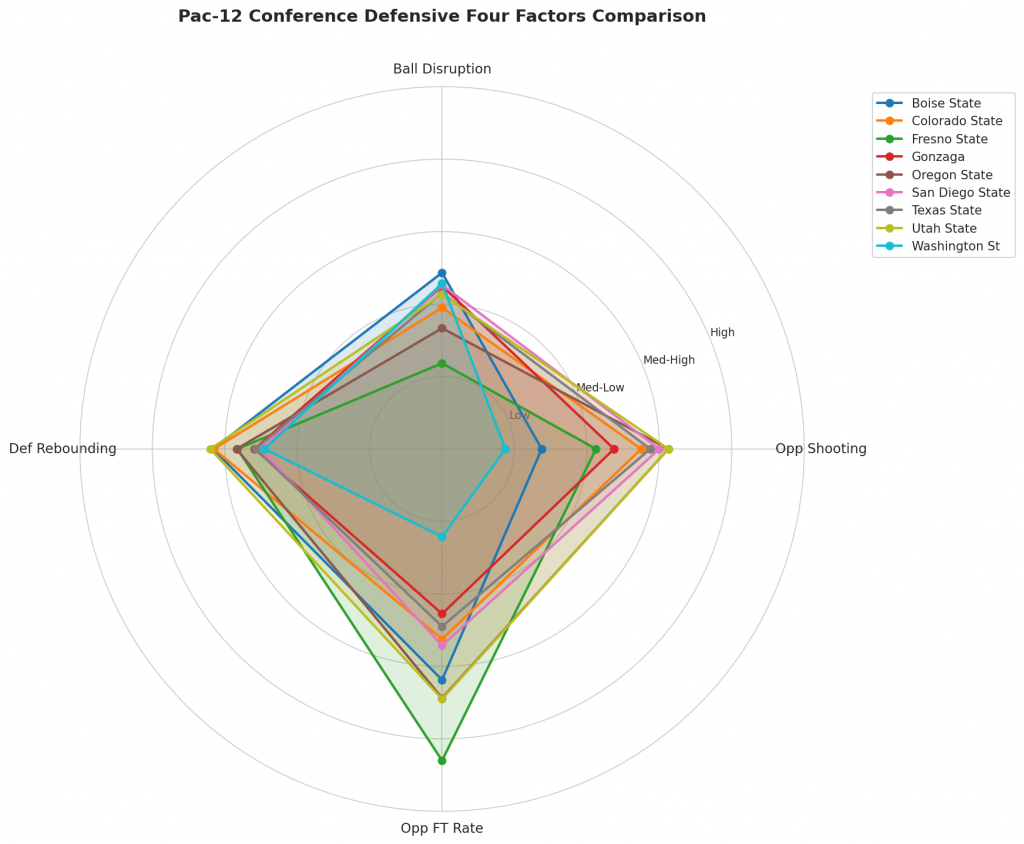
Figure 3: Defensive Four Factors comparison across Pac-12 Conference teams. The radar chart shows each team’s opponent shooting defense (Opp eFG%), ball disruption (forcing TOV%), defensive rebounding (DREB%), and opponent free throw prevention (Opp FT Rate).
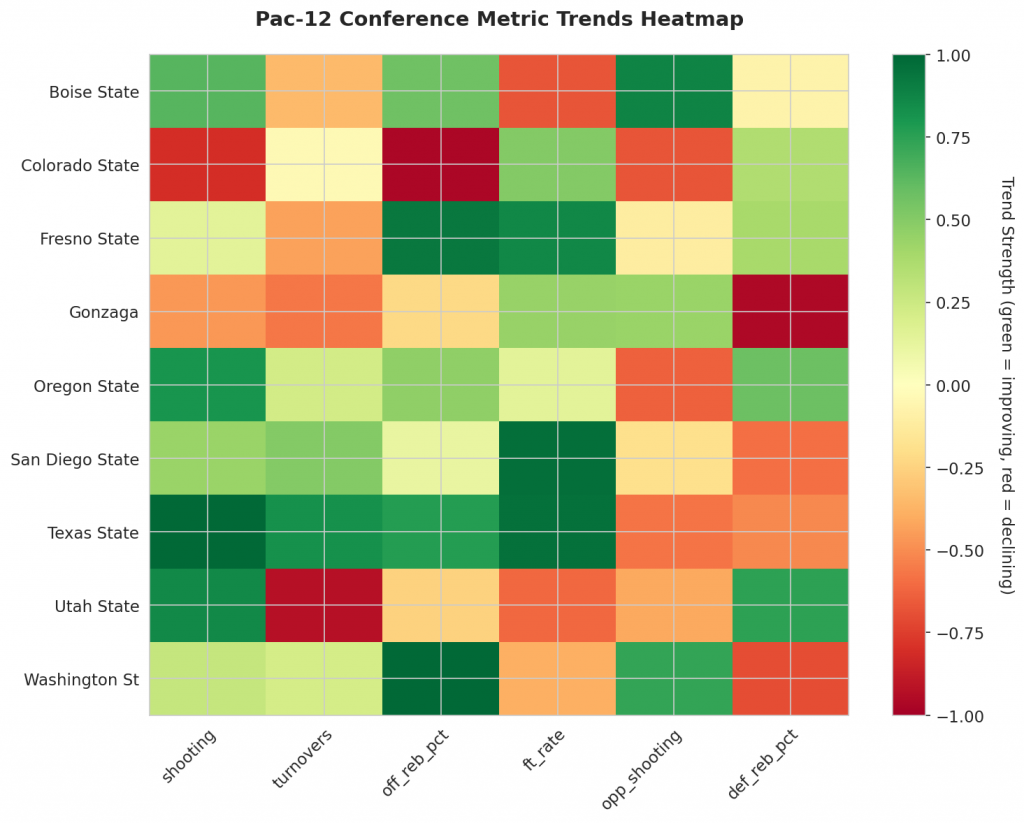
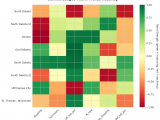
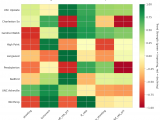
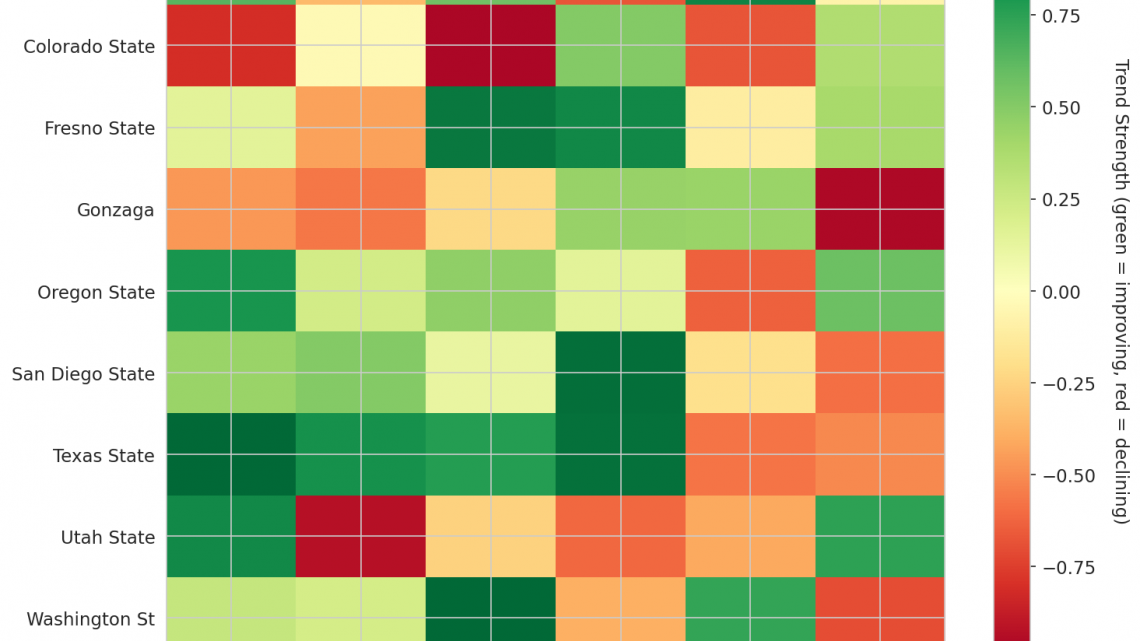
Figure 4: MACD trends heatmap showing which metrics are improving (green) or declining (red) for each team. Stronger colors indicate more pronounced trends.
Looking Ahead
In the ongoing evaluation of Pac-12 Conference teams, MACD trending indicators serve as critical tools to distinguish between genuine improvement and unsustainable momentum. As the season progresses into Week 2, these metrics reveal distinct trajectories for offense and defense across the league’s squads. The following analysis prioritizes specific data points to assess where value is increasing or decreasing.
On the offensive side, the data presents a mixed picture of efficiency and rebounding capability. Colorado State demonstrates a significant decline in shooting ability; with a season average of 0.55, their trend is moving strongly downward, indicating that offensive value is worsening. This unit also struggles with rebounding consistency, as their Off Reb Pct sits at a season average of 0.174 and is trending down strongly. Conversely, other teams show signs of stability or growth. Fresno State has turned things around on the glass, posting a season average Off Reb Pct of 0.295 while trending up strongly, signaling improving performance in this area. Similarly, Oregon State exhibits positive movement in shooting efficiency, maintaining a season average of 0.59 with a trend moving strongly upward, marking an increase in offensive value.
Defensively, the trends highlight varying levels of effectiveness in limiting opponent scoring and disrupting ball security. Boise State faces scrutiny regarding their ability to suppress opponent shooting; while their Opp Shooting metric shows a season average of 0.59, this figure is trending up strongly. In the context of defense where preventing points is paramount, an upward trend in opponent shooting represents a worsening condition. However, Boise State counters this weakness with strong turnover generation, posting a season average of 0.196 for Opp Turnovers that is trending up strongly. Forcing more turnovers by the opposition indicates an improving defensive unit capable of creating transition opportunities.
Colorado State presents a dual narrative in their defensive metrics. On one hand, they have successfully suppressed opponent shooting, with their Opp Shooting metric trending down strongly from a season average of 0.48, reflecting an improvement in limiting scoring. On the other hand, similar to their offensive rebounding struggles noted earlier, Colorado State also excels in disrupting opponent ball security, as their Opp Turnovers metric (season average: 0.16699999999999998) is trending up strongly. This indicates they are forcing more turnovers by the opposition, adding to their defensive value.
These MACD indicators provide a clear magnitude of momentum change for each team. While some squads like Colorado State show conflicting trends—worsening shooting efficiency paired with strong defensive improvements—others like Fresno State and Oregon State display clearer paths of upward trajectory in their respective key areas. As the season unfolds, tracking these specific metrics will be essential to identifying which teams are building a sustainable foundation versus those riding temporary highs or lows.
Metrics Glossary
Four Factors (Dean Oliver’s framework for basketball success):
- eFG% (Effective Field Goal %): Field goal percentage adjusted for 3-pointers being worth more (FGM + 0.5×3PM) / FGA. Higher is better offensively, lower is better defensively.
- TOV% (Turnover Rate): Turnovers per 100 possessions. Lower is better offensively (taking care of the ball), higher is better defensively (forcing turnovers).
- OREB% / DREB% (Offensive/Defensive Rebound Rate): Percentage of available rebounds grabbed. Offensive rebounds create second-chance points; defensive rebounds end opponent possessions.
- FTR (Free Throw Rate): Free throws made per field goal attempt (FTM/FGA). Measures ability to get to the line AND convert. Higher is better offensively, lower is better defensively.
Other Metrics:
- Elo Rating: Chess-style rating system that updates based on game results and opponent strength. Higher Elo indicates stronger team.
- Efficiency Margin: Point differential per 100 possessions (Offensive Efficiency – Defensive Efficiency). Accounts for pace of play.
- MACD (Moving Average Convergence Divergence): Trend indicator comparing 12-game and 26-game exponential moving averages. Positive MACD = improving trend, Negative MACD = declining trend.
Analysis powered by HoopSci’s advanced metrics and MACD trending indicators.