West Coast Update: Week 2
November 16, 2026Strongest Offensive Trends
- Pepperdine, Off Reb Pct, Up, Trend Strength: 0.085 – The ongoing improvement in Pepperdine’s offensive rebounding percentage suggests a developing ability to extend possessions, thereby creating more opportunities for the team to score within the first few minutes of play.
- Loyola Mary, Off Reb Pct, Up, Trend Strength: 0.064 – As Loyola Mary strengthens its rebounding efforts this season, that growing defensive edge serves as a vital advantage helping to solidify their competitive standing against opponents.
- Pacific, Off Reb Pct, Up, Trend Strength: 0.031 – Pacific has shown a marked improvement in its ability to secure second-chance opportunities, which has contributed to enhanced overall offensive efficiency throughout this season.
- Pepperdine, Shooting, Up, Trend Strength: 0.022 – As the season unfolds, Pepperdine’s growing offensive efficiency stems from a noticeable uptick in shooting accuracy across their recent games.
- Loyola Mary, Shooting, Up, Trend Strength: 0.011 – As Loyola Mary shows signs of improvement on the shooting floor, this enhanced ball movement is contributing to a more efficient offense throughout their early-season matchups.
Strongest Defensive Trends
- San Francisco, Def Reb Pct, Down, Trend Strength: -0.02 – The Dons are struggling to protect the glass as their defensive rebounding percentage declines because allowing more offensive boards is giving opponents a clear advantage.
- Pacific, Opp Shooting, Down, Trend Strength: -0.02 – Pacific is seeing encouraging progress in its defense as it successfully stifles opponents’ shooting efforts throughout the season.
- San Francisco, Opp Turnovers, Up, Trend Strength: 0.018 – Early in the season, San Francisco’s offense has demonstrated a significant strength by generating more turnovers than usual, effectively stifling opposing defenses and turning the ball over at an improved rate.
- San Diego, Def Reb Pct, Up, Trend Strength: 0.014 – San Diego is demonstrating improved efficiency on defensive rebounds as they secure more glass work, indicating growing dominance in their rebounding battle against opponents.
- Saint Mary’s, Opp Shooting, Up, Trend Strength: 0.01 – Saint Mary’s has struggled to generate defensive identity as their inability to suppress opposing shooting early in the season suggests a troubling trajectory for the team.
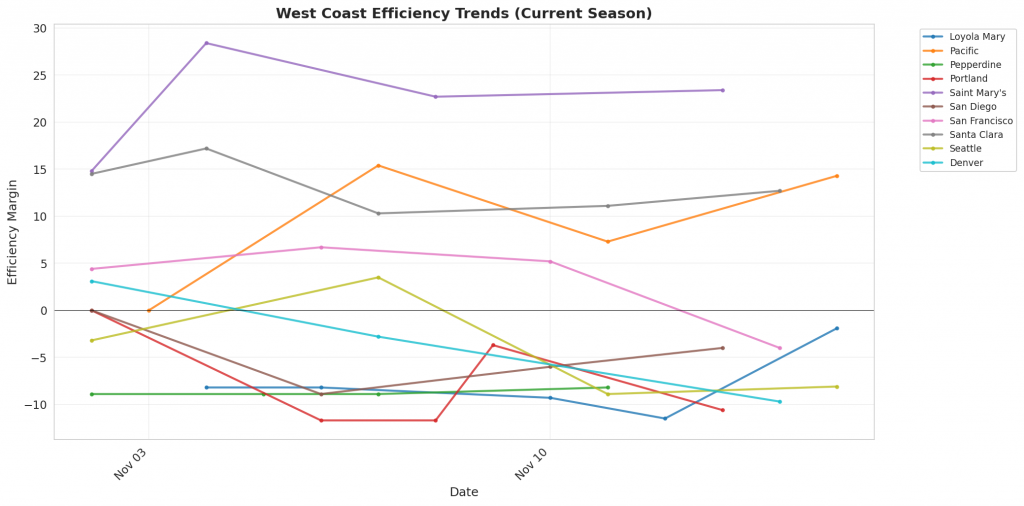
Figure 1: Efficiency margin trends for West Coast teams throughout the season. Teams trending upward show improving performance, while downward trends indicate struggles.
Conference Snapshot
- Week Dates: November 09 – November 15, 2026
- Trending Up (Efficiency):Loyola Mary, Pacific, Pepperdine, Portland, Saint Mary’s
- Trending Down (Efficiency):San Francisco, Santa Clara, Denver
Team-by-Team Analysis
Denver
Record: 0-3 | Elo: 1421.2 (ranked 297 of 365) | Efficiency Margin: -9.67 (ranked 238 of 365)
Offensive Trends:
- Shooting (Shooting): Currently ranked 318 of 365 in D1. Trending down strongly 🔴.
- Off Reb Pct (Offensive Rebounding): Currently ranked 282 of 365 in D1. Trending down strongly 🔴.
Defensive Trends:
- Opp Shooting (Opp Shooting): Currently ranked 127 of 365 in D1. Trending down moderately 🟢.
- Def Reb Pct (Defensive Rebounding): Currently ranked 280 of 365 in D1. Trending down moderately 🔴.
Loyola Mary
Record: 2-3 | Elo: 1445.5 (ranked 269 of 365) | Efficiency Margin: -1.93 (ranked 161 of 365)
Offensive Trends:
- Shooting (Shooting): Currently ranked 83 of 365 in D1. Trending up strongly 🟢.
- Off Reb Pct (Offensive Rebounding): Currently ranked 22 of 365 in D1. Trending up strongly 🟢.
Defensive Trends:
- Opp Turnovers (Opp Turnovers): Currently ranked 323 of 365 in D1. Trending down moderately 🔴.
- Def Reb Pct (Defensive Rebounding): Currently ranked 115 of 365 in D1. Trending up moderately 🟢.
Pacific
Record: 3-1 | Elo: 1465.4 (ranked 242 of 365) | Efficiency Margin: +14.29 (ranked 75 of 365)
Offensive Trends:
- Off Reb Pct (Offensive Rebounding): Currently ranked 36 of 365 in D1. Trending up strongly 🟢.
- Shooting (Shooting): Currently ranked 145 of 365 in D1. Trending up weakly 🟢.
Defensive Trends:
- Opp Shooting (Opp Shooting): Currently ranked 9 of 365 in D1. Trending down strongly 🟢.
- Def Reb Pct (Defensive Rebounding): Currently ranked 92 of 365 in D1. Trending down moderately 🔴.
Pepperdine
Record: 2-2 | Elo: 1382.4 (ranked 340 of 365) | Efficiency Margin: -8.23 (ranked 223 of 365)
Offensive Trends:
- Shooting (Shooting): Currently ranked 138 of 365 in D1. Trending up strongly 🟢.
- Off Reb Pct (Offensive Rebounding): Currently ranked 167 of 365 in D1. Trending up strongly 🟢.
Defensive Trends:
- Opp Shooting (Opp Shooting): Currently ranked 256 of 365 in D1. Trending down weakly 🟢.
- Opp Turnovers (Opp Turnovers): Currently ranked 189 of 365 in D1. Trending up weakly 🟢.
Portland
Record: 3-2 | Elo: 1439.7 (ranked 277 of 365) | Efficiency Margin: -10.60 (ranked 245 of 365)
Offensive Trends:
- Shooting (Shooting): Currently ranked 36 of 365 in D1. Trending up strongly 🟢.
- Off Reb Pct (Offensive Rebounding): Currently ranked 356 of 365 in D1. Trending up strongly 🟢.
Defensive Trends:
- Opp Shooting (Opp Shooting): Currently ranked 227 of 365 in D1. Trending down moderately 🟢.
- Opp Turnovers (Opp Turnovers): Currently ranked 274 of 365 in D1. Trending down moderately 🔴.
Saint Mary’s
Record: 3-1 | Elo: 1681.5 (ranked 14 of 365) | Efficiency Margin: +23.37 (ranked 38 of 365)
Offensive Trends:
- Shooting (Shooting): Currently ranked 7 of 365 in D1. Trending up strongly 🟢.
- Turnovers (Turnovers): Currently ranked 101 of 365 in D1. Trending up moderately 🔴.
Defensive Trends:
- Opp Shooting (Opp Shooting): Currently ranked 187 of 365 in D1. Trending up strongly 🔴.
- Opp Turnovers (Opp Turnovers): Currently ranked 184 of 365 in D1. Trending up moderately 🟢.
San Diego
Record: 3-1 | Elo: 1405.8 (ranked 318 of 365) | Efficiency Margin: -4.00 (ranked 185 of 365)
Offensive Trends:
- Off Reb Pct (Offensive Rebounding): Currently ranked 67 of 365 in D1. Trending up strongly 🟢.
- Shooting (Shooting): Currently ranked 96 of 365 in D1. Trending up moderately 🟢.
Defensive Trends:
- Def Reb Pct (Defensive Rebounding): Currently ranked 228 of 365 in D1. Trending up strongly 🟢.
- Opp Shooting (Opp Shooting): Currently ranked 355 of 365 in D1. Trending up moderately 🔴.
San Francisco
Record: 3-1 | Elo: 1545.5 (ranked 113 of 365) | Efficiency Margin: -3.96 (ranked 184 of 365)
Offensive Trends:
- Shooting (Shooting): Currently ranked 247 of 365 in D1. Trending down strongly 🔴.
- Turnovers (Turnovers): Currently ranked 213 of 365 in D1. Trending up moderately 🔴.
Defensive Trends:
- Opp Turnovers (Opp Turnovers): Currently ranked 72 of 365 in D1. Trending up strongly 🟢.
- Def Reb Pct (Defensive Rebounding): Currently ranked 206 of 365 in D1. Trending down strongly 🔴.
Santa Clara
Record: 5-0 | Elo: 1651.4 (ranked 28 of 365) | Efficiency Margin: +12.71 (ranked 84 of 365)
Offensive Trends:
- Shooting (Shooting): Currently ranked 109 of 365 in D1. Trending down moderately 🔴.
- Turnovers (Turnovers): Currently ranked 200 of 365 in D1. Trending up moderately 🔴.
Defensive Trends:
- Opp Turnovers (Opp Turnovers): Currently ranked 124 of 365 in D1. Trending down strongly 🔴.
- Opp Shooting (Opp Shooting): Currently ranked 75 of 365 in D1. Trending down moderately 🟢.
Seattle
Record: 2-2 | Elo: 1513.8 (ranked 165 of 365) | Efficiency Margin: -8.07 (ranked 219 of 365)
Offensive Trends:
- Shooting (Shooting): Currently ranked 199 of 365 in D1. Trending up weakly 🟢.
- Turnovers (Turnovers): Currently ranked 281 of 365 in D1. Trending up weakly 🔴.
Defensive Trends:
- Opp Shooting (Opp Shooting): Currently ranked 178 of 365 in D1. Trending up moderately 🔴.
- Opp Turnovers (Opp Turnovers): Currently ranked 46 of 365 in D1. Trending up weakly 🟢.
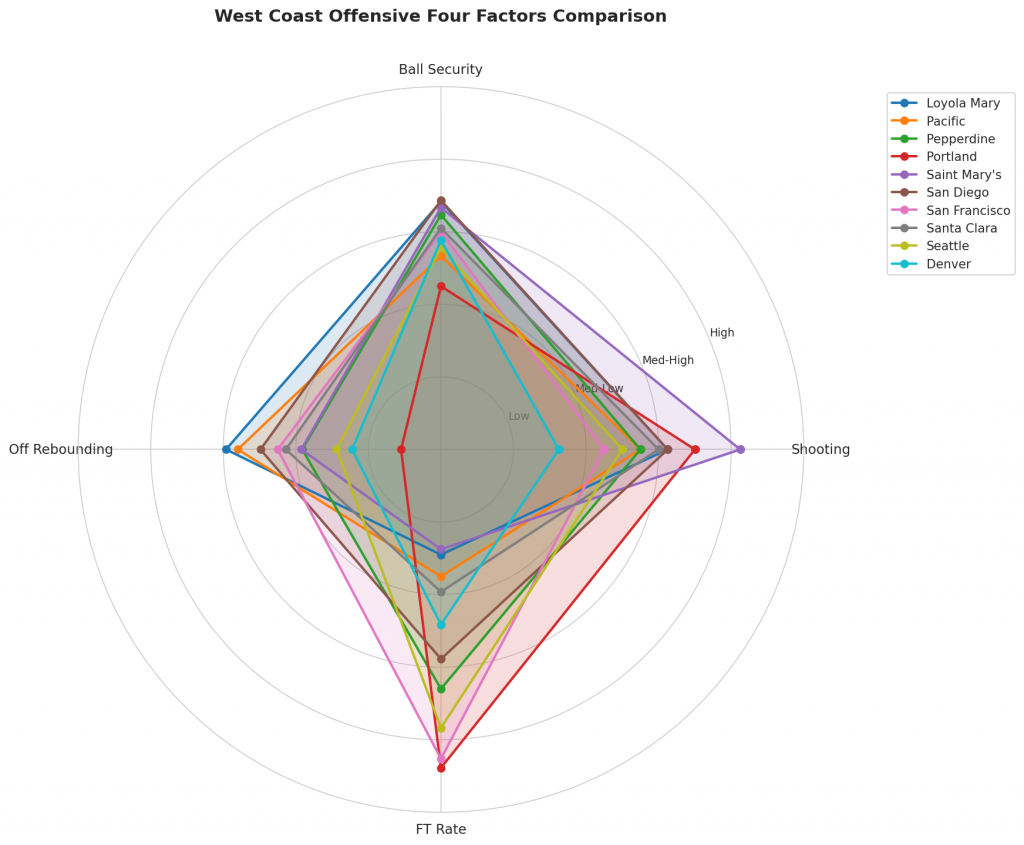
Figure 2: Offensive Four Factors comparison across West Coast teams. The radar chart shows each team’s shooting efficiency (eFG%), ball security (TOV%), offensive rebounding (OREB%), and free throw generation (FT Rate).
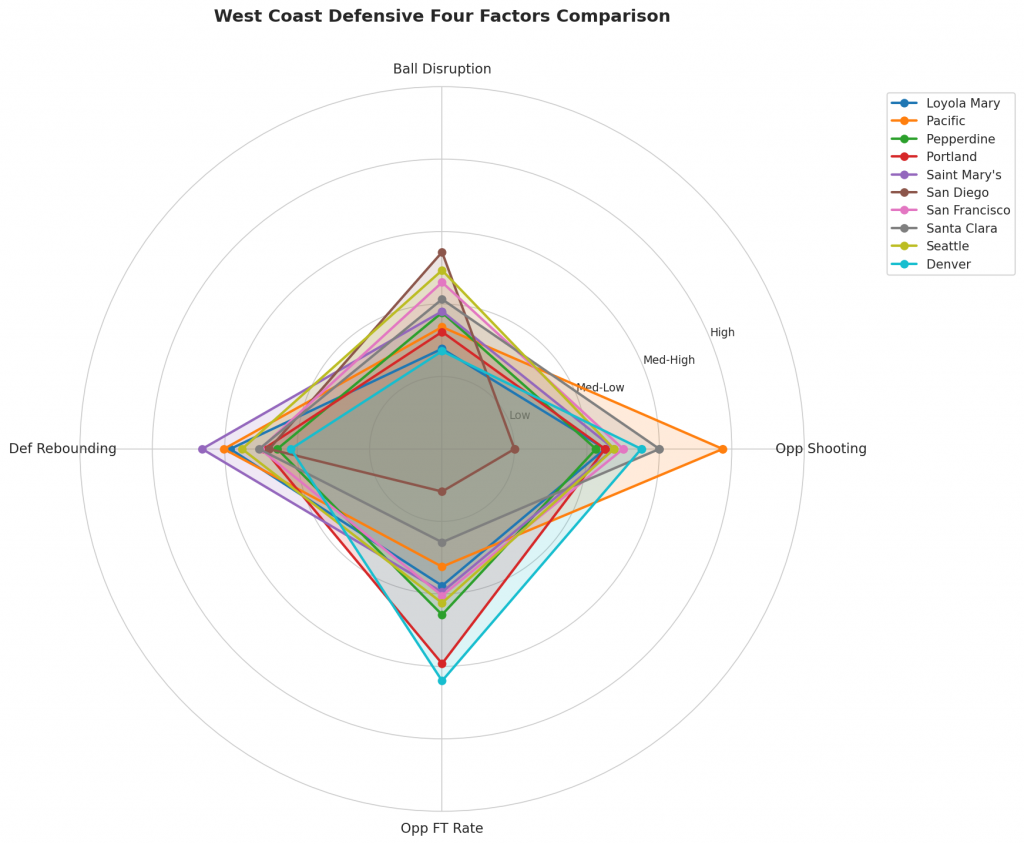
Figure 3: Defensive Four Factors comparison across West Coast teams. The radar chart shows each team’s opponent shooting defense (Opp eFG%), ball disruption (forcing TOV%), defensive rebounding (DREB%), and opponent free throw prevention (Opp FT Rate).
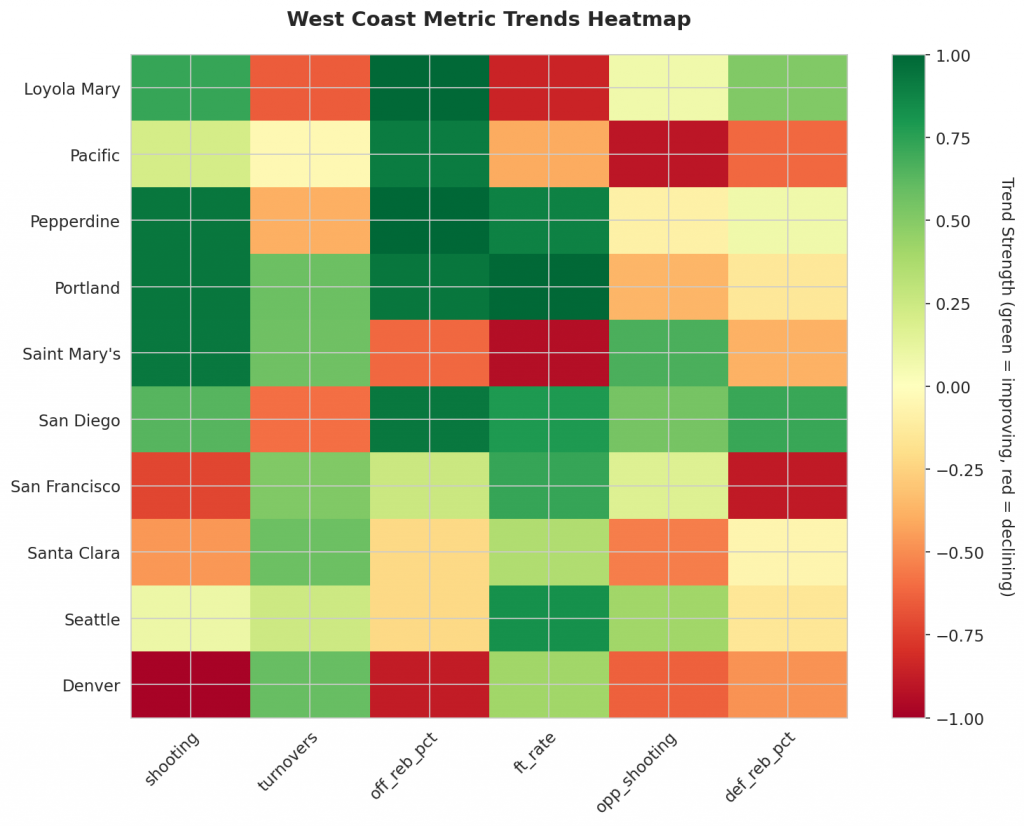
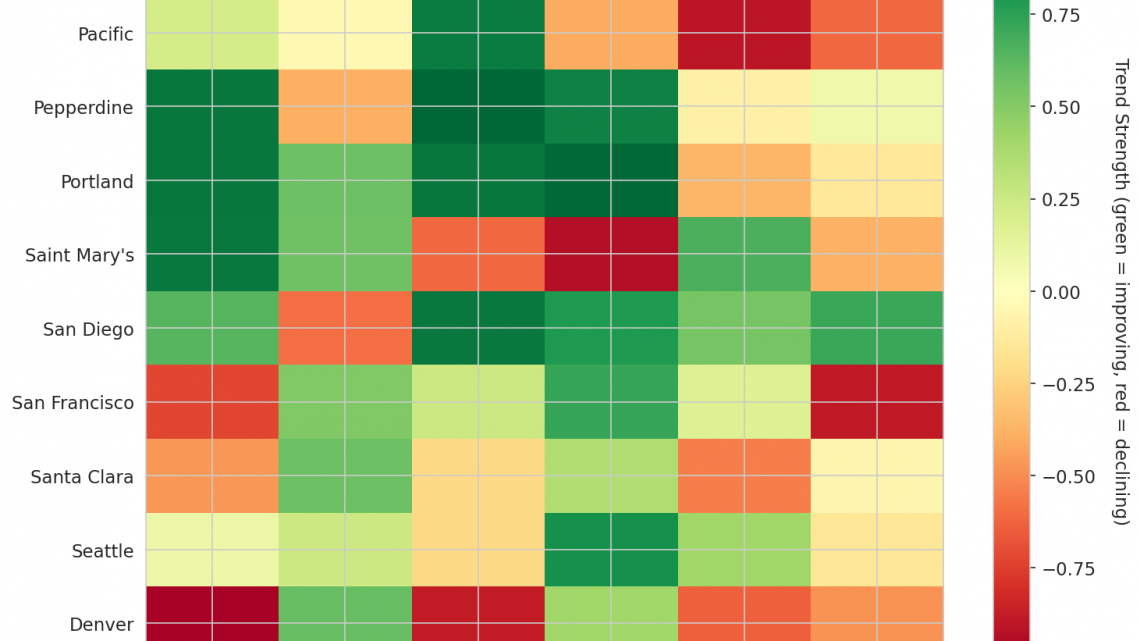
Figure 4: MACD trends heatmap showing which metrics are improving (green) or declining (red) for each team. Stronger colors indicate more pronounced trends.
Looking Ahead
As West Coast teams navigate the early stages of their season, the MACD trending indicators serve as a critical tool for distinguishing between genuine improvement and temporary variance. By analyzing magnitude data across key metrics, we can identify which programs are building sustainable trajectories rather than riding unsustainable momentum. The following analysis focuses on specific teams with significant shifts in performance over the first two weeks.
On the offensive end, several West Coast programs demonstrate strong upward trends that suggest evolving effectiveness. Loyola Mary exhibits a robust positive shift in shooting efficiency, maintaining a season average of 0.55 while trending strongly up; this indicates a clear increase in offensive value as the game progresses. Complementing this shot-making ability, Loyola Mary is also seeing marked improvement in second-chance scoring opportunities, with offensive rebound percentage rising strongly from a 0.387 season average. Similarly, Pacific is leveraging improved glass work on the offensive end, posting a strong upward trend in off-court rebound percentage despite a lower season average of 0.374. This suggests a developing ability to secure defensive boards that lead to additional points. Pepperdine follows a parallel offensive path, with shooting efficiency climbing strongly from a 0.52 season average, signaling an increasing capacity to convert possessions into field goals.
Defensive metrics reveal a more mixed picture among the conference teams, highlighting both areas of growth and concerning regressions. Pacific stands out for its defensive stability; while the opponent shooting percentage sits at 0.39 for the season, the metric is trending strongly down, meaning the team is increasingly effective at suppressing opposing shooting accuracy. Conversely, Saint Mary’s faces a significant challenge as opponent shooting percentage trends strongly up from a high base of 0.51. This directional increase signifies worsening defensive performance, allowing opponents to hit shots more frequently than in previous outings.
In terms of defensive possession and transition defense, San Diego is emerging as a stabilizing force. The program shows a strong upward trend in defensive rebound percentage (0.691 season average), indicating an improved ability to control the boards and deny second-chance points after securing them on defense. Further illustrating this commitment to disrupting opponent rhythm, San Francisco is successfully forcing more turnover-prone behavior from opponents. With opponent turnovers trending strongly up from a 0.188 season average, the Dons are demonstrating increased proficiency in creating extra possessions through defensive pressure.
These data points provide a snapshot of where specific West Coast programs stand early in the campaign. As the MACD indicators continue to evolve, they will offer further clarity on which teams are establishing consistent competitive advantages versus those facing potential regression.
Metrics Glossary
Four Factors (Dean Oliver’s framework for basketball success):
- eFG% (Effective Field Goal %): Field goal percentage adjusted for 3-pointers being worth more (FGM + 0.5×3PM) / FGA. Higher is better offensively, lower is better defensively.
- TOV% (Turnover Rate): Turnovers per 100 possessions. Lower is better offensively (taking care of the ball), higher is better defensively (forcing turnovers).
- OREB% / DREB% (Offensive/Defensive Rebound Rate): Percentage of available rebounds grabbed. Offensive rebounds create second-chance points; defensive rebounds end opponent possessions.
- FTR (Free Throw Rate): Free throws made per field goal attempt (FTM/FGA). Measures ability to get to the line AND convert. Higher is better offensively, lower is better defensively.
Other Metrics:
- Elo Rating: Chess-style rating system that updates based on game results and opponent strength. Higher Elo indicates stronger team.
- Efficiency Margin: Point differential per 100 possessions (Offensive Efficiency – Defensive Efficiency). Accounts for pace of play.
- MACD (Moving Average Convergence Divergence): Trend indicator comparing 12-game and 26-game exponential moving averages. Positive MACD = improving trend, Negative MACD = declining trend.
Analysis powered by HoopSci’s advanced metrics and MACD trending indicators.