Week 2: 2027’s Biggest Bullies
November 16, 2026College basketball efficiency rankings can be misleading. Some teams inflate their numbers by demolishing weaker opponents far beyond what statistical models predict, while simultaneously failing to meet expectations against quality competition.
This weekly feature identifies the biggest "bullies" in Division I basketball: teams whose efficiency metrics are artificially elevated by their performance against inferior opponents.
The rankings below count from #1 (biggest bully) to #25, highlighting teams that excel at padding stats against overmatched opponents while struggling to meet expectations against quality competition.
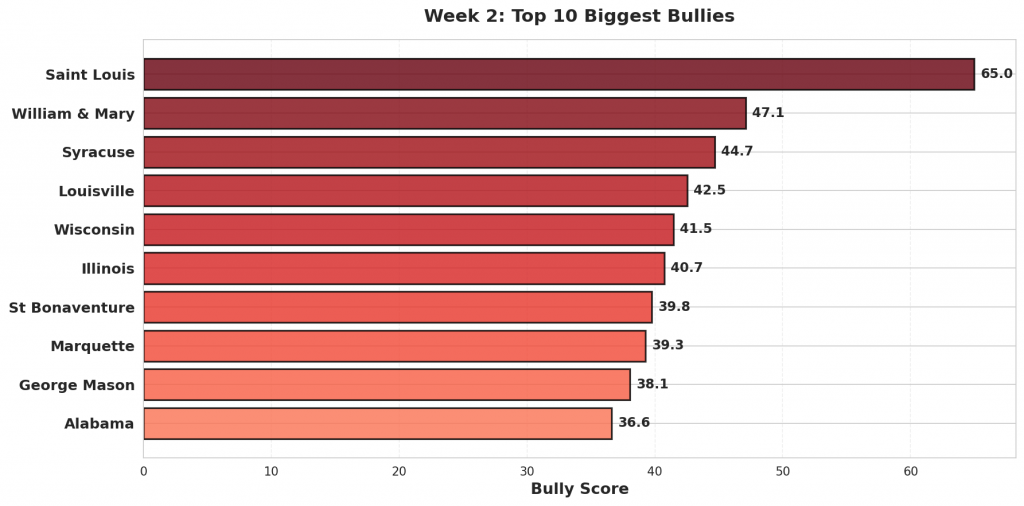
Figure 1: Top 10 teams with the highest bully scores in Week 2. Bully scores reflect the combination of overperformance against weak opponents and underperformance against quality competition.
#1: Saint Louis (3-1)
#37 Saint Louis was projected to beat #300 Northern Kentucky by 12. They cruised to a 125-63 victory, 50 points better than projected. Against #78 High Point, Saint Louis lost 68-58. They were projected to win by 13.
Bully Metrics: Exceeded projections by 49.9 total points against weak opponents (1 games); underperformed by 30.1 points against quality competition (2 games).
#2: William & Mary (2-2)
Against #358 Norfolk State, #178 William & Mary rolled to a 31-point win, 104-73. The model had them winning by 11; the actual margin was 31, outpacing the projection by 20. Facing #36 Michigan, William & Mary came up short, losing 123-79 after being projected to lose by 17.
Bully Metrics: Exceeded projections by 19.8 total points against weak opponents (1 games); underperformed by 27.4 points against quality competition (1 games).
#3: Syracuse (2-2)
#64 Syracuse faced #262 Central Connecticut as 10-point favorites and won handily 102-49, 43 points above the spread. Syracuse fell to #12 St. John’s 79-62, missing the 14-point projection by 2.
Bully Metrics: Exceeded projections by 43.4 total points against weak opponents (1 games); underperformed by 2.5 points against quality competition (2 games).
#4: Louisville (2-1)
Expected to win by 24 over #332 Morehead State, #49 Louisville coasted to a 107-57 win—beating the line by 26. The model had Louisville winning by 7 against #79 Memphis. Instead, they lost 98-78.
Bully Metrics: Exceeded projections by 25.5 total points against weak opponents (1 games); underperformed by 34.1 points against quality competition (2 games).
#5: Wisconsin (4-0)
#70 Wisconsin cruised to a 89-42 victory against #274 Fairfield. Favored by 18, the 47-point margin was +29 versus projection. Against #145 Delaware, Wisconsin won 73-64 but fell 12 points short of the 21-point projection.
Bully Metrics: Exceeded projections by 29.3 total points against weak opponents (1 games); underperformed by 12.2 points against quality competition (1 games).
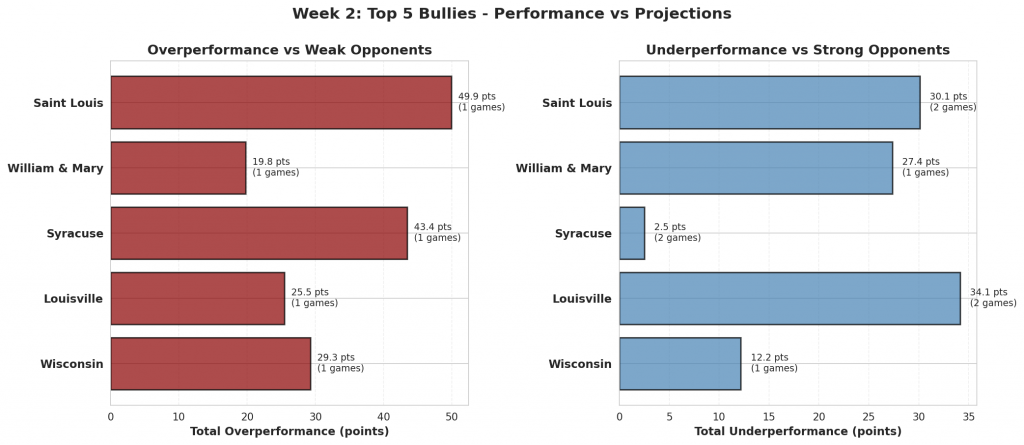
Figure 2: Performance comparison for the top 5 biggest bullies. Red bars show total overperformance against weak opponents; blue bars show total underperformance against strong opponents.
#6: Illinois (3-1)
The model gave #6 Illinois a 32-point edge over #352 Fairleigh Dickinson. They rolled to a 75-point win, 120-45, finishing 43 beyond the expected margin. Facing #30 Texas Tech, Illinois came up short, losing 84-78 after being projected to win by 8.
Bully Metrics: Exceeded projections by 53.6 total points against weak opponents (2 games); underperformed by 14.0 points against quality competition (1 games).
#7: St Bonaventure (3-1)
#47 St Bonaventure handled #353 Canisius, winning 88-49. That 39-point margin was a 33-point swing from the projection. St Bonaventure fell to #170 Youngstown State 79-71, missing the 8-point projection by 16.
Bully Metrics: Exceeded projections by 48.4 total points against weak opponents (2 games); underperformed by 15.5 points against quality competition (1 games).
#8: Marquette (2-2)
Facing #364 Detroit Mercy, #19 Marquette coasted to a 93-32 win. With a projected spread of 14, the result was 47 points past expectations. The model had Marquette winning by 4 against #15 Missouri. Instead, they lost 69-64.
Bully Metrics: Exceeded projections by 69.6 total points against weak opponents (2 games); underperformed by 9.0 points against quality competition (2 games).
#9: George Mason (3-1)
#114 George Mason was projected to beat #313 UMBC by 8. They won comfortably 82-54, 20 points better than projected. Against #171 Kansas City, George Mason won 76-68 but fell 19 points short of the 27-point projection.
Bully Metrics: Exceeded projections by 19.5 total points against weak opponents (1 games); underperformed by 18.6 points against quality competition (1 games).
#10: Alabama (4-0)
Against #279 Oakland, #35 Alabama rolled to a 41-point win, 109-68. The model had them winning by 13; the actual margin was 41, outpacing the projection by 28. Alabama beat #86 Seton Hall 82-76, though the 6-point margin was 9 below the projected spread.
Bully Metrics: Exceeded projections by 27.7 total points against weak opponents (1 games); underperformed by 8.9 points against quality competition (1 games).
#11: Saint Mary’s (3-1)
#39 Saint Mary’s faced #312 North Dakota State as 11-point favorites and won handily 105-64, 30 points above the spread. Saint Mary’s fell to #106 Nevada 96-95, missing the 9-point projection by 10.
Bully Metrics: Exceeded projections by 30.3 total points against weak opponents (1 games); underperformed by 18.8 points against quality competition (3 games).
#12: Oklahoma State (2-1)
Expected to win by 7 over #239 Queens University, #50 Oklahoma State coasted to a 118-68 win—beating the line by 43. The model had Oklahoma State losing by 11 against #23 Texas A&M. Instead, they lost 88-69.
Bully Metrics: Exceeded projections by 55.8 total points against weak opponents (2 games); underperformed by 8.4 points against quality competition (1 games).
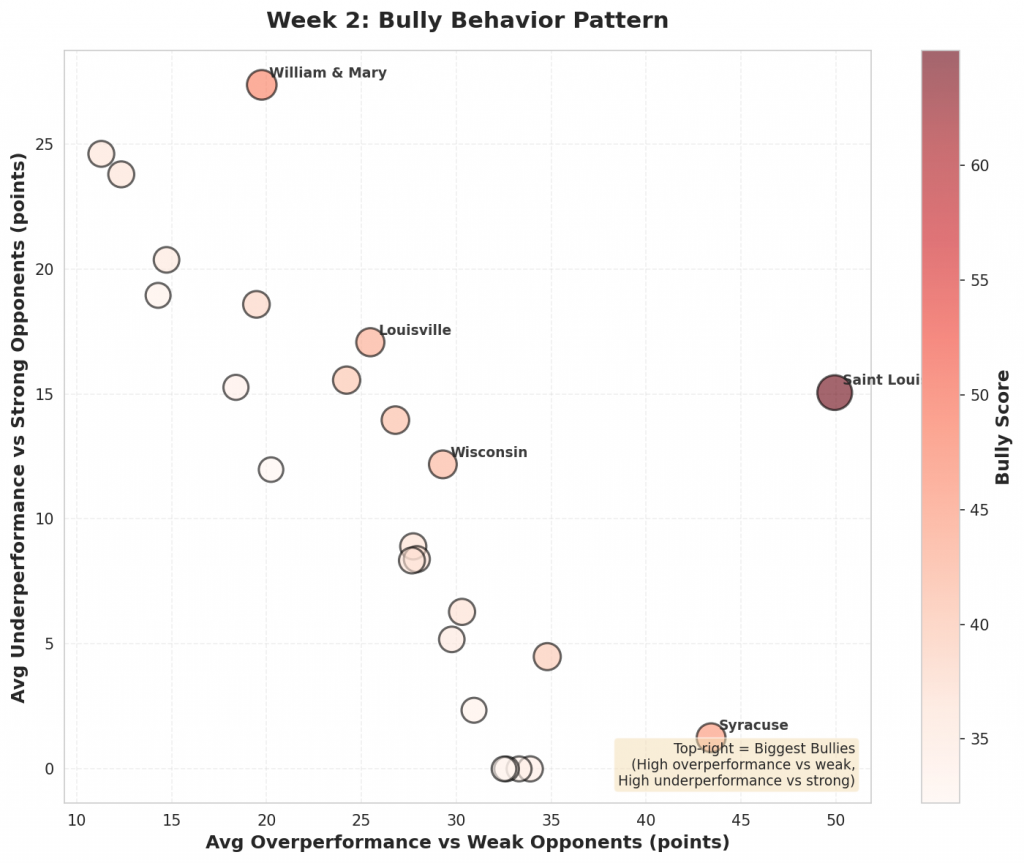
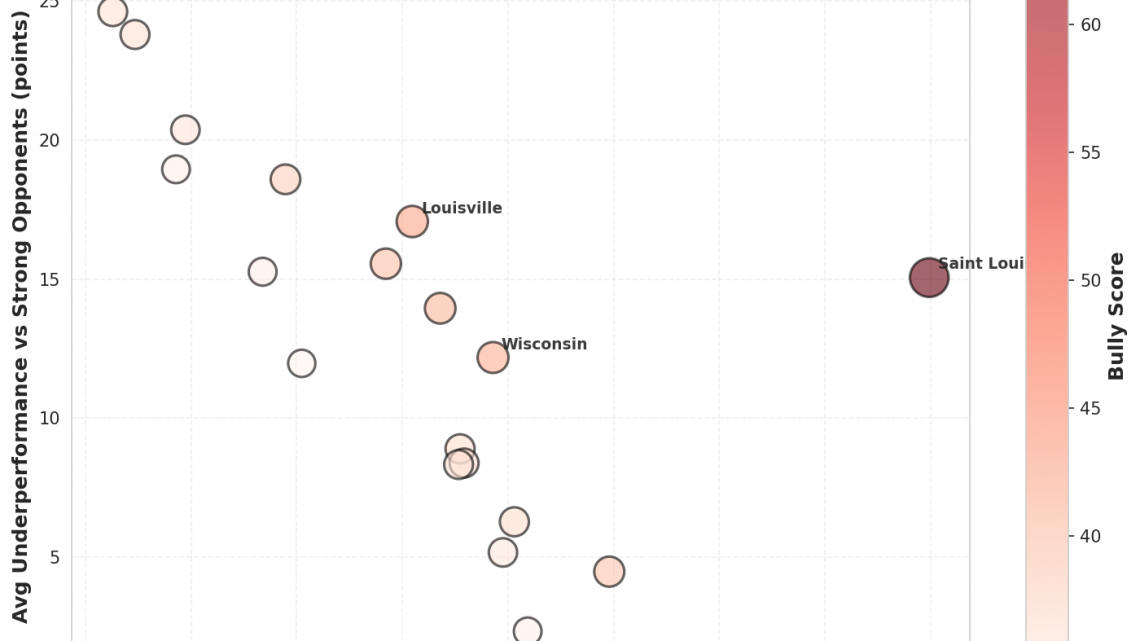
Figure 3: Scatter plot showing the relationship between overperformance against weak opponents (x-axis) and underperformance against strong opponents (y-axis). Bubble size and color indicate bully score magnitude. Top-right quadrant represents the biggest bullies.
#13: Iowa State (3-1)
#41 Iowa State cruised to a 84-47 victory against #317 Southern. Favored by 25, the 37-point margin was +12 versus projection. Against #79 Memphis, Iowa State lost 80-76. They were projected to win by 20.
Bully Metrics: Exceeded projections by 12.4 total points against weak opponents (1 games); underperformed by 23.8 points against quality competition (1 games).
#14: Nevada (2-2)
The model gave #106 Nevada a 9-point edge over #355 Robert Morris. They rolled to a 37-point win, 86-49, finishing 28 beyond the expected margin. Facing #21 UC Santa Barbara, Nevada came up short, losing 76-63 after being projected to win by 2.
Bully Metrics: Exceeded projections by 27.7 total points against weak opponents (1 games); underperformed by 25.0 points against quality competition (3 games).
#15: Dayton (1-3)
#198 Dayton handled #330 NJIT, winning 89-58. That 31-point margin was a 11-point swing from the projection. Dayton fell to #175 Northern Illinois 81-76, missing the 26-point projection by 31.
Bully Metrics: Exceeded projections by 11.3 total points against weak opponents (1 games); underperformed by 73.8 points against quality competition (3 games).
#16: Columbia (3-1)
Facing #363 Stonehill, #135 Columbia took care of business, winning 75-55. With a projected spread of 5, the result was 15 points past expectations. The model had Columbia winning by 7 against #176 Elon. Instead, they lost 84-71.
Bully Metrics: Exceeded projections by 29.5 total points against weak opponents (2 games); underperformed by 20.4 points against quality competition (1 games).
#17: Baylor (3-1)
#34 Baylor was projected to beat #365 Arkansas-Pine Bluff by 21. They cruised to a 109-53 victory, 35 points better than projected. Against #17 Texas, Baylor lost 75-72. They were projected to win by 2.
Bully Metrics: Exceeded projections by 59.5 total points against weak opponents (2 games); underperformed by 5.2 points against quality competition (1 games).
#18: UCLA (3-0)
Against #365 Arkansas-Pine Bluff, #4 UCLA rolled to a 69-point win, 106-37. The model had them winning by 26; the actual margin was 69, outpacing the projection by 43. To their credit, UCLA met expectations against stronger #58 Arizona, suggesting they may simply be that good rather than inflating numbers against weak competition.
Bully Metrics: Exceeded projections by 67.8 total points against weak opponents (2 games); underperformed by 0.0 points against quality competition (1 games).
#19: Butler (2-2)
#112 Butler faced #292 Lafayette as 18-point favorites and won handily 96-60, 18 points above the spread. Butler fell to #81 Boise State 100-81, missing the 2-point projection by 17.
Bully Metrics: Exceeded projections by 18.4 total points against weak opponents (1 games); underperformed by 30.5 points against quality competition (2 games).
#20: Missouri (3-1)
Expected to win by 18 over #359 Cleveland State, #15 Missouri coasted to a 111-50 win—beating the line by 43. To their credit, Missouri met expectations against stronger #37 Saint Louis, suggesting they may simply be that good rather than inflating numbers against weak competition.
Bully Metrics: Exceeded projections by 66.6 total points against weak opponents (2 games); underperformed by 0.0 points against quality competition (2 games).
#21: URI (5-0)
#75 URI cruised to a 103-59 victory against #323 Holy Cross. Favored by 13, the 44-point margin was +31 versus projection. Against #165 Princeton, URI won 79-72 but fell 5 points short of the 12-point projection.
Bully Metrics: Exceeded projections by 30.9 total points against weak opponents (1 games); underperformed by 4.7 points against quality competition (2 games).
#22: Davidson (3-1)
The model gave #108 Davidson a 3-point edge over #260 Bradley. They secured a 17-point victory, 62-45, finishing 14 beyond the expected margin. Facing #164 Howard, Davidson came up short, losing 64-58 after being projected to win by 13.
Bully Metrics: Exceeded projections by 14.3 total points against weak opponents (1 games); underperformed by 18.9 points against quality competition (1 games).
#23: Xavier (4-0)
#7 Xavier handled #276 Mount St. Mary’s, winning 97-52. That 45-point margin was a 35-point swing from the projection. To their credit, Xavier met expectations against stronger #68 Mississippi State, suggesting they may simply be that good rather than inflating numbers against weak competition.
Bully Metrics: Exceeded projections by 65.3 total points against weak opponents (2 games); underperformed by 0.0 points against quality competition (1 games).
#24: Duke (3-1)
Facing #206 Coastal Carolina, #14 Duke coasted to a 113-52 win. With a projected spread of 28, the result was 32 points past expectations. To their credit, Duke met expectations against stronger #3 Michigan State, suggesting they may simply be that good rather than inflating numbers against weak competition.
Bully Metrics: Exceeded projections by 32.5 total points against weak opponents (1 games); underperformed by 0.0 points against quality competition (1 games).
#25: UNC (3-1)
#98 UNC was projected to beat #293 Wofford by 19. They cruised to a 109-70 victory, 20 points better than projected. Against #92 Georgia, UNC lost 78-70. They were projected to win by 13.
Bully Metrics: Exceeded projections by 20.2 total points against weak opponents (1 games); underperformed by 35.9 points against quality competition (3 games).
The "Flat-Track Bullies" phenomenon represents a critical nuance in analyzing college basketball spreads and betting markets. These teams possess the ability to dismantle inferior competition with relentless intensity, maintaining their physical standard across all 40 minutes regardless of the scoreboard differential. Consequently, they frequently serve as safe selections for covering large point spreads when facing bottom-tier opponents. Their efficiency metrics against these foes are robust because their defensive and offensive output remains consistently high when the opponent lacks the capacity to answer back.
However, caution is advised when these same squads face quality competition. The data indicates that their overall efficiency numbers often contain an artificial inflation derived strictly from "bully behavior" against weaker teams. Against well-coached, athletic opponents capable of punching back, these teams frequently underperform relative to their status as heavy favorites. Relying on inflated metrics in this scenario can lead to unfavorable outcomes, as the dynamic shifts from one-sided domination to a competitive struggle where these teams fail to replicate their dominant efficiency levels. For bettors and analysts alike, the key takeaway is that while these programs are reliable favorites against inferior talent, their value proposition diminishes significantly against high-caliber competition.
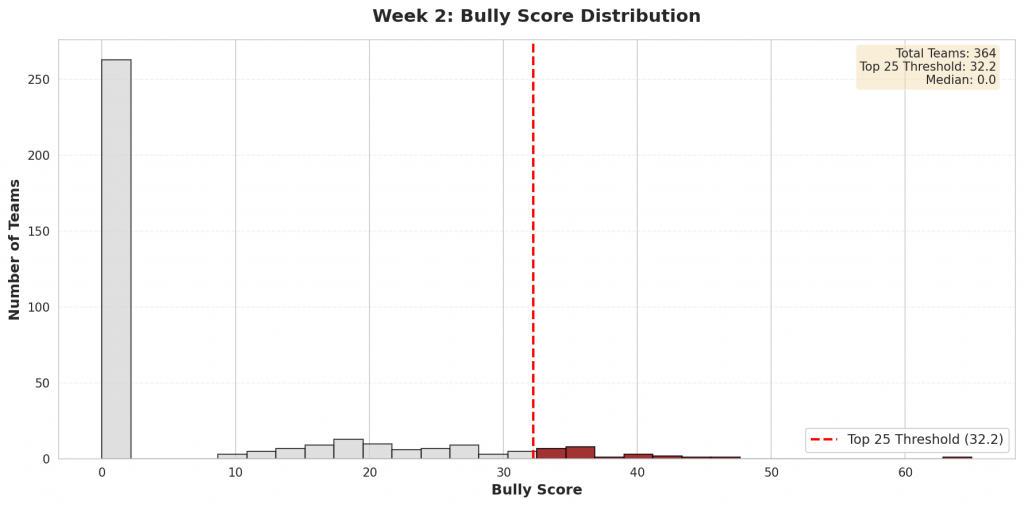
Figure 4: Distribution of bully scores across all Division I teams. The top 25 bullies (highlighted in red) represent teams whose efficiency metrics are most inflated by their performance patterns.
Check back next week for updated bully rankings.