WAC Update: Week 12
January 26, 2026WAC Teams Show Diverse Trends Heading into Week 12
The Western Athletic Conference (WAC) enters its final stretch of regular-season play, and the teams are exhibiting a mix of upward and downward momentum. By analyzing shooting efficiency momentum, we can identify trends in offense and defense that could impact each team’s performance.
Offensive Trends
- Utah Valley’s shooting percentage has been trending down strongly this season, with a current average of 0.55. This decline is likely to continue.
- In contrast, Southern Utah’s shooting percentage has improved significantly, rising from an initial downward trend to now show strong upward momentum.
- California Baptist and Utah Tech are also experiencing improvements in their shooting percentages, albeit at a slower pace than Southern Utah.
Defensive Trends
- Utah Valley’s defensive rebounding efficiency is trending down strongly, which could be a concern as they face tougher opponents.
- Conversely, Utah Valley’s opponent turnover rate has increased, making it more challenging for them to force turnovers on defense.
- California Baptist and Utah Tech are both showing improvements in their defensive performance, with the former experiencing a decrease in opponent shooting percentage.
Key Takeaways
Utah Valley faces challenges on both ends of the court, as its offense struggles with declining shooting and its defense grapples with worsening rebounding efficiency. Meanwhile, Southern Utah’s shooting improvement could provide a boost to its offense, while California Baptist and Utah Tech are experiencing defensive upgrades.
The diverse trends within the WAC will undoubtedly influence team dynamics in Week 12. As these teams navigate their final regular-season games, understanding these momentum shifts can help inform predictions for conference tournament success.
Data-Driven Insights
By focusing on shooting efficiency momentum indicators, we can identify areas where teams are trending upward or downward. In this analysis, the strongest upward trends were found among Southern Utah’s shooting percentage and California Baptist’s opponent shooting percentage. Conversely, Utah Valley’s defensive rebounding efficiency is trending down strongly, which could impact their chances in upcoming games.
Conclusion
As the WAC enters its final stretch of regular-season play, teams are exhibiting a mix of momentum shifts that will likely influence conference tournament outcomes. By understanding these trends through shooting efficiency momentum indicators, coaches and analysts can gain valuable insights into team performance.
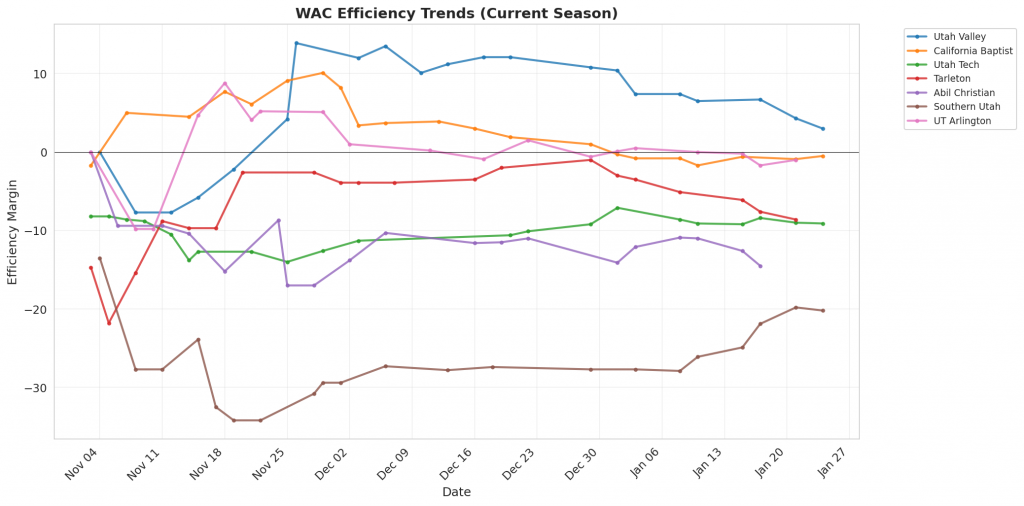
Figure 1: Efficiency margin trends for WAC teams throughout the season. Teams trending upward show improving performance, while downward trends indicate struggles.
Conference Snapshot
- Week Dates: January 19 – January 25, 2026
- Trending Up (Efficiency): California Baptist, Utah Tech, Southern Utah
- Trending Down (Efficiency): Utah Valley, Tarleton, Abil Christian, UT Arlington
Team-by-Team Analysis
Abil Christian
Record: 10-9 | Elo: 1486.1 (ranked 204 of 365) | Efficiency Margin: -14.51 (ranked 288 of 365)
Offensive Trends:
- Off Reb Pct (Offensive Rebounding): Currently ranked 161 of 365 in D1. Trending down strongly 🔴.
- Shooting (Shooting): Currently ranked 322 of 365 in D1. Trending down moderately 🔴.
Defensive Trends:
- Opp Shooting (Opp Shooting): Currently ranked 333 of 365 in D1. Trending up moderately 🔴.
- Opp Turnovers (Opp Turnovers): Currently ranked 10 of 365 in D1. Trending down moderately 🔴.
California Baptist
Record: 15-6 | Elo: 1565.5 (ranked 98 of 365) | Efficiency Margin: -0.50 (ranked 165 of 365)
Offensive Trends:
- Shooting (Shooting): Currently ranked 261 of 365 in D1. Trending up moderately 🟢.
- Turnovers (Turnovers): Currently ranked 263 of 365 in D1. Trending down moderately 🟢.
Defensive Trends:
- Opp Shooting (Opp Shooting): Currently ranked 34 of 365 in D1. Trending down strongly 🟢.
- Opp Turnovers (Opp Turnovers): Currently ranked 201 of 365 in D1. Trending down moderately 🔴.
Southern Utah
Record: 7-14 | Elo: 1390.2 (ranked 319 of 365) | Efficiency Margin: -20.22 (ranked 329 of 365)
Offensive Trends:
- Shooting (Shooting): Currently ranked 254 of 365 in D1. Trending up strongly 🟢.
- Turnovers (Turnovers): Currently ranked 336 of 365 in D1. Trending up weakly 🔴.
Defensive Trends:
- Opp Shooting (Opp Shooting): Currently ranked 278 of 365 in D1. Trending down strongly 🟢.
- Opp Turnovers (Opp Turnovers): Currently ranked 330 of 365 in D1. Trending down strongly 🔴.
Tarleton
Record: 11-9 | Elo: 1469.2 (ranked 232 of 365) | Efficiency Margin: -8.63 (ranked 234 of 365)
Offensive Trends:
- Turnovers (Turnovers): Currently ranked 307 of 365 in D1. Trending down moderately 🟢.
- Off Reb Pct (Offensive Rebounding): Currently ranked 196 of 365 in D1. Trending down moderately 🔴.
Defensive Trends:
- Opp Shooting (Opp Shooting): Currently ranked 344 of 365 in D1. Trending up strongly 🔴.
- Opp Turnovers (Opp Turnovers): Currently ranked 1 of 365 in D1. Trending up weakly 🟢.
UT Arlington
Record: 13-6 | Elo: 1533.2 (ranked 137 of 365) | Efficiency Margin: -1.01 (ranked 172 of 365)
Offensive Trends:
- Shooting (Shooting): Currently ranked 262 of 365 in D1. Trending down moderately 🔴.
- Turnovers (Turnovers): Currently ranked 360 of 365 in D1. Trending up weakly 🔴.
Defensive Trends:
- Opp Shooting (Opp Shooting): Currently ranked 33 of 365 in D1. Trending down moderately 🟢.
- Opp Turnovers (Opp Turnovers): Currently ranked 98 of 365 in D1. Trending up moderately 🟢.
Utah Tech
Record: 10-11 | Elo: 1408.3 (ranked 295 of 365) | Efficiency Margin: -9.10 (ranked 238 of 365)
Offensive Trends:
- Turnovers (Turnovers): Currently ranked 215 of 365 in D1. Trending down strongly 🟢.
- Off Reb Pct (Offensive Rebounding): Currently ranked 251 of 365 in D1. Trending down moderately 🔴.
Defensive Trends:
- Opp Turnovers (Opp Turnovers): Currently ranked 152 of 365 in D1. Trending down strongly 🔴.
- Opp Shooting (Opp Shooting): Currently ranked 195 of 365 in D1. Trending down moderately 🟢.
Utah Valley
Record: 15-6 | Elo: 1617.5 (ranked 59 of 365) | Efficiency Margin: +2.95 (ranked 135 of 365)
Offensive Trends:
- Shooting (Shooting): Currently ranked 50 of 365 in D1. Trending down strongly 🔴.
- Turnovers (Turnovers): Currently ranked 347 of 365 in D1. Trending down weakly 🟢.
Defensive Trends:
- Opp Shooting (Opp Shooting): Currently ranked 117 of 365 in D1. Trending up strongly 🔴.
- Opp Turnovers (Opp Turnovers): Currently ranked 22 of 365 in D1. Trending up strongly 🟢.
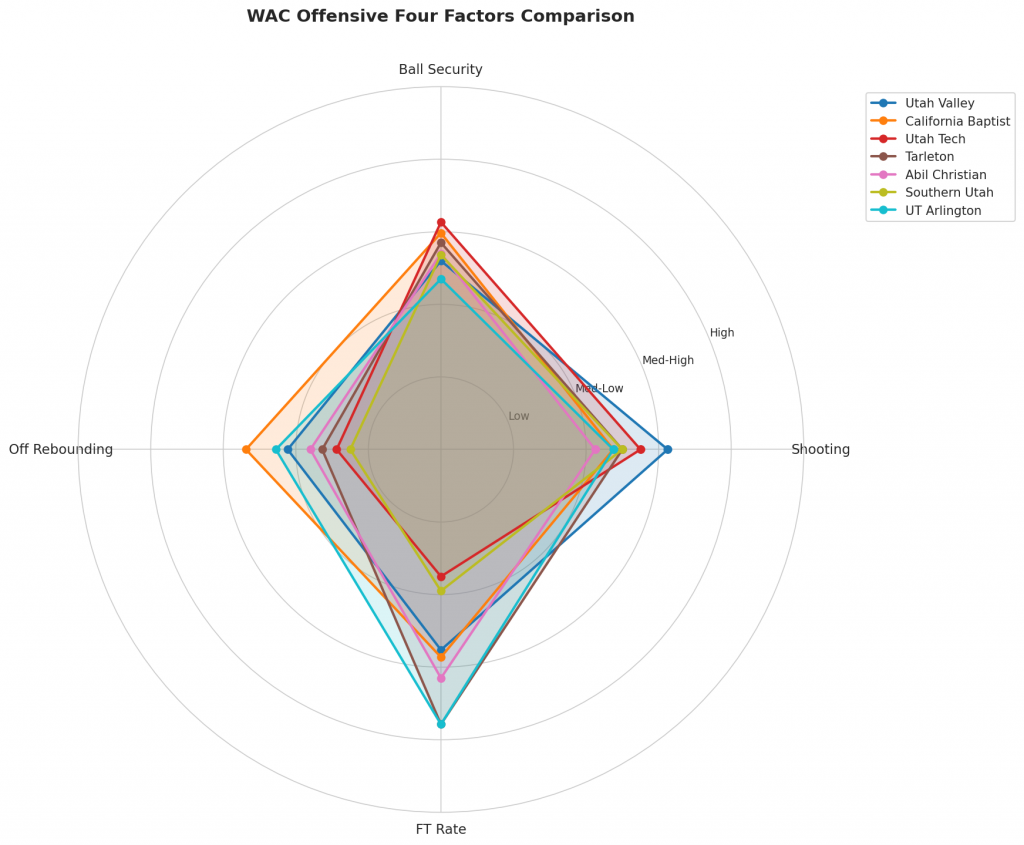
Figure 2: Offensive Four Factors comparison across WAC teams. The radar chart shows each team’s shooting efficiency (eFG%), ball security (TOV%), offensive rebounding (OREB%), and free throw generation (FT Rate).
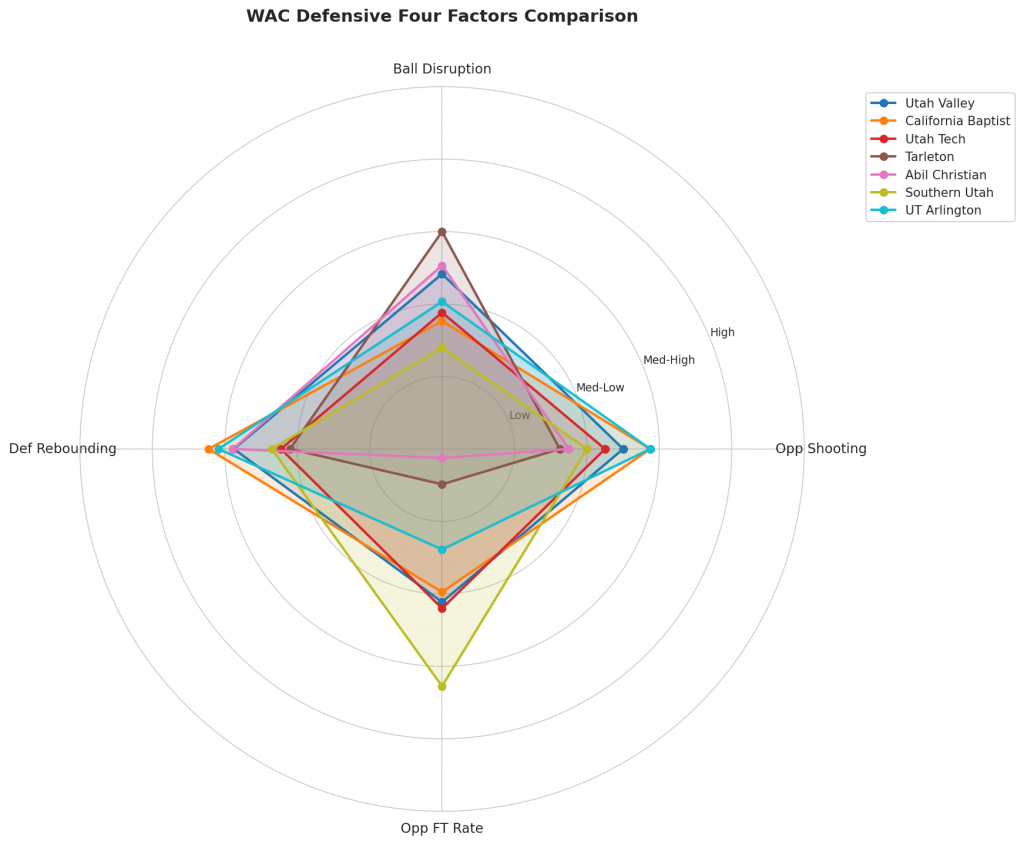
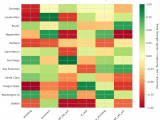
Figure 3: Defensive Four Factors comparison across WAC teams. The radar chart shows each team’s opponent shooting defense (Opp eFG%), ball disruption (forcing TOV%), defensive rebounding (DREB%), and opponent free throw prevention (Opp FT Rate).
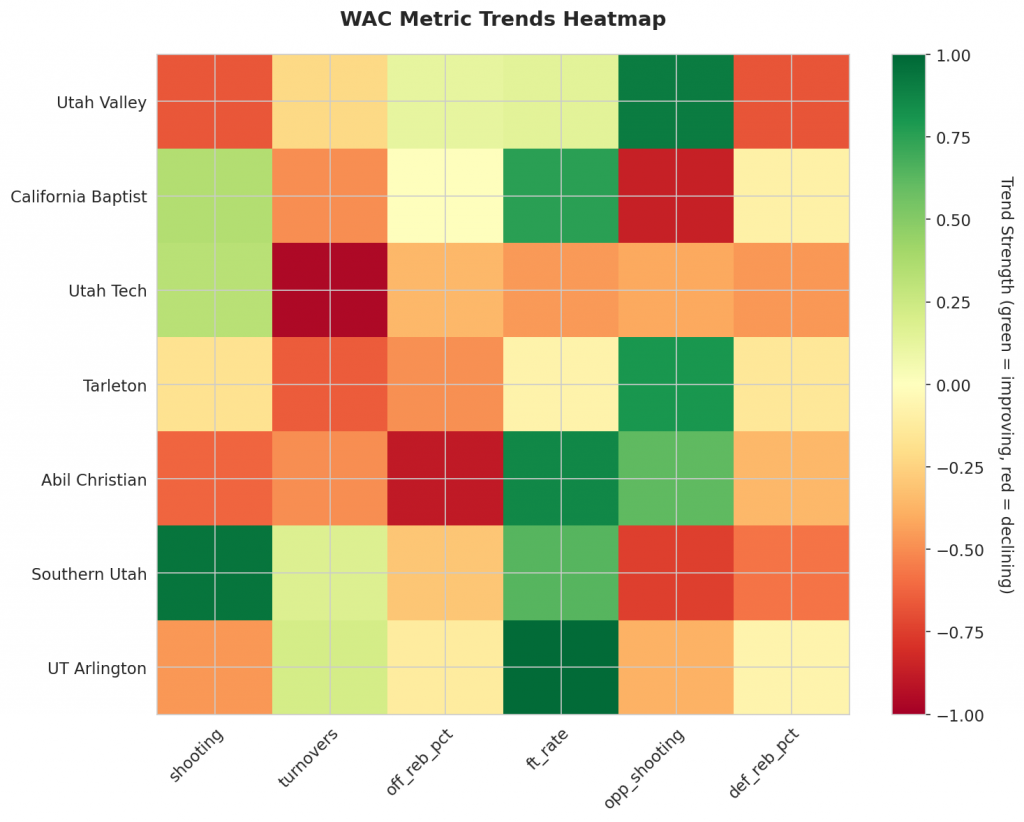
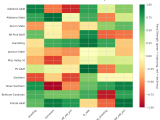
Figure 4: MACD trends heatmap showing which metrics are improving (green) or declining (red) for each team. Stronger colors indicate more pronounced trends.
Looking Ahead
WAC Teams Show Improvement and Decline in Key Metrics
As the Western Athletic Conference (WAC) continues its season, HoopSci’s analysis highlights key trends in offense and defense that are worth monitoring.
Utah Valley Struggles on Both Ends of the Court
The Utah Valley team is experiencing a downturn in several areas. Their shooting has worsened, with a season average of 0.55 trending downward significantly. This decline in shooting ability is reflected in their overall performance, which has scored poorly. Additionally, they are struggling to contain opponents’ shooting, allowing an average of 0.5 points per game.
Utah Tech Sees Improvement in Turnovers
On the other hand, Utah Tech is showing improvement in turnovers, with a season average of 0.162 trending downward strongly. This suggests that they are doing a better job at limiting their own mistakes and capitalizing on opponents’ errors.
Southern Utah’s Shooting on the Rise
Southern Utah is seeing an uptick in shooting, with a season average of 0.5 trending upward significantly. This improvement in scoring ability could be a crucial factor in their overall success this season.
California Baptist Tightens Up Defense
California Baptist has been successful in limiting opponents’ shooting, with a season average of 0.47 trending downward strongly. This improved defensive effort will likely contribute to their team’s performance moving forward.
The Moving Average Convergence Divergence (MACD) momentum indicator provides valuable insights into which teams are genuinely improving versus those that may be experiencing unsustainable success. The MACD is calculated by subtracting the exponential moving average of a shorter period from that of a longer period, resulting in a momentum line that indicates overbought or oversold conditions. A rising MACD line often signifies genuine improvement, while a falling line may indicate potential decline among WAC teams.
Check back next week for updated analysis as the MACD trending indicators continue to identify genuine improvement and potential decline among WAC teams.
Metrics Glossary
Four Factors (Dean Oliver’s framework for basketball success):
- eFG% (Effective Field Goal %): Field goal percentage adjusted for 3-pointers being worth more (FGM + 0.5×3PM) / FGA. Higher is better offensively, lower is better defensively.
- TOV% (Turnover Rate): Turnovers per 100 possessions. Lower is better offensively (taking care of the ball), higher is better defensively (forcing turnovers).
- OREB% / DREB% (Offensive/Defensive Rebound Rate): Percentage of available rebounds grabbed. Offensive rebounds create second-chance points; defensive rebounds end opponent possessions.
- FTR (Free Throw Rate): Free throws made per field goal attempt (FTM/FGA). Measures ability to get to the line AND convert. Higher is better offensively, lower is better defensively.
Other Metrics:
- Elo Rating: Chess-style rating system that updates based on game results and opponent strength. Higher Elo indicates stronger team.
- Efficiency Margin: Point differential per 100 possessions (Offensive Efficiency – Defensive Efficiency). Accounts for pace of play.
- MACD (Moving Average Convergence Divergence): Trend indicator comparing 12-game and 26-game exponential moving averages. Positive MACD = improving trend, Negative MACD = declining trend.
Analysis powered by HoopSci’s advanced metrics and MACD trending indicators.