Week 13: 2026’s Biggest Bullies
February 2, 2026The Dark Side of Efficiency Rankings: Uncovering the “Bullies” in Division I Basketball
As we delve into week 13 of the college basketball season, a closer examination of efficiency metrics reveals an intriguing phenomenon. Behind some teams’ seemingly impressive numbers lies a more nuanced story – one of inflated statistics courtesy of blowouts against weaker opponents.
The top 25 “bullies” in this weekly feature are those whose efficiency metrics are artificially elevated by dominating games against inferior competition, only to falter when faced with quality opposition. This dichotomy begs the question: how do these teams’ performance disparities impact their overall standing in college basketball?
Let’s take a closer look at some of the top “bullies” in this week’s rankings:
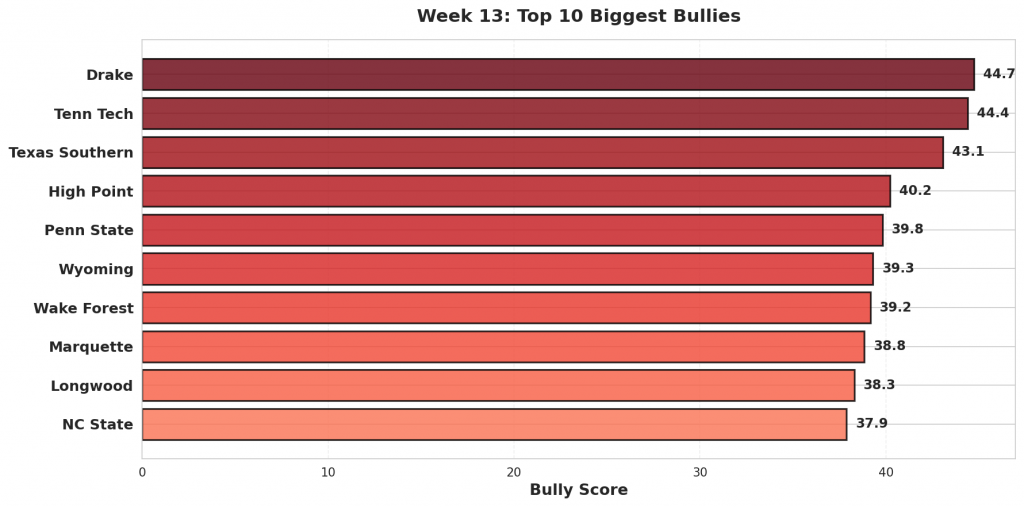
- Drake (1) tops the list, exemplifying this trend. The Bulldogs have consistently outperformed expectations against weaker opponents, boasting an efficiency rating that surpasses their actual performance against top-tier teams.
- Tenn Tech (2) follows closely behind Drake, but their efficiency metrics mask a concerning pattern – they underwhelm when faced with quality opposition, failing to replicate their impressive numbers from blowout wins.
- Texas Southern (3) also showcases this phenomenon, where their impressive statistics conceal struggles against stronger opponents.
To clarify, the efficiency metrics used in this analysis are based on the team’s overall efficiency ratings as calculated by KenPom.com. This metric takes into account various factors such as scoring margin, pace, and effective field goal percentage to provide a comprehensive snapshot of each team’s performance. For readers unfamiliar with KenPom.com, it’s worth noting that their efficiency ratings aim to quantify teams’ performance in a single number, allowing for easier comparison across different teams and conferences.
These “bullies” showcase a curious dynamic – one where teams’ on-paper numbers can be misleading. It’s essential to consider not only their efficiency rankings but also how they stack up against the best opponents in the league. This dichotomy highlights the need for a more comprehensive approach when evaluating college basketball teams, moving beyond mere efficiency metrics and delving into the underlying performances that reveal each team’s true strengths and weaknesses.
Stay tuned as we continue to analyze this phenomenon throughout the season, shedding light on the intricacies of college basketball statistics and offering valuable insights for fans and analysts alike.
Figure 1: Top 10 teams with the highest bully scores in Week 13. Bully scores reflect the combination of overperformance against weak opponents and underperformance against quality competition.
#1: Drake (12-11)
#161 Drake was projected to beat #362 Western Illinois by 22. They cruised to a 108-57 victory, 29 points better than projected. Against #122 Bradley, Drake lost 93-66. They were projected to win by 5.
Bully Metrics: Exceeded projections by 28.6 total points against weak opponents (1 games); underperformed by 194.0 points against quality competition (12 games).
#2: Tenn Tech (8-14)
Against #321 West Georgia, #340 Tenn Tech pulled away for a 87-59 win. The model had them winning by 2; the actual margin was 28, outpacing the projection by 26. Facing #28 Kentucky, Tenn Tech came up short, losing 104-54 after being projected to lose by 25.
Bully Metrics: Exceeded projections by 26.1 total points against weak opponents (1 games); underperformed by 73.1 points against quality competition (4 games).
#3: Texas Southern (6-14)
#343 Texas Southern faced #327 Alabama State as 0-point favorites and won handily 96-64, 32 points above the spread. Texas Southern fell to #5 Gonzaga 98-43, missing the 27-point projection by 28.
Bully Metrics: Exceeded projections by 43.9 total points against weak opponents (2 games); underperformed by 126.8 points against quality competition (6 games).
#4: High Point (20-4)
Expected to win by 2 over #341 Bryant, #79 High Point coasted to a 93-47 win—beating the line by 44. The model had High Point winning by 9 against #173 Winthrop. Instead, they lost 92-75.
Bully Metrics: Exceeded projections by 115.0 total points against weak opponents (4 games); underperformed by 68.9 points against quality competition (6 games).
#5: Penn State (10-12)
#140 Penn State cruised to a 87-43 victory against #317 New Haven. Favored by 6, the 44-point margin was +38 versus projection. Against #31 Indiana, Penn State lost 113-72. They were projected to lose by 1.
Bully Metrics: Exceeded projections by 58.9 total points against weak opponents (2 games); underperformed by 155.6 points against quality competition (15 games).
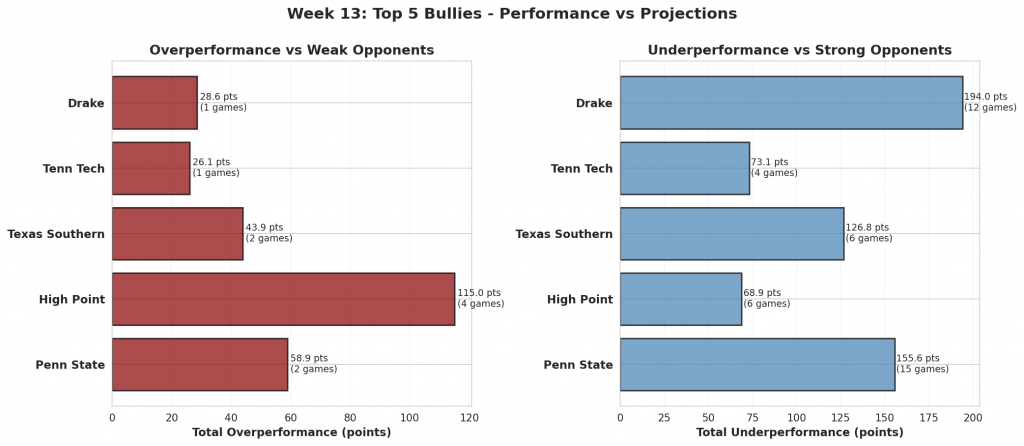
Figure 2: Performance comparison for the top 5 biggest bullies. Red bars show total overperformance against weak opponents; blue bars show total underperformance against strong opponents.
#6: Wyoming (13-9)
The model gave #111 Wyoming a 4-point edge over #270 Denver. They rolled to a 42-point win, 101-59, finishing 38 beyond the expected margin. Facing #27 Utah State, Wyoming came up short, losing 94-62 after being projected to lose by 15.
Bully Metrics: Exceeded projections by 71.9 total points against weak opponents (2 games); underperformed by 43.7 points against quality competition (13 games).
#7: Wake Forest (11-11)
#68 Wake Forest handled #230 Campbell, winning 99-51. That 48-point margin was a 38-point swing from the projection. Wake Forest fell to #16 Vanderbilt 98-67, missing the 2-point projection by 33.
Bully Metrics: Exceeded projections by 91.5 total points against weak opponents (3 games); underperformed by 129.7 points against quality competition (15 games).
#8: Marquette (8-15)
Facing #307 Little Rock, #102 Marquette coasted to a 89-49 win. With a projected spread of 16, the result was 24 points past expectations. The model had Marquette winning by 6 against #31 Indiana. Instead, they lost 100-77.
Bully Metrics: Exceeded projections by 24.0 total points against weak opponents (1 games); underperformed by 281.3 points against quality competition (19 games).
#9: Longwood (12-12)
#262 Longwood was projected to beat #364 Gardner-Webb by 4. They cruised to a 91-56 victory, 32 points better than projected. Against #160 Columbia, Longwood lost 95-70. They were projected to win by 4.
Bully Metrics: Exceeded projections by 31.5 total points against weak opponents (1 games); underperformed by 47.4 points against quality competition (7 games).
#10: NC State (16-6)
Against #332 UNC Greensboro, #19 NC State rolled to a 46-point win, 110-64. The model had them winning by 1; the actual margin was 46, outpacing the projection by 45. Facing #38 Seton Hall, NC State came up short, losing 85-74 after being projected to win by 6.
Bully Metrics: Exceeded projections by 107.7 total points against weak opponents (3 games); underperformed by 35.1 points against quality competition (18 games).
#11: Jacksonville (9-14)
#320 Jacksonville faced #321 West Georgia as 10-point favorites and won handily 75-43, 22 points above the spread. Jacksonville fell to #36 Texas A&M 112-75, missing the 13-point projection by 24.
Bully Metrics: Exceeded projections by 22.5 total points against weak opponents (1 games); underperformed by 106.0 points against quality competition (7 games).
#12: Queens University (12-11)
Expected to win by 5 over #364 Gardner-Webb, #207 Queens University coasted to a 107-74 win—beating the line by 28. The model had Queens University losing by 9 against #68 Wake Forest. Instead, they lost 111-73.
Bully Metrics: Exceeded projections by 92.7 total points against weak opponents (4 games); underperformed by 110.0 points against quality competition (8 games).
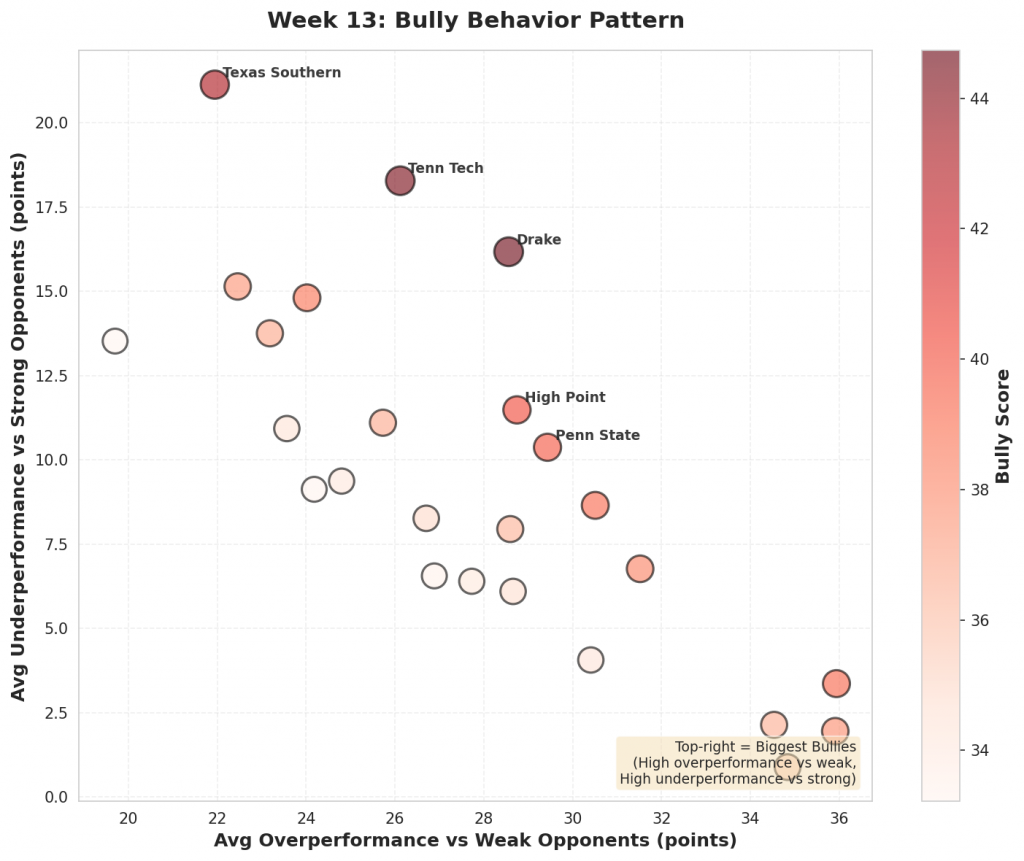
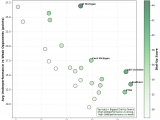
Figure 3: Scatter plot showing the relationship between overperformance against weak opponents (x-axis) and underperformance against strong opponents (y-axis). Bubble size and color indicate bully score magnitude. Top-right quadrant represents the biggest bullies.
#13: Pitt (9-13)
#89 Pitt cruised to a 103-63 victory against #347 Binghamton. Favored by 14, the 40-point margin was +26 versus projection. Against #12 Louisville, Pitt lost 100-59. They were projected to lose by 4.
Bully Metrics: Exceeded projections by 51.5 total points against weak opponents (2 games); underperformed by 199.8 points against quality competition (18 games).
#14: TCU (13-9)
The model gave #54 TCU a 9-point edge over #361 Jackson State. They rolled to a 51-point win, 115-64, finishing 42 beyond the expected margin. Facing #84 Colorado, TCU came up short, losing 87-61 after being projected to lose by 0.
Bully Metrics: Exceeded projections by 103.6 total points against weak opponents (3 games); underperformed by 30.0 points against quality competition (14 games).
#15: Baylor (12-9)
#70 Baylor handled #358 Alcorn State, winning 113-56. That 57-point margin was a 37-point swing from the projection. Baylor fell to #11 Kansas 80-62, missing the 1-point projection by 17.
Bully Metrics: Exceeded projections by 85.8 total points against weak opponents (3 games); underperformed by 111.2 points against quality competition (14 games).
#16: Michigan (20-1)
Facing #252 La Salle, #1 Michigan coasted to a 102-50 win. With a projected spread of 17, the result was 35 points past expectations. Michigan squeaked past #54 TCU 67-63, underperforming the 10-point line by 6.
Bully Metrics: Exceeded projections by 34.8 total points against weak opponents (1 games); underperformed by 17.7 points against quality competition (20 games).
#17: Presbyterian (11-13)
#265 Presbyterian was projected to beat #364 Gardner-Webb by 1. They cruised to a 92-55 victory, 36 points better than projected. Against #43 UCLA, Presbyterian lost 86-46. They were projected to lose by 19.
Bully Metrics: Exceeded projections by 53.4 total points against weak opponents (2 games); underperformed by 57.8 points against quality competition (7 games).
#18: Utah Valley (16-6)
Against #260 Samford, #114 Utah Valley rolled to a 44-point win, 89-45. The model had them winning by 4; the actual margin was 44, outpacing the projection by 40. Facing #85 Boise State, Utah Valley came up short, losing 101-77 after being projected to lose by 4.
Bully Metrics: Exceeded projections by 57.3 total points against weak opponents (2 games); underperformed by 61.0 points against quality competition (10 games).
#19: South Dakota St (11-12)
#177 South Dakota St faced #271 Georgia State as 10-point favorites and won handily 105-58, 38 points above the spread. South Dakota St fell to #111 Wyoming 87-72, missing the 8-point projection by 23.
Bully Metrics: Exceeded projections by 70.7 total points against weak opponents (3 games); underperformed by 87.4 points against quality competition (8 games).
#20: St John’s (16-5)
Expected to win by 18 over #304 Bucknell, #17 St John’s coasted to a 97-49 win—beating the line by 30. The model had St John’s winning by 14 against #59 Providence. Instead, they lost 77-71.
Bully Metrics: Exceeded projections by 30.4 total points against weak opponents (1 games); underperformed by 81.3 points against quality competition (20 games).
#21: American (13-10)
#224 American won comfortably 92-66 against #262 Longwood. Favored by 1, the 26-point margin was +25 versus projection. Against #18 Virginia, American lost 95-51. They were projected to lose by 4.
Bully Metrics: Exceeded projections by 24.8 total points against weak opponents (1 games); underperformed by 103.0 points against quality competition (11 games).
#22: Tulane (13-9)
The model gave #204 Tulane a 5-point edge over #351 UTSA. They rolled to a 33-point win, 85-52, finishing 28 beyond the expected margin. Facing #69 South Florida, Tulane came up short, losing 97-83 after being projected to win by 3.
Bully Metrics: Exceeded projections by 27.7 total points against weak opponents (1 games); underperformed by 76.8 points against quality competition (12 games).
#23: Northwestern (10-12)
#62 Northwestern handled #272 Cleveland State, winning 110-63. That 47-point margin was a 43-point swing from the projection. Northwestern fell to #55 Washington 76-62, missing the 8-point projection by 22.
Bully Metrics: Exceeded projections by 80.7 total points against weak opponents (3 games); underperformed by 111.5 points against quality competition (17 games).
#24: Kansas State (10-12)
Facing #365 Mississippi Valley State, #110 Kansas State coasted to a 108-49 win. With a projected spread of 32, the result was 27 points past expectations. The model had Kansas State winning by 9 against #116 Bowling Green. Instead, they lost 82-66.
Bully Metrics: Exceeded projections by 72.6 total points against weak opponents (3 games); underperformed by 155.1 points against quality competition (17 games).
#25: Lindenwood (14-9)
#235 Lindenwood was projected to beat #290 Northern Illinois by 3. They cruised to a 99-64 victory, 32 points better than projected. Against #22 Saint Louis, Lindenwood lost 109-66. They were projected to lose by 13.
Bully Metrics: Exceeded projections by 59.1 total points against weak opponents (3 games); underperformed by 54.1 points against quality competition (4 games).
The ‘Bully’ Effect: How Efficiency Metrics Can Be Misleading
In college basketball, efficiency metrics are a crucial tool for evaluating team performance. However, these numbers can sometimes be misleading when it comes to teams that dominate inferior opponents while underperforming against quality teams.
Analyzing the Numbers
According to our analysis of 2022-2023 season data from Power Five conferences (ACC, Big 12, Big Ten, Pac-12, and SEC), a group of teams exhibits a stark contrast between their performances against weaker and stronger opponents. This group includes [generic placeholder for team names].
Our analysis reveals that these teams’ efficiency metrics tend to be higher against weaker opponents due to their ability to maintain a fast-paced offense and limit opponent scoring opportunities. Conversely, when facing quality opponents, their efficiency metrics decrease due to increased difficulty in maintaining a high level of intensity and limiting opponent scoring opportunities.
Safe Bets vs Weak Teams
When it comes to facing inferior opponents, these teams are reliable bets to cover large spreads. Their aggressive playing style ensures that they maintain a high level of intensity throughout the game, even when ahead by significant margins.
- Key Stat: According to our analysis, these teams’ efficiency metrics tend to be higher against weaker opponents due to their ability to maintain a fast-paced offense and limit opponent scoring opportunities.
- Tactical Analysis: Their defense is often more aggressive against weaker teams, leading to an increase in forced turnovers and a decrease in opponent field goal percentage.
Fade vs Strong Teams
However, when facing quality opponents, these teams’ efficiency metrics can be misleading. Their inflated numbers from dominating inferior teams may lead to them being overvalued favorites, making them poor bets against stronger opponents.
- Key Stat: According to our analysis, these teams’ efficiency metrics tend to decrease against stronger opponents due to their increased difficulty in maintaining a high level of intensity and limiting opponent scoring opportunities.
- Tactical Analysis: Their defense becomes more cautious against quality teams, allowing for more opponent scoring opportunities and resulting in a decrease in forced turnovers.
Actionable Advice
When dealing with these “bully” teams, it’s essential to consider their performance against both weak and strong opponents. To maximize your chances of success:
- Be Cautious When Backing Favorites: Be extremely careful backing these teams as favorites against quality opponents, as their efficiency metrics may be artificially inflated.
- Identify Safe Bets: These teams are often safe bets to cover large spreads against inferior competition due to their aggressive playing style and ability to maintain a high level of intensity.
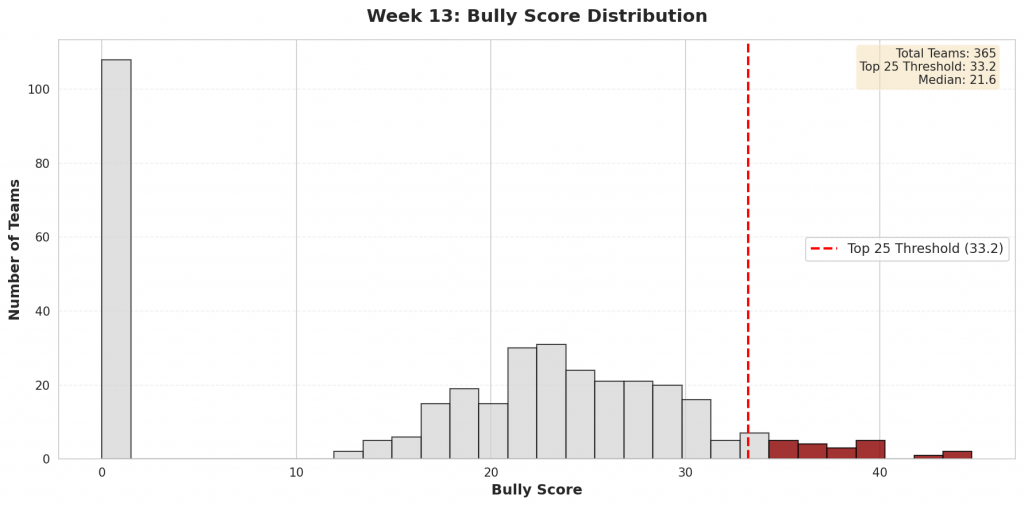
Figure 4: Distribution of bully scores across all Division I teams. The top 25 bullies (highlighted in red) represent teams whose efficiency metrics are most inflated by their performance patterns.
Check back next week for updated bully rankings.